1. ALLTEL CORPORATION
CONSOLIDATED HIGHLIGHTS AND OTHER FINANCIAL INFORMATION (UNAUDITED)
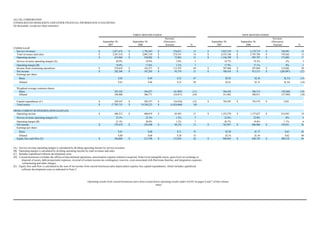
(In thousands, except per share amounts)
THREE MONTHS ENDED NINE MONTHS ENDED
Increase Increase
September 30, September 30, (Decrease) September 30, September 30, (Decrease)
2007 2006 Amount % 2007 2006 Amount %
UNDER GAAP:
Service revenues $ 2,071,474 $ 1,795,443 $ 276,031 15 $ 5,923,210 $ 5,178,719 $ 744,491 14
Total revenues and sales $ 2,281,510 $ 2,007,319 $ 274,191 14 $ 6,535,146 $ 5,795,784 $ 739,362 13
Operating income $ 433,964 $ 358,002 $ 75,962 21 $ 1,166,789 $ 993,787 $ 173,002 17
Service revenue operating margin (A) 20.9% 19.9% 1.0% 5 19.7% 19.2% .5% 3
Operating margin (B) 19.0% 17.8% 1.2% 7 17.9% 17.1% .8% 5
Income from continuing operations $ 278,624 $ 165,271 $ 113,353 69 $ 707,486 $ 587,884 $ 119,602 20
Net income $ 282,584 $ 187,205 $ 95,379 51 $ 708,418 $ 913,515 $ (205,097) (22)
Earnings per share:
Basic $.82 $.49 $.33 67 $2.03 $2.36 $(.33) (14)
Diluted $.81 $.48 $.33 69 $2.01 $2.35 $(.34) (14)
Weighted average common shares:
Basic 343,542 384,637 (41,095) (11) 348,454 386,714 (38,260) (10)
Diluted 346,900 386,771 (39,871) (10) 351,462 388,911 (37,449) (10)
Capital expenditures (C) $ 249,547 $ 284,357 $ (34,810) (12) $ 744,595 $ 742,574 $ 2,021 -
Total assets $ 17,705,755 $ 19,330,223 $ (1,624,468) (8)
FROM CURRENT BUSINESSES (NON-GAAP) (D):
Operating income $ 486,312 $ 400,819 $ 85,493 21 $ 1,352,570 $ 1,137,627 $ 214,943 19
Service revenue operating margin (A) 23.5% 22.3% 1.2% 5 22.8% 22.0% .8% 4
Operating margin (B) 21.3% 20.0% 1.3% 7 20.7% 19.6% 1.1% 6
Net income $ 279,476 $ 230,200 $ 49,276 21 $ 765,997 $ 606,966 $ 159,031 26
Earnings per share:
Basic $.81 $.60 $.21 35 $2.20 $1.57 $.63 40
Diluted $.80 $.60 $.20 33 $2.18 $1.56 $.62 40
Equity free cash flow (E) $ 346,806 $ 213,788 $ 133,018 62 $ 948,963 $ 648,745 $ 300,218 46
(A) Service revenue operating margin is calculated by dividing operating income by service revenues.
(B) Operating margin is calculated by dividing operating income by total revenues and sales.
(C) Includes capitalized software development costs.
(D) Current businesses excludes the effects of discontinued operations, amortization expense related to acquired, finite-lived intangible assets, gain (loss) on exchange or
disposal of assets, debt prepayment expenses, reversal of certain income tax contingency reserves, costs associated with Hurricane Katrina, and integration expenses,
restructuring and other charges.
(E) Equity free cash flow is calculated as the sum of net income from current businesses plus depreciation expense less capital expenditures, which includes capitalized
software development costs as indicated in Note C.
Operating results from current businesses have been reconciled to operating results under GAAP on pages 6 and 7 of this release.
-more-
2. ALLTEL CORPORATION
CONSOLIDATED STATEMENTS OF INCOME UNDER GAAP (UNAUDITED)-Page 2
(In thousands, except per share amounts)
THREE MONTHS ENDED NINE MONTHS ENDED
September 30, September 30, September 30, September 30,
2007 2006 2007 2006
Revenues and sales:
Service revenues $ 2,071,474 $ 1,795,443 $ 5,923,210 $ 5,178,719
Product sales 210,036 211,876 611,936 617,065
Total revenues and sales 2,281,510 2,007,319 6,535,146 5,795,784
Costs and expenses:
Cost of services 682,227 610,102 1,933,434 1,726,863
Cost of products sold 299,961 293,754 876,108 849,802
Selling, general, administrative and other 496,133 438,325 1,445,473 1,298,530
Depreciation and amortization 358,242 307,136 1,060,018 916,012
Integration expenses, restructuring and other charges 10,983 - 53,324 10,790
Total costs and expenses 1,847,546 1,649,317 5,368,357 4,801,997
Operating income 433,964 358,002 1,166,789 993,787
Equity earnings in unconsolidated partnerships 17,136 17,281 48,521 45,612
Minority interest in consolidated partnerships (8,806) (11,729) (27,389) (37,106)
Other income, net 5,904 37,308 19,167 69,115
Interest expense (46,238) (63,822) (140,370) (234,976)
Gain (loss) on exchange or disposal of assets and other - (50,501) 56,548 126,138
Income from continuing operations before income taxes 401,960 286,539 1,123,266 962,570
Income taxes 123,336 121,268 415,780 374,686
Income from continuing operations 278,624 165,271 707,486 587,884
Income from discontinued operations 3,960 21,934 932 325,631
Net income 282,584 187,205 708,418 913,515
Preferred dividends 20 21 59 63
Net income applicable to common shares $ 282,564 $ 187,184 $ 708,359 $ 913,452
Basic earnings per share:
Income from continuing operations $.81 $.43 $2.03 $1.52
Income from discontinued operations .01 .06 - .84
Net income $.82 $.49 $2.03 $2.36
Diluted earnings per share:
Income from continuing operations $.80 $.43 $2.01 $1.51
Income from discontinued operations .01 .05 - .84
Net income $.81 $.48 $2.01 $2.35
-more-
3. ALLTEL CORPORATION
CONSOLIDATED BALANCE SHEETS UNDER GAAP (UNAUDITED)-Page 3
(In thousands)
ASSETS LIABILITIES AND SHAREHOLDERS' EQUITY
September 30, December 31, September 30, December 31,
2007 2006 2007 2006
CURRENT ASSETS: CURRENT LIABILITIES:
Cash and short-term investments $ 824,647 $ 934,228 Current maturities of long-term debt $ 39,045 $ 36,285
Accounts receivable (less allowance for Accounts payable 523,467 576,126
doubtful accounts of $73,201 and Advance payments and customer deposits 199,559 186,193
$54,865, respectively) 872,610 807,307 Accrued taxes 316,485 114,109
Inventories 166,852 218,629 Accrued dividends 43,075 46,039
Prepaid expenses and other 84,097 67,665 Accrued interest 48,746 79,281
Assets related to discontinued operations - 4,321 Other current liabilities 188,496 156,471
Liabilities related to discontinued operations - 2,761
Total current assets 1,948,206 2,032,150
Total current liabilities 1,358,873 1,197,265
Investments 188,763 368,871
Goodwill 8,421,152 8,447,013
Other intangibles 2,000,975 2,129,346 Long-term debt 2,665,284 2,697,412
Deferred income taxes 1,085,377 1,109,479
PROPERTY, PLANT AND EQUIPMENT: Other liabilities 654,429 677,609
Land 335,008 314,902
Buildings and improvements 1,011,518 955,061 Total liabilities 5,763,963 5,681,765
Operating plant and equipment 8,519,059 7,933,840
Information processing 1,142,821 1,048,136
Furniture and fixtures 184,776 173,835 SHAREHOLDERS' EQUITY:
Under construction 358,880 495,968 Preferred stock 251 258
Common stock 344,485 364,572
Total property, plant and equipment 11,552,062 10,921,742 Additional paid-in capital 3,050,253 4,296,786
Less accumulated depreciation 6,520,741 5,690,360 Accumulated other comprehensive income (loss) (25,064) 9,525
Retained earnings 8,571,867 7,990,808
Net property, plant and equipment 5,031,321 5,231,382
Total shareholders' equity 11,941,792 12,661,949
Other assets 115,338 89,455
Assets related to discontinued operations - 45,497
TOTAL LIABILITIES AND
TOTAL ASSETS $ 17,705,755 $ 18,343,714 SHAREHOLDERS' EQUITY $ 17,705,755 $ 18,343,714
-more-
4. ALLTEL CORPORATION
CONSOLIDATED STATEMENTS OF CASH FLOWS UNDER GAAP (UNAUDITED)-Page 4
(In thousands)
THREE MONTHS ENDED NINE MONTHS ENDED
September 30, September 30, September 30, September 30,
2007 2006 2007 2006
Cash Flows from Operating Activities:
Net income $ 282,584 $ 187,205 $ 708,418 $ 913,515
Adjustments to reconcile net income to net cash provided from operating activities:
Income from discontinued operations (3,960) (21,934) (932) (325,631)
Depreciation and amortization expense 358,242 307,136 1,060,018 916,012
Provision for doubtful accounts 54,099 66,480 140,926 179,873
Non-cash portion of loss (gain) on exchange or disposal of assets and other - 27,546 (56,548) (149,093)
Change in deferred income taxes (16,636) (15,068) 30,457 6,199
Adjustment to income tax liabilities, including contingency reserves (33,762) - (33,762) -
Other, net (8,511) (1,984) (24,674) (6,318)
Changes in operating assets and liabilities, net of effects of
acquisitions and dispositions:
Accounts receivable (86,678) (109,788) (207,512) (245,903)
Inventories 39,621 (31,417) 51,777 39,583
Accounts payable 27,239 32,845 (54,436) (35,312)
Other current liabilities 101,771 (99,193) 235,571 (255,106)
Other, net 12,062 12,857 (10,523) (40,827)
Net cash provided from operating activities 726,071 354,685 1,838,780 996,992
Cash Flows from Investing Activities:
Additions to property, plant and equipment (242,461) (277,373) (720,279) (718,574)
Additions to capitalized software development costs (7,086) (6,984) (24,316) (24,000)
Purchases of property, net of cash acquired - (130) (6,250) (676,548)
Proceeds from the sale of investments - 560 188,711 200,481
Proceeds from the return on investments 15,444 14,471 40,255 36,748
Other, net 240 (3,631) 920 7,746
Net cash used in investing activities (233,863) (273,087) (520,959) (1,174,147)
Cash Flows from Financing Activities:
Dividends paid on common and preferred stock (43,001) (149,943) (133,527) (447,095)
Repayments of long-term debt (100,661) (1,011,496) (36,915) (1,012,226)
Repurchases of common stock - (709,001) (1,360,298) (709,001)
Cash payments to effect conversion of convertible notes - - - (59,848)
Distributions to minority investors (10,772) (7,415) (31,827) (27,708)
Excess tax benefits from stock option exercises 20,535 3,532 25,704 9,189
Common stock issued 6,080 102,895 59,038 191,479
Net cash used in financing activities (127,819) (1,771,428) (1,477,825) (2,055,210)
Cash Flows from Discontinued Operations:
Cash provided from (used in) operating activities 3,960 (4,049) 2,782 595,435
Cash provided from investing activities - 2,254,581 47,641 3,746,596
Cash used in financing activities - (1,164) - (195)
Net cash provided from discontinued operations 3,960 2,249,368 50,423 4,341,836
Effect of exchange rate changes on cash and short-term investments - - - (5,879)
Increase (decrease) in cash and short-term investments 368,349 559,538 (109,581) 2,103,592
Cash and Short-term Investments:
Beginning of the period 456,298 2,526,461 934,228 982,407
End of the period $ 824,647 $ 3,085,999 $ 824,647 $ 3,085,999
-more-
5. ALLTEL CORPORATION
SUPPLEMENTAL OPERATING INFORMATION (UNAUDITED)-Page 5
(Dollars in thousands, except per customer amounts)
THREE MONTHS ENDED NINE MONTHS ENDED
Increase Increase
September 30, September 30, (Decrease) September 30, September 30, (Decrease)
2007 2006 Amount % 2007 2006 Amount %
Controlled POPs 79,575,793 76,974,746 2,601,047 3
Customers 12,447,085 11,162,300 1,284,785 12
Penetration rate 15.6% 14.5% 1.1% 8
Average customers 12,338,361 11,133,165 1,205,196 11 12,140,297 10,933,578 1,206,719 11
Gross customer additions:
Internal 904,801 829,304 75,497 9 2,562,235 2,405,347 156,888 7
Acquired, net of divested - (23,904) 23,904 100 - 88,191 (88,191) (100)
Total 904,801 805,400 99,401 12 2,562,235 2,493,538 68,697 3
Net customer additions:
Internal 205,019 101,059 103,960 103 623,147 411,785 211,362 51
Acquired, net of divested - (23,904) 23,904 100 - 88,191 (88,191) (100)
Total 205,019 77,155 127,864 166 623,147 499,976 123,171 25
Cash costs from current businesses:
Cost of services $ 682,227 $ 610,102 $ 72,125 12 $ 1,933,434 $ 1,729,098 $ 204,336 12
Cost of products sold 299,961 293,754 6,207 2 876,108 849,802 26,306 3
Selling, general, administrative and other 496,133 434,699 61,434 14 1,445,473 1,294,904 150,569 12
Less product sales 210,036 211,876 (1,840) (1) 611,936 617,065 (5,129) (1)
Total $ 1,268,285 $ 1,126,679 $ 141,606 13 $ 3,643,079 $ 3,256,739 $ 386,340 12
Cash costs from current businesses
per unit per month (A) $34.26 $33.73 $.53 2 $33.34 $33.10 $.24 1
Revenues:
Service revenues $ 2,071,474 $ 1,795,443 $ 276,031 15 $ 5,923,210 $ 5,178,719 $ 744,491 14
Less wholesale roaming revenues 196,488 171,459 25,029 15 520,796 486,052 34,744 7
Less wholesale transport revenues 38,158 32,245 5,913 18 127,442 50,439 77,003 153
Retail revenues $ 1,836,828 $ 1,591,739 $ 245,089 15 $ 5,274,972 $ 4,642,228 $ 632,744 14
Average revenue per customer per month (B) $55.96 $53.76 $2.20 4 $54.21 $52.63 $1.58 3
Retail revenue per customer per month (C) $49.62 $47.66 $1.96 4 $48.28 $47.18 $1.10 2
Retail minutes of use per customer per month (D) 746 645 101 16 708 629 79 13
Postpay churn 1.31% 1.67% (.36%) (22) 1.27% 1.60% (.33%) (21)
Total churn 1.90% 2.18% (.28%) (13) 1.78% 2.03% (.25%) (12)
(A) Cash costs from current businesses per unit per month is calculated by dividing the sum of the current businesses reported cost of services, cost of products sold, selling,
general, administrative and other expenses less product sales by the number of average customers for the period. Measured utilizing amounts per the Consolidated Statements
of Income under GAAP, cash costs per unit per month were $34.26 and $33.34 for the three and nine months ended September 30, 2007, respectively, and $33.84 and $33.11
for the same periods of 2006, respectively.
(B) Average revenue per customer per month is calculated by dividing service revenues by average customers for the period.
(C) Retail revenue per customer per month is calculated by dividing retail revenues (service revenues less wholesale revenues) by average customers for the period.
(D) Retail minutes of use per customer per month represents the average monthly minutes that Alltel's customers use on both the Company's network and while roaming on
other carriers' networks.
Operating results from current businesses have been reconciled to operating results under GAAP on pages 6 and 7 of this release.
-more-
6. ALLTEL CORPORATION
RECONCILIATIONS OF RESULTS OF OPERATIONS UNDER GAAP TO RESULTS OF OPERATIONS FROM CURRENT BUSINESSES (NON-GAAP) (UNAUDITED)-Page 6
(In thousands)
THREE MONTHS ENDED SEPTEMBER 30, 2007
Selling, Income Income
General, Depreciation Before From Basic Diluted
Cost of Administrative and Operating Income Income Continuing Net Earnings Earnings
Services and Other Amortization Income Taxes Taxes Operations Income Per Share Per Share
Under GAAP $ 682,227 $ 496,133 $ 358,242 $ 433,964 $ 401,960 $ 123,336 $ 278,624 $ 282,584 $.82 $.81
Items excluded from measuring results
from current businesses:
Amortization expense
related to acquired, finite-
lived intangible assets (A) - - (41,365) 41,365 41,365 16,091 25,274 25,274 .07 .07
Integration expenses,
restructuring and
other charges (B)(C) - - - 10,983 10,983 3,320 7,663 7,663 .02 .02
Reversal of certain income
tax contingency reserves (E) - - - - - 32,085 (32,085) (32,085) (.09) (.09)
Income from discontinued
operations (L) - - - - - - - (3,960) (.01) (.01)
Net increase (decrease) - - (41,365) 52,348 52,348 51,496 852 (3,108) (.01) (.01)
From current businesses $ 682,227 $ 496,133 $ 316,877 $ 486,312 $ 454,308 $ 174,832 $ 279,476 $ 279,476 $.81 $.80
THREE MONTHS ENDED SEPTEMBER 30, 2006
Selling, Income Income
General, Depreciation Before From Basic Diluted
Cost of Administrative and Operating Income Income Continuing Net Earnings Earnings
Services and Other Amortization Income Taxes Taxes Operations Income Per Share Per Share
Under GAAP $ 610,102 $ 438,325 $ 307,136 $ 358,002 $ 286,539 $ 121,268 $ 165,271 $ 187,205 $.49 $.48
Items excluded from measuring results
from current businesses:
Amortization expense
related to acquired, finite-
lived intangible assets (A) - - (39,191) 39,191 39,191 15,245 23,946 23,946 .06 .06
Compensation expense due
to accelerated vesting of
restricted stock (G) - (3,626) - 3,626 3,626 1,413 2,213 2,213 .01 .01
Loss on exchange or
disposal of assets and
other (H) - - - - 50,501 11,731 38,770 38,770 .10 .10
Income from discontinued
operations (L) - - - - - - - (21,934) (.06) (.05)
Net increase (decrease) - (3,626) (39,191) 42,817 93,318 28,389 64,929 42,995 .11 .12
From current businesses $ 610,102 $ 434,699 $ 267,945 $ 400,819 $ 379,857 $ 149,657 $ 230,200 $ 230,200 $.60 $.60
-more-
7. ALLTEL CORPORATION
RECONCILIATIONS OF RESULTS OF OPERATIONS UNDER GAAP TO RESULTS OF OPERATIONS FROM CURRENT BUSINESSES (NON-GAAP) (UNAUDITED)-Page 7
(In thousands)
NINE MONTHS ENDED SEPTEMBER 30, 2007
Selling, Income Income
General, Depreciation Before From Basic Diluted
Cost of Administrative and Operating Income Income Continuing Net Earnings Earnings
Services and Other Amortization Income Taxes Taxes Operations Income Per Share Per Share
Under GAAP $ 1,933,434 $ 1,445,473 $ 1,060,018 $ 1,166,789 $ 1,123,266 $ 415,780 $ 707,486 $ 708,418 $2.03 $2.01
Items excluded from measuring results
from current businesses:
Amortization expense
related to acquired, finite-
lived intangible assets (A) - - (132,457) 132,457 132,457 51,526 80,931 80,931 .23 .23
Integration expenses,
restructuring and
other charges (B)(C)(D) - - - 53,324 53,324 6,903 46,421 46,421 .13 .13
Gain on disposal of assets (F) - - - - (56,548) (19,792) (36,756) (36,756) (.10) (.10)
Reversal of certain income
tax contingency reserves (E) - - - - - 32,085 (32,085) (32,085) (.09) (.09)
Income from discontinued
operations (L) - - - - - - - (932) - -
Net increase (decrease) - - (132,457) 185,781 129,233 70,722 58,511 57,579 .17 .17
From current businesses $ 1,933,434 $ 1,445,473 $ 927,561 $ 1,352,570 $ 1,252,499 $ 486,502 $ 765,997 $ 765,997 $2.20 $2.18
NINE MONTHS ENDED SEPTEMBER 30, 2006
Selling, Income Income
General, Depreciation Before From Basic Diluted
Cost of Administrative and Operating Income Income Continuing Net Earnings Earnings
Services and Other Amortization Income Taxes Taxes Operations Income Per Share Per Share
Under GAAP $ 1,726,863 $ 1,298,530 $ 916,012 $ 993,787 $ 962,570 $ 374,686 $ 587,884 $ 913,515 $2.36 $2.35
Items excluded from measuring results
from current businesses:
Amortization expense
related to acquired, finite-
lived intangible assets (A) - - (131,659) 131,659 131,659 51,215 80,444 80,444 .20 .20
Reversal of excess bad debt
reserve related to
Hurricane Katrina (J) 2,235 - - (2,235) (2,235) (869) (1,366) (1,366) - -
Compensation expense due
to accelerated vesting of
restricted stock (G) - (3,626) - 3,626 3,626 1,413 2,213 2,213 .01 .01
Gain on exchange or
disposal of assets and
other (H)(K) - - - - (126,138) (57,336) (68,802) (68,802) (.18) (.18)
Integration expenses,
restructuring and
other charges (I) - - - 10,790 10,790 4,197 6,593 6,593 .02 .02
Income from discontinued
operations (L) - - - - - - - (325,631) (.84) (.84)
Net increase (decrease) 2,235 (3,626) (131,659) 143,840 17,702 (1,380) 19,082 (306,549) (.79) (.79)
From current businesses $ 1,729,098 $ 1,294,904 $ 784,353 $ 1,137,627 $ 980,272 $ 373,306 $ 606,966 $ 606,966 $1.57 $1.56
-more-
8. ALLTEL CORPORATION
RECONCILIATIONS OF RESULTS OF OPERATIONS UNDER GAAP TO RESULTS OF OPERATIONS FROM CURRENT BUSINESSES (NON-GAAP) (UNAUDITED)-Page 8
(In thousands)
THREE MONTHS ENDED NINE MONTHS ENDED
September 30, September 30, September 30, September 30,
2007 2006 2007 2006
Net cash provided from operations $ 726,071 $ 354,685 $ 1,838,780 $ 996,992
Adjustments to reconcile to net income under GAAP:
Income from discontinued operations 3,960 21,934 932 325,631
Depreciation and amortization expense (358,242) (307,136) (1,060,018) (916,012)
Provision for doubtful accounts (54,099) (66,480) (140,926) (179,873)
Non-cash portion of gain (loss) on exchange or disposal of assets and other - (27,546) 56,548 149,093
Change in deferred income taxes 16,636 15,068 (30,457) (6,199)
Adjustment to income tax liabilities, including contingency reserves 33,762 - 33,762 -
Other non-cash changes, net 8,511 1,984 24,674 6,318
Changes in operating assets and liabilities, net of effects of acquisitions and
dispositions (94,015) 194,696 (14,877) 537,565
Net income under GAAP 282,584 187,205 708,418 913,515
Adjustments to reconcile to net income from current businesses,
net of tax (see specific items listed on pages 6 and 7) (3,108) 42,995 57,579 (306,549)
Net income from current businesses 279,476 230,200 765,997 606,966
Adjustments to reconcile to equity free cash flow from current businesses:
Depreciation expense from current businesses 316,877 267,945 927,561 784,353
Capital expenditures (249,547) (284,357) (744,595) (742,574)
Equity free cash flow from current businesses $ 346,806 $ 213,788 $ 948,963 $ 648,745
-more-
9. ALLTEL CORPORATION
NOTES TO RECONCILIATIONS OF RESULTS OF OPERATIONS UNDER GAAP TO RESULTS OF OPERATIONS FROM CURRENT BUSINESSES (NON-GAAP)
(UNAUDITED)-Page 9
As disclosed in the ALLTEL Corporation (quot;Alltelquot; or the quot;Companyquot;) Form 8-K filed on October 19, 2007, Alltel has presented in this earnings release results of operations from current businesses which exclude the effects of discontinued operations,
amortization expense related to acquired, finite-lived intangible assets, gain (loss) on exchange or disposal of assets, debt prepayment expenses, reversal of certain income tax contingency reserves, costs associated with Hurricane Katrina, and integration
expenses, restructuring and other charges. Alltel's purpose for excluding items from the current business measures is to focus on Alltel's true earnings capacity associated with providing wireless communications services. Management believes the items
excluded from the current business measures are related to strategic activities or other events, specific to the time and opportunity available, and, accordingly, should be excluded when evaluating the trends of the Company's operations.
Alltel believes that presenting the current business measures assists investors in assessing the true business performance of the Company by clarifying for investors the effects that certain items such as asset sales, integration expenses and other business
consolidation costs arising from past acquisition and integration activities had on the Company's GAAP consolidated results of operations. The Company uses results from current businesses as management's primary measure of the performance of its
business operations. Alltel's management, including the chief operating decision-maker, uses the current business measures consistently for all purposes, including internal reporting purposes, the evaluation of business objectives, opportunities and
performance and the determination of management compensation.
(A) Eliminates the effects of amortization expense related to acquired, finite-lived intangible assets.
(B) On May 20, 2007, Alltel entered into an agreement to be acquired by two private investment firms, TPG Partners V, L.P. and GS Capital Partners VI Fund, L.P. Completion of the merger transaction, which is currently expected to occur during the fourth quarter
of 2007, is contingent upon customary closing conditions, including approval by Alltel's shareholders and certain regulatory approvals, including the approval of the Federal Communications Commission (quot;FCCquot;). On August 29, 2007, at a special meeting,
shareholders of Alltel approved the merger transaction. In connection with this transaction, Alltel incurred $2.5 million and $35.6 million of incremental costs during the three and nine months ended September 30, 2007, respectively, principally consisting of
financial advisory, legal and regulatory filing fees.
(C) During the third quarter of 2007, the Company incurred $5.6 million of integration expenses related to its acquisitions of Midwest Wireless Holdings (quot;Midwest Wirelessquot;) and wireless properties in Illinois, Texas and Virginia completed during 2006
(collectively, quot;the 2006 acquisitionsquot;). These expenses primarily consisted of branding, signage and computer system conversion costs. Alltel also recorded $2.6 million of lease termination costs and $0.3 million of severance and employee benefit costs
associated with the closing of a call center.
(D) During the first half of 2007, the Company incurred $4.8 million of integration expenses related to the 2006 acquisitions consisting of branding, signage and computer system conversion costs. Alltel also recorded a pretax charge of $4.4 million associated with
the closing of two call centers, consisting of severance and employee benefit costs related to a planned workforce reduction.
(E) During the third quarter of 2007, as a result of the expiration of certain state statutes of limitations, Alltel recorded a reduction in its gross unrecognized tax benefits for uncertain tax positions and related gross deferred tax assets. The adjustments to the tax
liabilities which included interest charges on potential assessments resulted in a reduction in income tax expense associated with continuing operations of $33.8 million, of which $32.1 million has been excluded from results of operations from current
businesses.
(F) Alltel completed the sale of marketable equity securities that had been acquired in connection with its August 1, 2005 merger with Western Wireless Corporation (quot;Western Wirelessquot;). In connection with the sale of these securities, Alltel recorded a pretax
gain of $56.5 million.
(G) In connection with the spin-off and merger of the Company's wireline telecommunications business, holders of Alltel restricted shares received approximately 1.034 shares of Windstream Corporation (quot;Windstreamquot;) restricted stock for each share of restricted
Alltel common stock held at the time of the distribution. The Windstream restricted shares received by Alltel employees became fully vested on August 3, 2006. Compensation expense resulting from the accelerated vesting of the Windstream restricted stock
awards amounted to $3.6 million. (See Notes H and L below for additional information regarding the spin-off and merger of Alltel’s wireline telecommunications business).
-more-
10. ALLTEL CORPORATION
NOTES TO RECONCILIATIONS OF RESULTS OF OPERATIONS UNDER GAAP TO RESULTS OF OPERATIONS FROM CURRENT BUSINESSES (NON-GAAP)
(UNAUDITED) (CONTINUED)-Page 10
(H) On July 17, 2006, in order to effect the spin-off of its wireline telecommunications business to its stockholders, Alltel contributed all of the assets of its wireline telecommunications business to ALLTEL Holding Corp. (quot;Alltel Holdingquot; or quot;Spincoquot;), a wholly-
owned subsidiary of the Company, in exchange for: (i) the issuance to Alltel of Spinco common stock that was distributed on a pro rata basis to Alltel's stockholders as a tax-free stock dividend, (ii) the payment of a special dividend to Alltel in the amount of
$2.3 billion and (iii) the distribution by Spinco to Alltel of $1.7 billion of Spinco debt securities. Also on July 17, 2006, Alltel completed a debt exchange in which Alltel transferred to two investment banks the Spinco debt securities received in the spin-off
transaction in exchange for certain Alltel debt securities, consisting of $988.5 million of commercial paper borrowings and $685.1 million of 4.656 percent notes due May 17, 2007. In completing the debt exchange, Alltel incurred a pretax loss of $27.5 million.
On August 25, 2006, Alltel repurchased prior to maturity $1.0 billion of long-term debt, consisting of $664.3 million of 4.656 percent equity unit notes due 2007, $61.0 million of 6.65 percent unsecured notes due 2008, $147.0 million of 7.60 percent unsecured
notes due 2009 and $127.7 million of 8.00 percent notes due 2010 pursuant to cash tender offers announced by the Company on July 31, 2006. Concurrent with the debt repurchase, Alltel also terminated the related pay variable/receive fixed, interest rate swap
agreement that had been designated as a fair value hedge against the 6.65 percent unsecured notes due 2008. In connection with the early termination of the debt and interest rate swap agreement, Alltel incurred net pretax termination fees of $23.0 million.
(I) The Company incurred $10.8 million of integration expenses related to its acquisition of Western Wireless. These expenses consisted of $8.3 million of rebranding costs and $2.5 million of system conversion costs and other integration costs.
(J) The Company recorded a $2.2 million reduction in its allowance for doubtful accounts to reflect lower than expected write-offs from service interruptions and customer displacement attributable to the effects of Hurricane Katrina. The additional bad debt
expense was originally recorded in the third quarter of 2005.
(K) During 2005, federal legislation was enacted which included provisions to dissolve and liquidate the assets of the Rural Telephone Bank (quot;RTBquot;). In connection with the dissolution and liquidation, during April 2006, the RTB redeemed all outstanding shares
of its Class C stock. As a result, Alltel received liquidating cash distributions of $198.7 million in exchange for its $22.1 million investment in RTB Class C stock.
(L) Eliminates the effects of discontinued operations.
As a condition of receiving approval from the Department of Justice (quot;DOJquot;) and the FCC for its acquisition of Midwest Wireless, on September 7, 2006, Alltel agreed to divest certain wireless operations in four rural markets in Minnesota. Accordingly, the
four markets to be divested in Minnesota have been classified as discontinued operations in the accompanying unaudited consolidated financial statements. On April 3, 2007, Alltel completed the sale of these properties.
On July 17, 2006, Alltel completed the spin-off of its wireline telecommunications business to its stockholders and the merger of that wireline business with Valor Communications Group, Inc. (quot;Valorquot;). The spin-off included the majority of Alltel's
communications support services, including directory publishing, information technology outsourcing services, retail long-distance and the wireline sales portion of communications products. The new wireline company formed in the merger of Alltel's
wireline operations and Valor is named Windstream Corporation. As a result, Alltel's historical results of operations have been adjusted to reflect the wireline business as discontinued operations in the accompanying unaudited consolidated financial
statements.
In addition, as a condition of receiving approval for the Western Wireless acquisition from the DOJ and the FCC, Alltel agreed to divest certain wireless operations of Western Wireless in 16 markets in Arkansas, Kansas and Nebraska. In December 2005,
Alltel completed an exchange of wireless properties with United States Cellular Corporation that included a substantial portion of the divestiture requirements related to the merger. In the first quarter of 2006, Alltel completed the required divestitures with the
sale of the remaining property in Arkansas. During 2005, Alltel completed the sales of the international operations in the countries of Georgia, Ghana and Ireland acquired from Western Wireless. During the second quarter of 2006, Alltel completed the sales
of the remaining international operations acquired from Western Wireless in the countries of Austria, Bolivia, Côte d’Ivoire, Haiti, and Slovenia. As a result, the acquired international operations and interests of Western Wireless and the 16 markets to be
divested in Arkansas, Kansas and Nebraska have been classified as discontinued operations in the accompanying unaudited consolidated financial statements.
-end-