
Recommended
More Related Content
What's hot
What's hot (17)
Viewers also liked
Viewers also liked (20)
Similar to ecolab 2003BusinessDescription
Similar to ecolab 2003BusinessDescription (20)
More from finance37
More from finance37 (20)
Recently uploaded
Recently uploaded (20)
ecolab 2003BusinessDescription
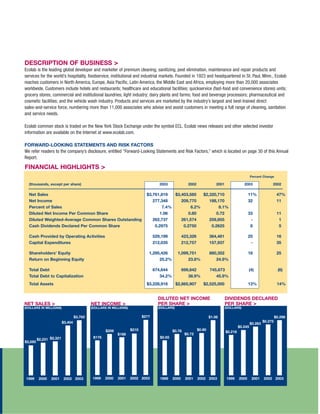
- 1. DESCRIPTION OF BUSINESS > Ecolab is the leading global developer and marketer of premium cleaning, sanitizing, pest elimination, maintenance and repair products and services for the world’s hospitality, foodservice, institutional and industrial markets. Founded in 1923 and headquartered in St. Paul, Minn., Ecolab reaches customers in North America, Europe, Asia Pacific, Latin America, the Middle East and Africa, employing more than 20,000 associates worldwide. Customers include hotels and restaurants; healthcare and educational facilities; quickservice (fast-food and convenience stores) units; grocery stores; commercial and institutional laundries; light industry; dairy plants and farms; food and beverage processors; pharmaceutical and cosmetic facilities; and the vehicle wash industry. Products and services are marketed by the industry’s largest and best-trained direct sales-and-service force, numbering more than 11,000 associates who advise and assist customers in meeting a full range of cleaning, sanitation and service needs. Ecolab common stock is traded on the New York Stock Exchange under the symbol ECL. Ecolab news releases and other selected investor information are available on the Internet at www.ecolab.com. FORWARD-LOOKING STATEMENTS AND RISK FACTORS We refer readers to the company’s disclosure, entitled “Forward-Looking Statements and Risk Factors,” which is located on page 30 of this Annual Report. FINANCIAL HIGHLIGHTS > Percent Change (thousands, except per share) 2003 2002 2001 2003 2002 Net Sales $3,761,819 $3,403,585 $2,320,710 11% 47% Net Income 277,348 209,770 188,170 32 11 Percent of Sales 7.4% 6.2% 8.1% Diluted Net Income Per Common Share 1.06 0.80 0.72 33 11 Diluted Weighted-Average Common Shares Outstanding 262,737 261,574 259,855 - 1 Cash Dividends Declared Per Common Share 0.2975 0.2750 0.2625 8 5 Cash Provided by Operating Activities 529,199 423,326 364,481 25 16 Capital Expenditures 212,035 212,757 157,937 - 35 Shareholders’ Equity 1,295,426 1,099,751 880,352 18 25 Return on Beginning Equity 25.2% 23.8% 24.9% Total Debt 674,644 699,842 745,673 (4) (6) Total Debt to Capitalization 34.2% 38.9% 45.9% Total Assets $3,228,918 $2,865,907 $2,525,000 13% 14% DILUTED NET INCOME DIVIDENDS DECLARED PER SHARE > PER SHARE > NET SALES > NET INCOME > (DOLLARS) (DOLLARS) (DOLLARS IN MILLIONS) (DOLLARS IN MILLIONS) $277 $3,762 $1.06 $0.298 $0.275 $3,404 $0.263 $0.245 $0.80 $210 $206 $0.78 $0.218 $0.72 $188 $0.65 $176 $2,231 $2,321 $2,050 1999 2000 2001 2002 2003 1999 2000 2001 2002 2003 1999 2000 2001 2002 2003 1999 2000 2001 2002 2003