1. DESCRIPTION OF BUSINESS
Ecolab is the leading global developer and marketer of premium cleaning, sanitizing, pest elimination, maintenance and repair
products and services for the world’s hospitality, foodservice, healthcare and industrial markets. Founded in 1923 and
headquartered in St. Paul, Minn., Ecolab reaches customers in more than 160 countries across North America, Europe, Asia
Pacific, Latin America, the Middle East and Africa, and employs more than 22,000 associates worldwide. Customers include hotels
and restaurants; healthcare and educational facilities; quickservice (fast-food and convenience stores) units; grocery stores;
commercial and institutional laundries; light industry; dairy plants and farms; food and beverage processors; pharmaceutical and
cosmetic facilities; and the vehicle wash industry. Products and services are marketed by the industry’s largest and best-trained
direct sales-and-service force, numbering nearly 13,000 associates, who advise and assist customers in meeting a full range of
cleaning, sanitation and service needs.
Ecolab common stock is traded on the New York Stock Exchange under the symbol ECL. Ecolab news releases and other
selected investor information are available on the Internet at www.ecolab.com.
FORWARD-LOOKING STATEMENTS AND RISK FACTORS
We refer readers to the company’s disclosure, entitled “Forward-Looking Statements and Risk Factors,” which is located on page
30 of this Annual Report.
FINANCIAL HIGHLIGHTS
Percent Change
(thousands, except per share) 2005 2004 2003 2005 2004
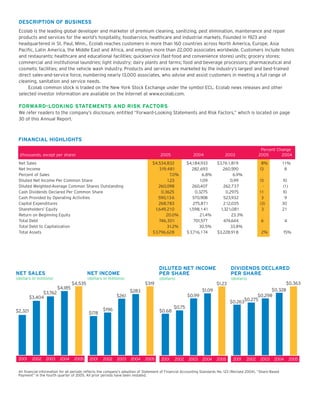
Net Sales $4,534,832 $4,1 84,933 $3,76 1,81 9 8% 1 1%
Net Income 3 19,48 1 282,693 260,590 13 8
Percent of Sales 7.0% 6.8% 6.9%
Diluted Net Income Per Common Share 1.23 1.09 0.99 13 10
Diluted Weighted-Average Common Shares Outstanding 260,098 260,407 262,737 - (1 )
Cash Dividends Declared Per Common Share 0.3625 0.3275 0.2975 11 10
Cash Provided by Operating Activities 590,1 3 6 570,908 523,932 3 9
Capital Expenditures 268,783 275,87 1 2 12,035 (3) 30
Shareholders’ Equity 1,649,2 1 0 1,598, 1 4 1 1,32 1,08 1 3 21
Return on Beginning Equity 20.0% 2 1.4% 23.3%
Total Debt 746,30 1 701,577 674,644 6 4
Total Debt to Capitalization 3 1.2% 30.5% 33.8%
Total Assets $3,796,628 $ 3,716, 1 74 $3,228,91 8 2% 15%
DILUTED NET INCOME DIVIDENDS DECLARED
NET SALES NET INCOME PER SHARE PER SHARE
(dollars in millions) (dollars in millions) (dollars) (dollars)
$0.363
$4,535 $319 $1.23
$4,185 $0.328
$1.09
$283
$3,762
$0.99 $0.298
$261
$3,404
$0.263$0.275
$0.75
$196 $0.68
$2,321 $178
2001 2002 2003 2004 2005 2001 2002 2003 2004 2005 2001 2002 2003 2004 2005 2001 2002 2003 2004 2005
All financial information for all periods reflects the company’s adoption of Statement of Financial Accounting Standards No. 123 (Revised 2004), “Share-Based
Payment” in the fourth quarter of 2005. All prior periods have been restated.
2. NET SALES ECOLAB BUSINESS MIX 2005
(dollars in millions)
$4,535
$4,185
● International 49%
United States 51%
$3,762
● Institutional 25% Europe/Middle East/Africa 34%
● Food & Beverage 7% Asia Pacific 8%
● Pest Elimination 6% Canada 3%
● Kay 5% Latin America 3%
● GCS Service 3% Other 1%
● Professional Products 1%
● Healthcare 1%
● Vehicle Care 1%
● Textile Care 1%
● Water Care Services 1%
2003 2004 2005
CUSTOMERS/MARKETS SERVED
CUSTOMER SEGMENTS
Food, beverage and brewery plants Government facilities
Full-service restaurants
Pharmaceutical and cosmetic facilities Airlines
Quickservice restaurants
Office buildings Light manufacturing industries
Hotels
Shopping malls Vehicle wash and detailing
Food retail
Retail facilities
Schools
MARKETS
Movie theaters
Colleges and universities
Recreational facilities United States
Laundries and textile rental
Amusement parks Europe/Middle East/Africa
Hospitals
Building service contractors Asia Pacific
Nursing homes
Cruise lines Canada
Other healthcare facilities
Correctional facilities Latin America
Dairy farms and plants
ECOLAB STOCK PERFORMANCE SALES-AND-SERVICE ASSOCIATES
(December 31) 2003 2004 2005
2003 2004 2005
Quarter Low High Low High Low High Institutional* 3,1 90 3,055 3,1 55
Kay 275 325 350
First $23.08 $26.00 $26.1 2 $28.6 1 $31.20 $35.08
Pest Elimination 1,645 1,725 1,830
Second 24. 2 1 27.92 27.95 31 .77 30.68 34.23
Professional Products** 180 95 90
Third 23.78 26.80 29.04 31.80 30.75 34.1 4
Healthcare** - 70 80
Fourth 25.1 5 27.89 31.32 35.59 30.93 37. 1 5 GCS Service 535 470 470
Textile Care 80 75 75
Food & Beverage 405 450 425
ECOLAB STOCK PERFORMANCE COMPARISON Water Care Services 95 95 1 25
Vehicle Care 1 00 1 00 1 00
Europe/Africa/ME 3,285 3,9 1 5 4,1 50
• Ecolab Stock Price Index, Dec. 31, 2002 = 1.00
$38 1.60
Asia Pacific 1,01 5 960 995
• Ecolab Stock Price 31, 2002 = 1.00
ECOLAB, S&P 500 INDICES
$36
• S&P 500 Index, Dec. Canada 340 355 375
1.50
ECOLAB STOCK PRICE
Latin America 540 590 690
$34
Total 1 1,685 12,280 12,9 1 0
1.40
$32
*2004 decrease of 250 associates due to the sale of a
1.30 grease management product line.
$30 **2004 reflects the separation of Healthcare from
1.20 Professional Products.
$28
1. 10
$26
1.00
$24
$22 0.90
4Q 1Q 2Q 3Q 4Q 1Q 2Q 3Q 4Q 1Q 2Q 3Q 4Q
2002 2003 2004 2005