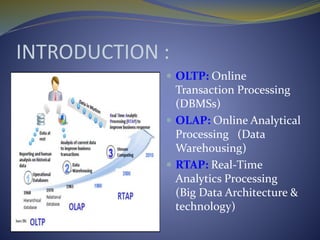
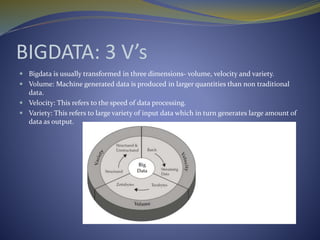
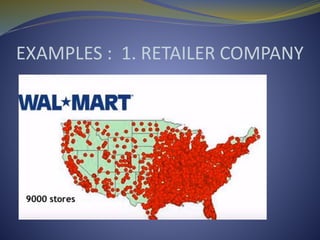
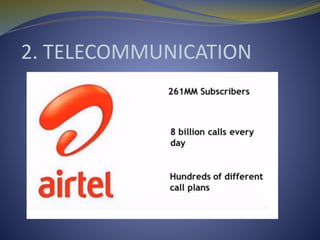
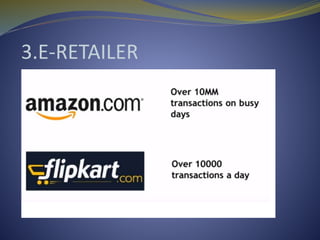
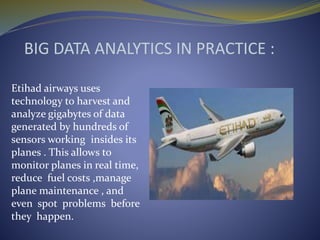
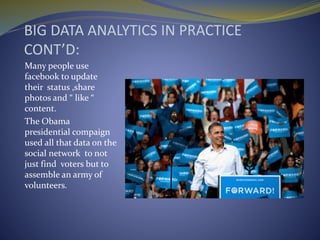
CONTENT:
 Introduction
 Why big data is required
 Big data
 Big data facts
 Big data 3 V’s
 Why big data is important
 Examples where big data is used
 Analytics
 Approach to analytic development
 Analysis of data through senser.
 Analytics can help in
 Big data analytics
 Big data analytics in practice
 How big data is used in twitter to get patterns
 Human resource cost and risk of big data.
 Big data analytics tools and technology
 Conclusions
 references
INTRODUCTION :
 OLTP: Online
Transaction Processing
(DBMSs)
 OLAP: Online Analytical
Processing (Data
Warehousing)
 RTAP: Real-Time
Analytics Processing
(Big Data Architecture &
technology)
WHY BIG DATA IS REQUIRED ?
 High availability of data.
 Increase in storage capabilities.
 Increase in processing power.
BIGDATA :
 Big data is a collection of data sets that are large
and complex in nature.
 They constitute both structured and unstructured
data that grow large so fast that they are not
manageable by traditional relational database
systems or conventional statistical tools.
BIG DATA FACTS:
 We create 2.5 quintillion bytes every day.
 90% of world’s data was created in the last 2 years
 80% of world’s data is unstructured.
 Facebook processes 500 TB per day and stores 30
petabytes of data.
 72 hrs of video are uploaded every minute.
 Twitter produces over 90 million tweets per day.
BIGDATA: 3 V’s
 Bigdata is usually transformed in three dimensions- volume, velocity and variety.
 Volume: Machine generated data is produced in larger quantities than non traditional
data.
 Velocity: This refers to the speed of data processing.
 Variety: This refers to large variety of input data which in turn generates large amount of
data as output.
EXAMPLES : 1. RETAILER COMPANY
2. TELECOMMUNICATION
3.E-RETAILER
WE CAN’T DEAL WITH SO MUCH
INFORMATION
WHAT IS ANALYTICS :
APPROACH TO ANALYTIC
DEVELOPMENT:
 Identify the data sources .
 Select the right tools and technology to collect ,store
and aggregate the data.
 Understanding the business domain.
 Build mathematical models for the analytics.
 Visualize.
 Validate your result.
 Learn ,adapt,and rebuild your analytic model.
ANALYSIS OF DATA THROUGH
SENSER:
 Senser data:
 A senser is a converter that measures a physical
quantity and transforms it into a digital signal .
 Sensers are always on , capturing data at a low
cost , and powering the “Internet of Things”
ANALYTICS CAN HELP IN :
WHAT IS BIG DATA ANALYTICS:
Big data analytics is a process of :
Collecting
Organizing and
Analyzing
of large sets of data (“ big data “) to
 discover patterns and
Other useful information
BIG DATA ANALYTICS IN PRACTICE :
Etihad airways uses
technology to harvest and
analyze gigabytes of data
generated by hundreds of
sensors working insides its
planes . This allows to
monitor planes in real time,
reduce fuel costs ,manage
plane maintenance , and
even spot problems before
they happen.
BIG DATA ANALYTICS IN PRACTICE
CONT’D:
Many people use
facebook to update
their status ,share
photos and “ like “
content.
The Obama
presidential compaign
used all that data on the
social network to not
just find voters but to
assemble an army of
volunteers.
BIG DATA ANALYTICS IN PRACTICE
CONT’D:
One of India’s highest -
rated TV shows
aggregates and analyzes
the millions of messages
it receives from viewers
on controversial issue
like female feticide ,
caste discrimination and
child abuse - and uses
that data to push for
political change.
Big data can detect bullying and
gain new social insights:
 The researchers have developed a machine learning
algorithm that’s identifying more than 15,000 tweets
per day relating to bullying .
 They developed their model by feeding it two sets of
tweets : one they had determined to be about bullying
activity and another that was not.
 Once the model learned the language identifiers of
tweets containing bullying, it started identifying a
huge amount of tweets from the Twitter firehouse
and it also discovered time patterns.
How Big data works :
Conclusion:
 The availability of big data ,low -cost commodity
hardware ,and new information management and
analytic software have produced a unique moment in
the history of data analysis.
 The convergence of these trends means that we have
the capabilities required to analyze astonishing data
sets quickly and cost – effectively for the first time in
history .
 These capabilities are neither theoretical nor trivial.
REFERENCES :
 https://www.youtube.com/watch?v=u5jWC89xBzI
 https://www.youtube.com/watch?v=jujE79yEu6Y
 http://labs.sogeti.com/big-data-can-detect-bullying-
and-gain-new-social-insights/
Bigdata

Bigdata

  • 2.
    CONTENT:  Introduction  Whybig data is required  Big data  Big data facts  Big data 3 V’s  Why big data is important  Examples where big data is used  Analytics  Approach to analytic development  Analysis of data through senser.  Analytics can help in  Big data analytics  Big data analytics in practice  How big data is used in twitter to get patterns  Human resource cost and risk of big data.  Big data analytics tools and technology  Conclusions  references
  • 3.
    INTRODUCTION :  OLTP:Online Transaction Processing (DBMSs)  OLAP: Online Analytical Processing (Data Warehousing)  RTAP: Real-Time Analytics Processing (Big Data Architecture & technology)
  • 4.
    WHY BIG DATAIS REQUIRED ?  High availability of data.  Increase in storage capabilities.  Increase in processing power.
  • 5.
    BIGDATA :  Bigdata is a collection of data sets that are large and complex in nature.  They constitute both structured and unstructured data that grow large so fast that they are not manageable by traditional relational database systems or conventional statistical tools.
  • 6.
    BIG DATA FACTS: We create 2.5 quintillion bytes every day.  90% of world’s data was created in the last 2 years  80% of world’s data is unstructured.  Facebook processes 500 TB per day and stores 30 petabytes of data.  72 hrs of video are uploaded every minute.  Twitter produces over 90 million tweets per day.
  • 7.
    BIGDATA: 3 V’s Bigdata is usually transformed in three dimensions- volume, velocity and variety.  Volume: Machine generated data is produced in larger quantities than non traditional data.  Velocity: This refers to the speed of data processing.  Variety: This refers to large variety of input data which in turn generates large amount of data as output.
  • 8.
    EXAMPLES : 1.RETAILER COMPANY
  • 11.
  • 12.
  • 13.
    WE CAN’T DEALWITH SO MUCH INFORMATION
  • 14.
  • 15.
    APPROACH TO ANALYTIC DEVELOPMENT: Identify the data sources .  Select the right tools and technology to collect ,store and aggregate the data.  Understanding the business domain.  Build mathematical models for the analytics.  Visualize.  Validate your result.  Learn ,adapt,and rebuild your analytic model.
  • 16.
    ANALYSIS OF DATATHROUGH SENSER:  Senser data:  A senser is a converter that measures a physical quantity and transforms it into a digital signal .  Sensers are always on , capturing data at a low cost , and powering the “Internet of Things”
  • 17.
  • 18.
    WHAT IS BIGDATA ANALYTICS: Big data analytics is a process of : Collecting Organizing and Analyzing of large sets of data (“ big data “) to  discover patterns and Other useful information
  • 19.
    BIG DATA ANALYTICSIN PRACTICE : Etihad airways uses technology to harvest and analyze gigabytes of data generated by hundreds of sensors working insides its planes . This allows to monitor planes in real time, reduce fuel costs ,manage plane maintenance , and even spot problems before they happen.
  • 20.
    BIG DATA ANALYTICSIN PRACTICE CONT’D: Many people use facebook to update their status ,share photos and “ like “ content. The Obama presidential compaign used all that data on the social network to not just find voters but to assemble an army of volunteers.
  • 21.
    BIG DATA ANALYTICSIN PRACTICE CONT’D: One of India’s highest - rated TV shows aggregates and analyzes the millions of messages it receives from viewers on controversial issue like female feticide , caste discrimination and child abuse - and uses that data to push for political change.
  • 22.
    Big data candetect bullying and gain new social insights:  The researchers have developed a machine learning algorithm that’s identifying more than 15,000 tweets per day relating to bullying .  They developed their model by feeding it two sets of tweets : one they had determined to be about bullying activity and another that was not.  Once the model learned the language identifiers of tweets containing bullying, it started identifying a huge amount of tweets from the Twitter firehouse and it also discovered time patterns.
  • 27.
    How Big dataworks :
  • 28.
    Conclusion:  The availabilityof big data ,low -cost commodity hardware ,and new information management and analytic software have produced a unique moment in the history of data analysis.  The convergence of these trends means that we have the capabilities required to analyze astonishing data sets quickly and cost – effectively for the first time in history .  These capabilities are neither theoretical nor trivial.
  • 29.
    REFERENCES :  https://www.youtube.com/watch?v=u5jWC89xBzI https://www.youtube.com/watch?v=jujE79yEu6Y  http://labs.sogeti.com/big-data-can-detect-bullying- and-gain-new-social-insights/