Downloaded 136 times


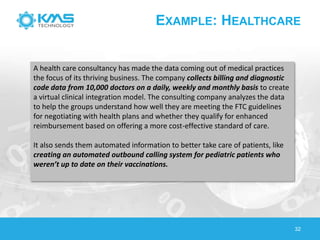


The document discusses big data, highlighting its definition, generation sources, and the limitations of traditional RDBMS systems in handling such data. It contrasts various data storage solutions, including NoSQL and NewSQL databases, emphasizing their characteristics, implementations, and performance comparisons. Additionally, it presents case studies from healthcare, retail, and utilities to illustrate how organizations leverage big data for improved operations and decision-making.


![[Webinar] Test First, Fail Fast - Simplifying the Tester's Transition to DevOps](https://cdn.slidesharecdn.com/ss_thumbnails/testfirstfailfastfinal-170323164615-thumbnail.jpg?width=640&height=640&fit=bounds)


