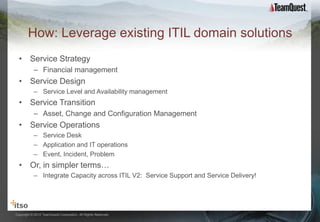
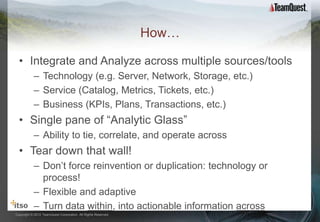
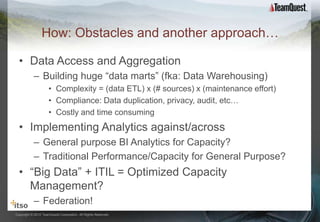
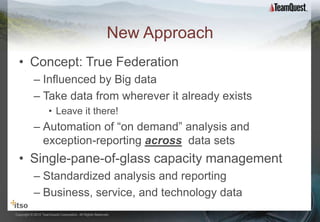
Marrying Service Management
                 with Service Delivery
                                                      “Big Data” Approaches
                                                                David Wagner
                                                             TeamQuest Advocate


TeamQuest and the TeamQuest logo are registered trademarks in the US, EU and elsewhere.
All other trademarks and service marks are the property of their respective owners.
Copyright © 2012 TeamQuest Corporation. All Rights Reserved.
Agenda
  • The TeamQuest Why?
  • Big Data: conceptual overview
  • 2013 Capacity Management 101:
           – Goals
           – History
           – Obstacles
  • TeamQuest Approach (flavored by “big data”)
           – Concepts
           – Values
Copyright © 2012 TeamQuest Corporation. All Rights Reserved.
Why does TeamQuest Exist?

  • At TeamQuest, we believe that having and using the
    right amount of resources at all times is a societal
    imperative.
           – Anything less is failure
           – Anything more is wasteful
  • 20+ years sole focus
           – ensuring our customers can continuously and
             automatically perform at their utmost level of efficiency
           – ensuring business service performance, conserving scarce
             resources, saving money and improving productivity

Copyright © 2012 TeamQuest Corporation. All Rights Reserved.
What this Presentation is… and is not!

  • IS:
           – IT Optimization
           – Marrying non-traditional disciplines to Capacity
             Management
           – Applying Big data approaches to Capacity Management
                     • Faster and larger value
                     • More scalable
           – New ways to think about optimization
                     • Not just technology anymore
  • Is NOT!
           – A Primer on “Big Data”
           – Hadoop ecosystem deep dive, etc…
Copyright © 2012 TeamQuest Corporation. All Rights Reserved.
Big Data at 50,000 feet…

  • Big Data is about data  actionable information
           – Plethora of existing sources
                     • Technology
                     • Business
                     • Service
           – Learning new insights from “old” data
           – Key is Analytics
                     • Deep
                     • Across
  • But… Capacity Management?

Copyright © 2012 TeamQuest Corporation. All Rights Reserved.
Technology Approaches

  • Data Access and Aggregation
           – Build huge “data marts” (aka: Data Warehousing)
           – Integrate with multiple different data sources
                     • Technology (e.g. Server, Network, Storage, etc.)
                     • Service (Catalog, Metrics, Tickets, etc.)
                     • Business (KPIs, Plans, Transactions, etc.)
  • Implement Analytics against/across
           – Flexible and adaptive
           – Turn data within, into actionable information across
  • But… Capacity Management???

Copyright © 2012 TeamQuest Corporation. All Rights Reserved.
2013 Capacity Management 101 - History

  • Answering “what if” questions…
           – Change in technology, demand, etc… impact?
           – Focus on Optimizing Server Cost versus Performance
  • Extremely Technology-centric
           – Servers, Mainframes
           – Occasionally Storage or Network – in isolation
  • Big Value and Return, but also effort
           – Highly trained staff
           – Requires building a central, long term repository (CMIS)
           – Scalability of Staff, Tools, …, Politics!
Copyright © 2012 TeamQuest Corporation. All Rights Reserved.
New Considerations

  • Maintain traditional value, and add
           – Optimize more resources
           – Amplify
           – Accelerate
  • Increase Business relevance
           – Valuable predictive analytics in business and service
             context
           – Optimize Efficiency
  • Virtualization and Cloud Scale to everything
           – Many to many inter-relationships; Capacity critical

Copyright © 2012 TeamQuest Corporation. All Rights Reserved.
How: Leverage existing ITIL domain solutions
  • Service Strategy
           – Financial management
  • Service Design
           – Service Level and Availability management
  • Service Transition
           – Asset, Change and Configuration Management
  • Service Operations
           – Service Desk
           – Application and IT operations
           – Event, Incident, Problem
  • Or, in simpler terms…
           – Integrate Capacity across ITIL V2: Service Support and Service Delivery!


Copyright © 2012 TeamQuest Corporation. All Rights Reserved.
How…

  • Integrate and Analyze across multiple sources/tools
           – Technology (e.g. Server, Network, Storage, etc.)
           – Service (Catalog, Metrics, Tickets, etc.)
           – Business (KPIs, Plans, Transactions, etc.)
  • Single pane of “Analytic Glass”
           – Ability to tie, correlate, and operate across
  • Tear down that wall!
           – Don’t force reinvention or duplication: technology or
             process!
           – Flexible and adaptive
           – Turn data within, into actionable information across
Copyright © 2012 TeamQuest Corporation. All Rights Reserved.
How: Obstacles and another approach…

  • Data Access and Aggregation
           – Building huge “data marts” (fka: Data Warehousing)
                     • Complexity = (data ETL) x (# sources) x (maintenance effort)
                     • Compliance: Data duplication, privacy, audit, etc…
                     • Costly and time consuming
  • Implementing Analytics against/across
           – General purpose BI Analytics for Capacity?
           – Traditional Performance/Capacity for General Purpose?
  • “Big Data” + ITIL = Optimized Capacity
    Management?
           – Federation!
Copyright © 2012 TeamQuest Corporation. All Rights Reserved.
New Approach
  • Concept: True Federation
           – Influenced by Big data
           – Take data from wherever it already exists
                     • Leave it there!
           – Automation of “on demand” analysis and
             exception-reporting across data sets
  • Single-pane-of-glass capacity management
           – Standardized analysis and reporting
           – Business, service, and technology data
Copyright © 2012 TeamQuest Corporation. All Rights Reserved.
Some Examples
  •      Response time versus performance
  •      Business, Service, Asset and Power
  •      Tickets and performance/capacity
  •      Spanning pure technology silo challenges


Copyright © 2012 TeamQuest Corporation. All Rights Reserved.
Correlate Utilization with Response Time


          Response Time                                                     Correlated with Utilization
  (from HP BSM, fka: Mercury BAC)                                               (from BMC BCO)


                                                               Value
                                                                       14


Copyright © 2012 TeamQuest Corporation. All Rights Reserved.
Asset Financials


  • Standalone, Financials are interesting
           – Sourced Hyperion
  • mapped to performance and capacity…
           – Response time
           – Business Transactions
                                                                        15
           – Power consumption
Copyright © 2012 TeamQuest Corporation. All Rights Reserved.
Business, Service, Asset and Power together!


                                                               16


Copyright © 2012 TeamQuest Corporation. All Rights Reserved.
Service Desk and Capacity


Copyright © 2012 TeamQuest Corporation. All Rights Reserved.   17
Virtual Machines to and from
                                  Storage…


Copyright © 2012 TeamQuest Corporation. All Rights Reserved.   18
TPI is the best KPI


        Application A                                                      Here’s the
       spans multiple                                                  system-level TPIs
         VMs… one                                                         for systems
      queuing badly…                                                        hosting
                                                                        Application a (1
                                                                         host, 3 VMs)


                                              Auto-generate linkable
                                             dashboard – Application
                                               Workload vs. System
                                               duringworst queuing

Copyright © 2012 TeamQuest Corporation. All Rights Reserved.
TPI is the best KPI

Linked to details
 on the queuing
workload… here:                                                 With a total
                                                                                 And breakdown, IO or
Total VM0 picture                                                queuing
                                                                               CPU? There’s IO queuing
                                                               breakdown…
                                                                               at “peak bad” timeframe!


Copyright © 2012 TeamQuest Corporation. All Rights Reserved.
TPI is the best KPI
                              Auto-generate                        No corresponding
                               analysis of                         throughput spike!
                             System Devices                          Time to look at
                            and their queuing                        Storage/Array
                                                                        side…
 Follow the device
   in question…


Copyright © 2012 TeamQuest Corporation. All Rights Reserved.
If or when there is
                                       storage-centric RT data –   Back end response time
                                       analyze it! 10 mSec isn’t     is pretty normal…
                                                 good…
Copyright © 2012 TeamQuest Corporation. All Rights Reserved.
TPI is the best KPI
                                                                       Auto-generate
                                                                       Volume related
                                                                          analysis


   Nothing stands out… if analyst
 wants different views they can be
launched: in time, device, volume,
  system, file-system and system,
 application and workload context!


Copyright © 2012 TeamQuest Corporation. All Rights Reserved.
TPI is the best KPI
                                                                        Same thing with
                                                                       Link (or any other)
                                                                            Analysis


Copyright © 2012 TeamQuest Corporation. All Rights Reserved.
TPI is the best KPI
                                                                         Back-end analysis
                                                                                of
                                                                         Controller/drives


                                                                       Always in context
                                                                       of our Application
                                                                       on that system, at
                                                                            that time


Copyright © 2012 TeamQuest Corporation. All Rights Reserved.
Combined Views: Mapping VM – IO
                    Contention


                                             Storage-sourced   Server / Application-
                                                               sourced


Copyright © 2012 TeamQuest Corporation. All Rights Reserved.
Additional Considerations
  • Federation maps virtually all sources… but not all
           – Low effort
           – Rapid to value
  • Analytics must work
           – One/more sources
           – Modularly, combinatorially
  • You will want rule-based automation
           – Flexible, easy to modify
           – Only way to “human scale”
  • Pick “low hanging fruit” for first project(s)
           – Build from your wins


Copyright © 2012 TeamQuest Corporation. All Rights Reserved.
Department of Shameless Commerce
  • Consider Attending today’s afternoon session:
           – “Optimizing IT Costs and Services with Big Data
             (Little Effort!) – Case Studies
           – 4:35 – 5:35: Track 12, Session 1012, DaVinci 3
  • Expands on these concepts and presents
    comprehensive case study


Copyright © 2012 TeamQuest Corporation. All Rights Reserved.
TeamQuest delivers value
  • 25% reduction in IT budget in 3 years
         (a large insurance company)
  • 94% reduction in app slowdowns in 4 months
         (a large healthcare organization)
  • $5M saved by avoiding new hardware
    purchases
         (a large insurance company)
  • $3 million saved by delaying IT procurement
         (a large UK financial services company)

Copyright © 2012 TeamQuest Corporation. All Rights Reserved.

Big Data - Marrying Service Management With Service Delivery - #Pink13

  • 1.
    Marrying Service Management with Service Delivery “Big Data” Approaches David Wagner TeamQuest Advocate TeamQuest and the TeamQuest logo are registered trademarks in the US, EU and elsewhere. All other trademarks and service marks are the property of their respective owners. Copyright © 2012 TeamQuest Corporation. All Rights Reserved.
  • 2.
    Agenda •The TeamQuest Why? • Big Data: conceptual overview • 2013 Capacity Management 101: – Goals – History – Obstacles • TeamQuest Approach (flavored by “big data”) – Concepts – Values Copyright © 2012 TeamQuest Corporation. All Rights Reserved.
  • 3.
    Why does TeamQuestExist? • At TeamQuest, we believe that having and using the right amount of resources at all times is a societal imperative. – Anything less is failure – Anything more is wasteful • 20+ years sole focus – ensuring our customers can continuously and automatically perform at their utmost level of efficiency – ensuring business service performance, conserving scarce resources, saving money and improving productivity Copyright © 2012 TeamQuest Corporation. All Rights Reserved.
  • 4.
    What this Presentationis… and is not! • IS: – IT Optimization – Marrying non-traditional disciplines to Capacity Management – Applying Big data approaches to Capacity Management • Faster and larger value • More scalable – New ways to think about optimization • Not just technology anymore • Is NOT! – A Primer on “Big Data” – Hadoop ecosystem deep dive, etc… Copyright © 2012 TeamQuest Corporation. All Rights Reserved.
  • 5.
    Big Data at50,000 feet… • Big Data is about data  actionable information – Plethora of existing sources • Technology • Business • Service – Learning new insights from “old” data – Key is Analytics • Deep • Across • But… Capacity Management? Copyright © 2012 TeamQuest Corporation. All Rights Reserved.
  • 6.
    Technology Approaches • Data Access and Aggregation – Build huge “data marts” (aka: Data Warehousing) – Integrate with multiple different data sources • Technology (e.g. Server, Network, Storage, etc.) • Service (Catalog, Metrics, Tickets, etc.) • Business (KPIs, Plans, Transactions, etc.) • Implement Analytics against/across – Flexible and adaptive – Turn data within, into actionable information across • But… Capacity Management??? Copyright © 2012 TeamQuest Corporation. All Rights Reserved.
  • 7.
    2013 Capacity Management101 - History • Answering “what if” questions… – Change in technology, demand, etc… impact? – Focus on Optimizing Server Cost versus Performance • Extremely Technology-centric – Servers, Mainframes – Occasionally Storage or Network – in isolation • Big Value and Return, but also effort – Highly trained staff – Requires building a central, long term repository (CMIS) – Scalability of Staff, Tools, …, Politics! Copyright © 2012 TeamQuest Corporation. All Rights Reserved.
  • 8.
    New Considerations • Maintain traditional value, and add – Optimize more resources – Amplify – Accelerate • Increase Business relevance – Valuable predictive analytics in business and service context – Optimize Efficiency • Virtualization and Cloud Scale to everything – Many to many inter-relationships; Capacity critical Copyright © 2012 TeamQuest Corporation. All Rights Reserved.
  • 9.
    How: Leverage existingITIL domain solutions • Service Strategy – Financial management • Service Design – Service Level and Availability management • Service Transition – Asset, Change and Configuration Management • Service Operations – Service Desk – Application and IT operations – Event, Incident, Problem • Or, in simpler terms… – Integrate Capacity across ITIL V2: Service Support and Service Delivery! Copyright © 2012 TeamQuest Corporation. All Rights Reserved.
  • 10.
    How… •Integrate and Analyze across multiple sources/tools – Technology (e.g. Server, Network, Storage, etc.) – Service (Catalog, Metrics, Tickets, etc.) – Business (KPIs, Plans, Transactions, etc.) • Single pane of “Analytic Glass” – Ability to tie, correlate, and operate across • Tear down that wall! – Don’t force reinvention or duplication: technology or process! – Flexible and adaptive – Turn data within, into actionable information across Copyright © 2012 TeamQuest Corporation. All Rights Reserved.
  • 11.
    How: Obstacles andanother approach… • Data Access and Aggregation – Building huge “data marts” (fka: Data Warehousing) • Complexity = (data ETL) x (# sources) x (maintenance effort) • Compliance: Data duplication, privacy, audit, etc… • Costly and time consuming • Implementing Analytics against/across – General purpose BI Analytics for Capacity? – Traditional Performance/Capacity for General Purpose? • “Big Data” + ITIL = Optimized Capacity Management? – Federation! Copyright © 2012 TeamQuest Corporation. All Rights Reserved.
  • 12.
    New Approach • Concept: True Federation – Influenced by Big data – Take data from wherever it already exists • Leave it there! – Automation of “on demand” analysis and exception-reporting across data sets • Single-pane-of-glass capacity management – Standardized analysis and reporting – Business, service, and technology data Copyright © 2012 TeamQuest Corporation. All Rights Reserved.
  • 13.
    Some Examples • Response time versus performance • Business, Service, Asset and Power • Tickets and performance/capacity • Spanning pure technology silo challenges Copyright © 2012 TeamQuest Corporation. All Rights Reserved.
  • 14.
    Correlate Utilization withResponse Time Response Time Correlated with Utilization (from HP BSM, fka: Mercury BAC) (from BMC BCO) Value 14 Copyright © 2012 TeamQuest Corporation. All Rights Reserved.
  • 15.
    Asset Financials • Standalone, Financials are interesting – Sourced Hyperion • mapped to performance and capacity… – Response time – Business Transactions 15 – Power consumption Copyright © 2012 TeamQuest Corporation. All Rights Reserved.
  • 16.
    Business, Service, Assetand Power together! 16 Copyright © 2012 TeamQuest Corporation. All Rights Reserved.
  • 17.
    Service Desk andCapacity Copyright © 2012 TeamQuest Corporation. All Rights Reserved. 17
  • 18.
    Virtual Machines toand from Storage… Copyright © 2012 TeamQuest Corporation. All Rights Reserved. 18
  • 19.
    TPI is thebest KPI Application A Here’s the spans multiple system-level TPIs VMs… one for systems queuing badly… hosting Application a (1 host, 3 VMs) Auto-generate linkable dashboard – Application Workload vs. System duringworst queuing Copyright © 2012 TeamQuest Corporation. All Rights Reserved.
  • 20.
    TPI is thebest KPI Linked to details on the queuing workload… here: With a total And breakdown, IO or Total VM0 picture queuing CPU? There’s IO queuing breakdown… at “peak bad” timeframe! Copyright © 2012 TeamQuest Corporation. All Rights Reserved.
  • 21.
    TPI is thebest KPI Auto-generate No corresponding analysis of throughput spike! System Devices Time to look at and their queuing Storage/Array side… Follow the device in question… Copyright © 2012 TeamQuest Corporation. All Rights Reserved.
  • 22.
    If or whenthere is storage-centric RT data – Back end response time analyze it! 10 mSec isn’t is pretty normal… good… Copyright © 2012 TeamQuest Corporation. All Rights Reserved.
  • 23.
    TPI is thebest KPI Auto-generate Volume related analysis Nothing stands out… if analyst wants different views they can be launched: in time, device, volume, system, file-system and system, application and workload context! Copyright © 2012 TeamQuest Corporation. All Rights Reserved.
  • 24.
    TPI is thebest KPI Same thing with Link (or any other) Analysis Copyright © 2012 TeamQuest Corporation. All Rights Reserved.
  • 25.
    TPI is thebest KPI Back-end analysis of Controller/drives Always in context of our Application on that system, at that time Copyright © 2012 TeamQuest Corporation. All Rights Reserved.
  • 26.
    Combined Views: MappingVM – IO Contention Storage-sourced Server / Application- sourced Copyright © 2012 TeamQuest Corporation. All Rights Reserved.
  • 27.
    Additional Considerations • Federation maps virtually all sources… but not all – Low effort – Rapid to value • Analytics must work – One/more sources – Modularly, combinatorially • You will want rule-based automation – Flexible, easy to modify – Only way to “human scale” • Pick “low hanging fruit” for first project(s) – Build from your wins Copyright © 2012 TeamQuest Corporation. All Rights Reserved.
  • 28.
    Department of ShamelessCommerce • Consider Attending today’s afternoon session: – “Optimizing IT Costs and Services with Big Data (Little Effort!) – Case Studies – 4:35 – 5:35: Track 12, Session 1012, DaVinci 3 • Expands on these concepts and presents comprehensive case study Copyright © 2012 TeamQuest Corporation. All Rights Reserved.
  • 29.
    TeamQuest delivers value • 25% reduction in IT budget in 3 years (a large insurance company) • 94% reduction in app slowdowns in 4 months (a large healthcare organization) • $5M saved by avoiding new hardware purchases (a large insurance company) • $3 million saved by delaying IT procurement (a large UK financial services company) Copyright © 2012 TeamQuest Corporation. All Rights Reserved.

Editor's Notes

  • #18 Our Monthly Health Check report easily contains Asset information alongside our risk registry items. This particular server’s history contains three previous capacity issues for CPU, Memory, and file system space. Our homegrown risk registry is used to track these items from identification through remediation. We track the date opened, why it was opened, our notes, and the closure reason. Notice that two of the issues were closed based on feedback from the Application Owner. While the memory issue was resolved by tuning Oracle’s SGA. This history is invaluable for our analysis as well as providing historical context for the application owner. We have too many applications and servers to track this by hand. We had to have a tracking tool, and it had to be integrated into our reporting tool. This was easily done with Performance Surveyor.