Download as PDF, PPTX


![Customizing Graphs:Standard Options
Inline:
Custom HTML
<%= line_chart data, id: "users-chart", height: "500px" %>
Axis endpoints
<%= line_chart data, min: 1000, max: 5000 %>
Chart colors
<%= line_chart data, colors: ["pink", "#999"] %>
Or in config/initializers/chartkick.rb:
Chartkick.options = { colors: ["#D21724", "gray", "black", "#B27070", "#550000"]}](https://image.slidesharecdn.com/chartkickcopy-150511190912-lva1-app6892/85/Dynamic-Data-Visualization-With-Chartkick-12-320.jpg)


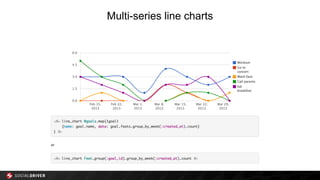


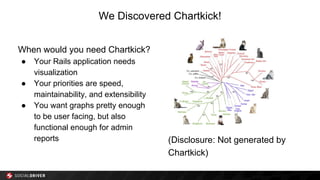
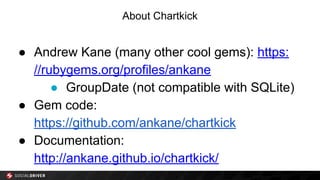
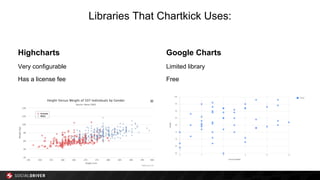
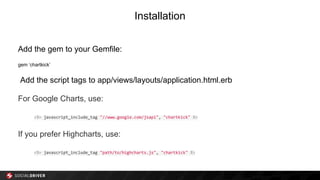
The document discusses the use of Chartkick, a gem for Ruby on Rails that simplifies data visualization through easy graph creation with minimal code. It covers installation instructions, customization options, and integration with libraries like Highcharts and Google Charts, making it suitable for user-facing applications and admin reports. Additionally, it highlights that Chartkick is also available for use with JavaScript and Python, providing flexibility for developers.