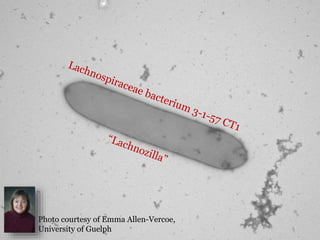
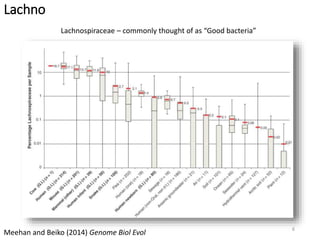
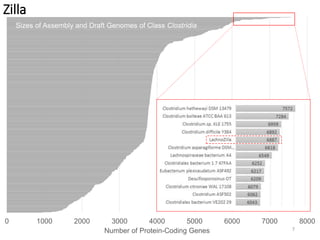
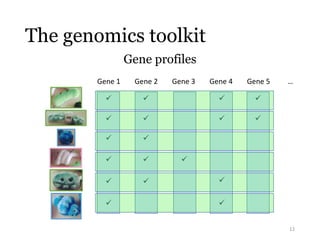
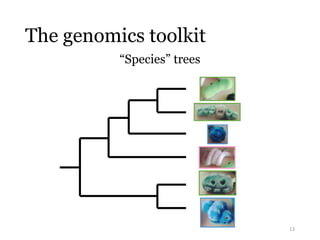
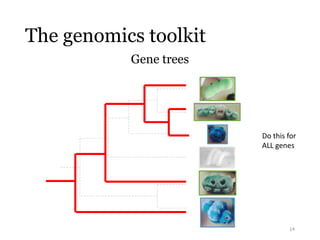
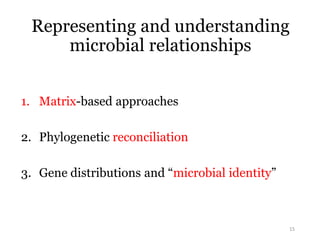
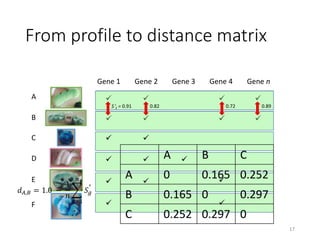
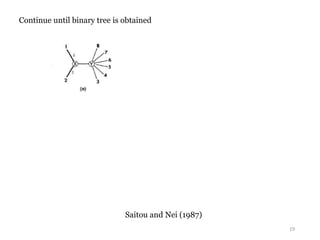
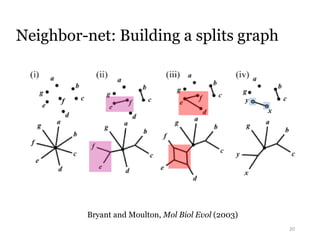
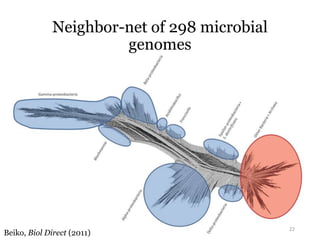
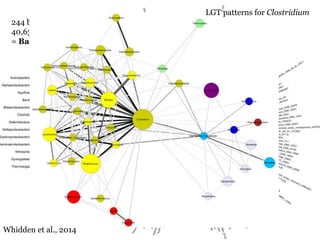
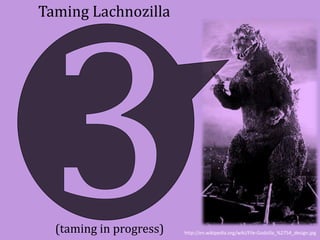
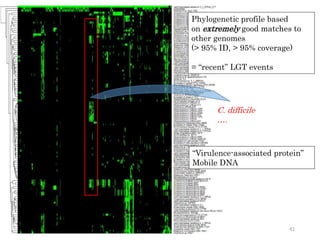
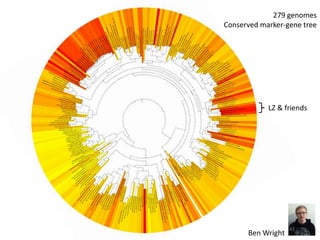
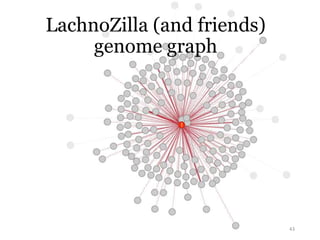
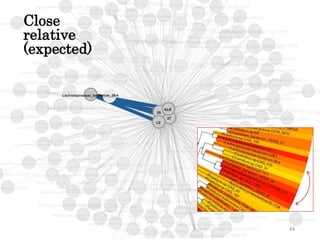
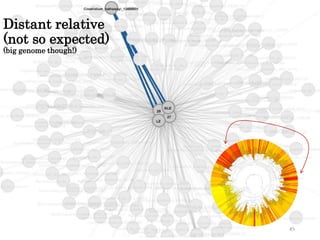
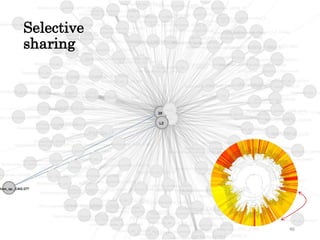
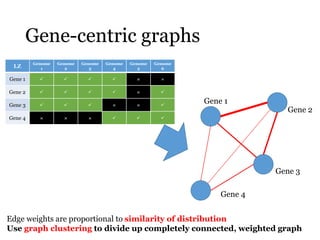
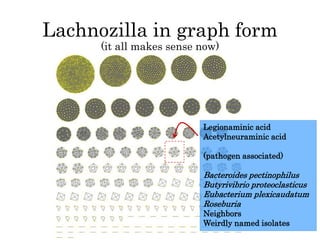
When trees can’t agree 
Robert Beiko
- The human microbiome - 
an ecosystem unlike any other 
2
Human gut microbiome: 2-3 million genes 
Typically > 160 “species” at any given time 
Qin et al., Nature (2010)
Microbial communities 
http://upload.wikimedia.org/wikipedia/commons/2/2d/Bacteria_%28251_31%29_Airborne_microbes.jpg 
4
5 
Photo courtesy of Emma Allen-Vercoe, 
University of Guelph
Lachno 
Lachnospiraceae – commonly thought of as “Good bacteria” 
Meehan and Beiko (2014) Genome Biol Evol 
6
Sizes of Assembly and Draft Genomes of Class Clostridia 
0 1000 2000 3000 4000 5000 6000 7000 8000 
Number of Protein-Coding Genes 
Zilla 
7
50 
33 
? 
4 
9
W. Ford Doolittle, Sci Am (1999) 10
PNAS, 2012 
Gene transfer matters 
“…pathogen-driven inflammatory responses in the gut can generate transient enterobacterial 
blooms in which conjugative transfer occurs at unprecedented rates.” 
PLoS Biol, 2007 
“…lateral gene transfer, mobile elements, and gene amplification have played important roles in 
affecting the ability of gut-dwelling Bacteroidetes to vary their cell surface, sense their 
environment, and harvest nutrient resources present in the distal intestine.” 
11
The genomics toolkit 
Gene profiles 
12 
Gene 1 Gene 2 Gene 3 Gene 4 Gene 5 
 
 
 
 
 
 
 
 
 
 
 
 
 
 
 
 
 
 
…
The genomics toolkit 
“Species” trees 
13
The genomics toolkit 
Gene trees 
Do this for 
ALL genes 
14
Representing and understanding 
microbial relationships 
1. Matrix-based approaches 
2. Phylogenetic reconciliation 
3. Gene distributions and “microbial identity” 
15
The tyranny 
of distance
From profile to distance matrix 
 
 
 
 
 
 
 
 
17 
Gene 1 Gene 2 Gene 3 Gene 4 Gene n 
A 
B 
 
 
 
 
 
 
  
 
 
C 
D 
E 
F 
S1 = 0.91 0.82 0.72 0.89 
푑퐴,퐵 = 1.0 − 
1 
푛 
푛 
푔=1 
푆푔 A B C 
A 0 0.165 0.252 
B 0.165 0 0.297 
C 0.252 0.297 0
Neighbor-joining 
18 
Start with a ‘star’ tree 
At each iteration, split off the pair of taxa that minimizes the total sum 
of branch lengths in the tree 
Choose groups x and y to minimize the Q-criterion: 
Distance matrix entry for (x,y) 
x 
y 
Weighted distance to all leaves
19 
Continue until binary tree is obtained 
Saitou and Nei (1987)
20 
Neighbor-net: Building a splits graph 
Bryant and Moulton, Mol Biol Evol (2003)
21 
Neighbor-net is guaranteed to produce a circular set 
of splits 
This will produce a planar graph
Neighbor-net of 298 microbial 
genomes 
Beiko, Biol Direct (2011) 22
Limitations of neighbor-net 
• Neighbor-net still imposes a constraint on the 
relationships among genomes: “long-distance” 
connections cannot be shown 
23 
?
Explicit connections between 
genomes 
• Make each genome a vertex in a graph G 
V = {A,B,C,D,E,F,…} 
E = {{A,B},…} 
For some threshold t: 
{A,B} ϵ G iff dA,B ≤ t 
or if some other condition is satisfied 
24 
A B 
wA,B
Linear programming 
•Weighting networks based on straight 
genome-genome similarity highlights 
close relatives, redundancy 
• LP introduces weighting scheme that 
constrains connections and promotes 
distinct relationships 
25
P. aeruginosa 
P. fluorescens 
P. lePewtida 
P. syringae 
P. entomophila 
P. stutzeri 
P. mendocina 
“Plume” 
Holloway and Beiko, BMC Evol Biol (2010) 
26
27 
Some like it hot 
Pyrococcus furiosus 
optimal growth temperature: 
100°C
Networks 
Kunin et al. (2005) Genome Res 28
Networks!!!! 
Dagan et al. (2008) PNAS 29
Inferring and 
comparing trees
Phylogenetic tree reconciliation 
31 
Species tree S Lateral gene transfer Gene tree G 
Subtree prune and regraft 
Whidden et al., Syst Biol (2014)
32 
For two rooted trees, dSPR is equal to the 
number of components in a MAF, minus 1 
So building a MAF is equivalent to inferring the minimum 
number of SPR events needed to reconcile a species tree 
with a gene tree 
Problem is NP-hard 
dSPR = 1 
MAF components = 2 
Bordewich and Semple, Ann Combinatorics (2005)
33 
T1 T2 
Case 1 
(separate components) 
Case 3 
(several pendant nodes) 
Case 2 
(one pendant node) 
Chris’s algorithm
Fixed-parameter tractability 
• Problem is dominated by Case 3 (3 alternatives) 
• Cut all candidate edges at each step = linear 3-approximation 
• Decision problem: 푂 2.42푘푛 to decide if SPR distance ≤ k 
• Problem is exponential in SPR distance, NOT number of leaves 
therefore FPT 
Chris Whidden + Norbert Zeh 34
In practice 
35
SPR Supertrees 
Supertree: a tree that satisfies some optimality 
criterion with respect to a set of input trees 
SPR supertree: given a set of gene trees, find a tree 
that minimizes the total number of SPR operations vs. all 
gene trees 
Building an SPR supertree: assemble an initial tree, 
then propose SPR operations and evaluate its total SPR 
distance from input trees 
Whidden et al., 2014 36
Why SPR supertrees? 
1. Explicit representation of LGT events 
2. Branches broken in MAF → implied 
LGT events. Can build graph of 
connections 
37
244 bacterial genomes 
40,631 gene trees 
= Bacterial SPR supertree 
LGT patterns for Clostridium 
Whidden et al., 2014
Taming Lachnozilla 
(taming in progress) http://en.wikipedia.org/wiki/File:Godzilla_%2754_design.jpg
What makes 
LachnoZilla 
LachnoZilla ?
Phylogenetic profile based 
on extremely good matches to 
other genomes 
(> 95% ID, > 95% coverage) 
= “recent” LGT events 
C. difficile 
…. 
“Virulence-associated protein” 
Mobile DNA 
41
279 genomes 
Conserved marker-gene tree 
LZ & friends 
Ben Wright 
42
LachnoZilla (and friends) 
genome graph 
! 
43
Close 
relative 
(expected) 
44
Distant relative 
(not so expected) 
(big genome though!) 
45
Selective 
sharing 
46
Gene-centric graphs 
LZ Genome 
1 
Genome 
2 
Genome 
3 
Genome 
4 
Genome 
5 
Genome 
6 
Gene 1     × × 
Gene 2     ×  
Gene 3    × ×  
Gene 4 × × ×    
Gene 2 
Gene 3 
Gene 1 
Gene 4 
Edge weights are proportional to similarity of distribution 
Use graph clustering to divide up completely connected, weighted graph
Lachnozilla in graph form 
(it all makes sense now) 
Legionaminic acid 
Acetylneuraminic acid 
(pathogen associated) 
Bacteroides pectinophilus 
Butyrivibrio proteoclasticus 
Eubacterium plexicaudatum 
Roseburia 
Neighbors 
Weirdly named isolates
Mystery isolate #1 
(made-up example)
Mystery isolate #2 
(made-up example)
Representations 
Clear inference 
From pattern to understanding 
uestions
FIN 
52

Beiko cms final

  • 1.
    When trees can’tagree Robert Beiko
  • 2.
    - The humanmicrobiome - an ecosystem unlike any other 2
  • 3.
    Human gut microbiome:2-3 million genes Typically > 160 “species” at any given time Qin et al., Nature (2010)
  • 4.
  • 5.
    5 Photo courtesyof Emma Allen-Vercoe, University of Guelph
  • 6.
    Lachno Lachnospiraceae –commonly thought of as “Good bacteria” Meehan and Beiko (2014) Genome Biol Evol 6
  • 7.
    Sizes of Assemblyand Draft Genomes of Class Clostridia 0 1000 2000 3000 4000 5000 6000 7000 8000 Number of Protein-Coding Genes Zilla 7
  • 9.
    50 33 ? 4 9
  • 10.
    W. Ford Doolittle,Sci Am (1999) 10
  • 11.
    PNAS, 2012 Genetransfer matters “…pathogen-driven inflammatory responses in the gut can generate transient enterobacterial blooms in which conjugative transfer occurs at unprecedented rates.” PLoS Biol, 2007 “…lateral gene transfer, mobile elements, and gene amplification have played important roles in affecting the ability of gut-dwelling Bacteroidetes to vary their cell surface, sense their environment, and harvest nutrient resources present in the distal intestine.” 11
  • 12.
    The genomics toolkit Gene profiles 12 Gene 1 Gene 2 Gene 3 Gene 4 Gene 5                   …
  • 13.
    The genomics toolkit “Species” trees 13
  • 14.
    The genomics toolkit Gene trees Do this for ALL genes 14
  • 15.
    Representing and understanding microbial relationships 1. Matrix-based approaches 2. Phylogenetic reconciliation 3. Gene distributions and “microbial identity” 15
  • 16.
  • 17.
    From profile todistance matrix         17 Gene 1 Gene 2 Gene 3 Gene 4 Gene n A B           C D E F S1 = 0.91 0.82 0.72 0.89 푑퐴,퐵 = 1.0 − 1 푛 푛 푔=1 푆푔 A B C A 0 0.165 0.252 B 0.165 0 0.297 C 0.252 0.297 0
  • 18.
    Neighbor-joining 18 Startwith a ‘star’ tree At each iteration, split off the pair of taxa that minimizes the total sum of branch lengths in the tree Choose groups x and y to minimize the Q-criterion: Distance matrix entry for (x,y) x y Weighted distance to all leaves
  • 19.
    19 Continue untilbinary tree is obtained Saitou and Nei (1987)
  • 20.
    20 Neighbor-net: Buildinga splits graph Bryant and Moulton, Mol Biol Evol (2003)
  • 21.
    21 Neighbor-net isguaranteed to produce a circular set of splits This will produce a planar graph
  • 22.
    Neighbor-net of 298microbial genomes Beiko, Biol Direct (2011) 22
  • 23.
    Limitations of neighbor-net • Neighbor-net still imposes a constraint on the relationships among genomes: “long-distance” connections cannot be shown 23 ?
  • 24.
    Explicit connections between genomes • Make each genome a vertex in a graph G V = {A,B,C,D,E,F,…} E = {{A,B},…} For some threshold t: {A,B} ϵ G iff dA,B ≤ t or if some other condition is satisfied 24 A B wA,B
  • 25.
    Linear programming •Weightingnetworks based on straight genome-genome similarity highlights close relatives, redundancy • LP introduces weighting scheme that constrains connections and promotes distinct relationships 25
  • 26.
    P. aeruginosa P.fluorescens P. lePewtida P. syringae P. entomophila P. stutzeri P. mendocina “Plume” Holloway and Beiko, BMC Evol Biol (2010) 26
  • 27.
    27 Some likeit hot Pyrococcus furiosus optimal growth temperature: 100°C
  • 28.
    Networks Kunin etal. (2005) Genome Res 28
  • 29.
    Networks!!!! Dagan etal. (2008) PNAS 29
  • 30.
  • 31.
    Phylogenetic tree reconciliation 31 Species tree S Lateral gene transfer Gene tree G Subtree prune and regraft Whidden et al., Syst Biol (2014)
  • 32.
    32 For tworooted trees, dSPR is equal to the number of components in a MAF, minus 1 So building a MAF is equivalent to inferring the minimum number of SPR events needed to reconcile a species tree with a gene tree Problem is NP-hard dSPR = 1 MAF components = 2 Bordewich and Semple, Ann Combinatorics (2005)
  • 33.
    33 T1 T2 Case 1 (separate components) Case 3 (several pendant nodes) Case 2 (one pendant node) Chris’s algorithm
  • 34.
    Fixed-parameter tractability •Problem is dominated by Case 3 (3 alternatives) • Cut all candidate edges at each step = linear 3-approximation • Decision problem: 푂 2.42푘푛 to decide if SPR distance ≤ k • Problem is exponential in SPR distance, NOT number of leaves therefore FPT Chris Whidden + Norbert Zeh 34
  • 35.
  • 36.
    SPR Supertrees Supertree:a tree that satisfies some optimality criterion with respect to a set of input trees SPR supertree: given a set of gene trees, find a tree that minimizes the total number of SPR operations vs. all gene trees Building an SPR supertree: assemble an initial tree, then propose SPR operations and evaluate its total SPR distance from input trees Whidden et al., 2014 36
  • 37.
    Why SPR supertrees? 1. Explicit representation of LGT events 2. Branches broken in MAF → implied LGT events. Can build graph of connections 37
  • 38.
    244 bacterial genomes 40,631 gene trees = Bacterial SPR supertree LGT patterns for Clostridium Whidden et al., 2014
  • 39.
    Taming Lachnozilla (tamingin progress) http://en.wikipedia.org/wiki/File:Godzilla_%2754_design.jpg
  • 40.
    What makes LachnoZilla LachnoZilla ?
  • 41.
    Phylogenetic profile based on extremely good matches to other genomes (> 95% ID, > 95% coverage) = “recent” LGT events C. difficile …. “Virulence-associated protein” Mobile DNA 41
  • 42.
    279 genomes Conservedmarker-gene tree LZ & friends Ben Wright 42
  • 43.
    LachnoZilla (and friends) genome graph ! 43
  • 44.
  • 45.
    Distant relative (notso expected) (big genome though!) 45
  • 46.
  • 47.
    Gene-centric graphs LZGenome 1 Genome 2 Genome 3 Genome 4 Genome 5 Genome 6 Gene 1     × × Gene 2     ×  Gene 3    × ×  Gene 4 × × ×    Gene 2 Gene 3 Gene 1 Gene 4 Edge weights are proportional to similarity of distribution Use graph clustering to divide up completely connected, weighted graph
  • 48.
    Lachnozilla in graphform (it all makes sense now) Legionaminic acid Acetylneuraminic acid (pathogen associated) Bacteroides pectinophilus Butyrivibrio proteoclasticus Eubacterium plexicaudatum Roseburia Neighbors Weirdly named isolates
  • 49.
    Mystery isolate #1 (made-up example)
  • 50.
    Mystery isolate #2 (made-up example)
  • 51.
    Representations Clear inference From pattern to understanding uestions
  • 52.