BCS QF Submission - Submitted By : Mohammed Obeid - From Team Leonardo
•
0 likes•51 views

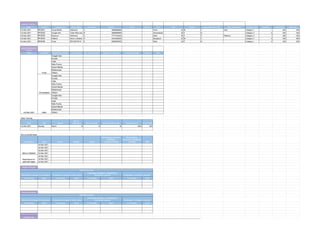
This document contains data from multiple tables summarizing various business metrics including leads by channel, leads and spending by channel, sales tracking, non-converted leads, weekly and monthly forecasts, supplier data, and internal operations reporting for delivery boys and packing/cleaning staff. The tables provide information on order IDs, lead sources, products sold, revenues, customers, suppliers, employees and their corresponding order volumes, costs, commissions and locations.

Recommended
More Related Content
Similar to BCS QF Submission - Submitted By : Mohammed Obeid - From Team Leonardo
Similar to BCS QF Submission - Submitted By : Mohammed Obeid - From Team Leonardo (20)
More from National Management Olympiad
More from National Management Olympiad (20)
Recently uploaded
Recently uploaded (20)
BCS QF Submission - Submitted By : Mohammed Obeid - From Team Leonardo
- 1. Leads By Channel Date Order ID Lead Source Order Status User Name Mobile Email Address City Age Gender Subscribed Plan (Y/N) Plan Subscribed Products Sold Quantity Cost/product Total cost 1st Mar 2021 #FG001 Social Media Delivered A 9999966666 - Pune 25 M Y Gold Category 1 1 250 250 1st Mar 2021 #FG002 Google Ads Order Returned B 8888899999 - Ahmedabad 30 F N - Category 2 2 200 400 1st Mar 2021 #FG003 Brochure Delivered C 7777744444 - Delhi 35 F Y Platinum Category 3 1 300 300 1st Mar 2021 #FG004 Refferal Items in Basket D 4444455555 - Bangalore 23 M Y Category 4 3 220 660 1st Mar 2021 #FG005 Email Abondoned on Cart Page E 6666655555 - Delhi 32 F N Category 1 2 250 500 Leads & Spends by Channel Date Location Marketing channel No. of leads No. of Subscribers Spends on channel Conversion Rate Revenue ROI 1st Mar 2021 Pune Google Ads Emails Calls Web Forms Social Media References Others Ahmedabad Google Ads Emails Calls Web Forms Social Media References Others Delhi Google Ads Emails Calls Web Forms Social Media References Others Sales Tracking Date Day Month No. of customers No. of orders No. of Product sold Total Revenue Total Profit 1st Mar 2021 Monday March 10 15 18 4000 800 Non-converted leads Lead Status Date Name Mobile Email Remarketing channel (SMS/app notification/email) Remarketing Frequency (Weekly/Bi monthly) Offer Items in Basket 1st Mar 2021 1st Mar 2021 1st Mar 2021 1st Mar 2021 Abandoned on payment page 1st Mar 2021 1st Mar 2021 1st Mar 2021 Weekly Forecast Weekly forecast Estimated increase in customers Estimated increase in order value Estimated increase in marketing & distribution spends Estimated. Increase in revenue % increase Value % increase Value % increase Value % increase Value Monthly Forecast Monthly forecast Estimated increase in customers Estimated increase in order value Estimated increase in marketing & distribution spends Estimated. Increase in revenue % increase Value % increase Value % increase Value % increase Value Supplier Data
- 2. Date Supplier Name Mobile Products Supplied Volume Supplied Volume Required Fixed Cost Incentives Total Cost Location Produce (Organic/pesticide s) Supplier Side Analysis No. of suppliers by Area No. of Suppliers by product No. of suppliers by produce (organic/pesticides) Internal Operation reporting Delivery Boys Date Employee Name Designation Work Done No. of Orders delivered Commision per order (If applicable) Packing & Cleanig Staff Date Employee Name Designation Work Done No. of Orders packed Commision per order (If applicable)