Acquisition & Retention Strategy for an Online Campaign
•
15 likes•5,340 views

By Rajat Chadda, BE, MS, MBA w: www.rajatchadda.com e: rchadda@gmail.com
![Campaign Highlights ,[object Object]](data:image/gif;base64,R0lGODlhAQABAIAAAAAAAP///yH5BAEAAAAALAAAAAABAAEAAAIBRAA7)
Recommended
Recommended
More Related Content
What's hot
What's hot (20)
Viewers also liked
Similar to Acquisition & Retention Strategy for an Online Campaign
Similar to Acquisition & Retention Strategy for an Online Campaign (20)
Recently uploaded
Recently uploaded (20)
Acquisition & Retention Strategy for an Online Campaign
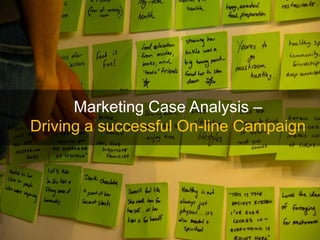
- 1. Marketing Case Analysis – Driving a successful On-line Campaign
- 3. Target Market: 40 to 60 year olds with specific behavioral characteristics customer segments & value drivers!
- 4. 5 Marketing Channels: Online Media, Paid Search, Email, Direct Mail, Phone Sales (offline)
- 5. Marketing Interventions: free downloads, newsletters,
- 6. special offers, on-line access to tools, information resources
- 9. Task 1 Targeted Acquisition Strategy
- 11. Value for customer = Acquisition Cost (A)
- 13. Find good customers and bad customers
- 15. Say we try 300 prospects per channel & we acquire customers… A(Direct Mail) = A1 * #prospects * a1 DM Customers = 10x[Seg1] + 20x[Seg2] + 100x[Seg3] A(Online Media) = A2 * #prospects * a2 OM Customers = 100x[Seg1] + 20x [Seg2] + 10x[Seg3] NOTE: Segment (mix of customers with specific value drivers) is abbreviated as “Seg”
- 17. Calculate VOC Value of Customer = Revenue from customer segment discounted @ 1.5yrs $V(Seg1), $V(Seg2), $V(Seg3)
- 19. If (V – A) is positive, these are good customers!
- 20. If (V – A) is negative, these are bad customers!
- 21. Can rank most profitable segments based on (V-A)
- 22. (V – A)[Seg1] > (V – A)[Seg2] > (V – A)[Seg3]
- 24. Sensitivity Analysis on Customer Life
- 26. builds a network or fortifying community effect
- 27. Prioritize premium content using search ranks
- 28. web content strategy – improves company’s ranking increased customer acquisition
- 30. Success Measures 1. Status Measures 2. Decision Aiding Measures 3. Web Content Measures
- 32. Overall growth rate, YoY / QoQ Growth rate
- 33. Overall ROI
- 34. BCG Matrix
- 35. Total membership, # of Members per segment
- 36. New members per month
- 37. Upgrade / Downgrades of memberships per month
- 38. Cancellations per month
- 39. Segment-wise growth rate
- 40. Increase/decrease in revenues & costs per segment
- 41. Change in Gross Profit / Net Income due to campaign
- 42. Acquisition Spending per channel / per segment
- 43. Retention Spending per channel / per segment
- 45. Campaign positioning vs. Segment positioning
- 46. Segment drill-down metrics using Pivot Tables (e.g. # of customers spending using Email channel and living in a zipcode M5B2X2)
- 47. Probability of Success vs. Profitability using V-A analysis
- 48. Most to least profitable channels
- 49. Most to least profitable segments
- 50. Customer Lifetime Value per segment
- 51. #Prospects vs. Conversion Rate
- 52. Regressions – strongest predictors of ROI, membership etc.
- 53. Industry or Macroeconomic variables
- 55. New Visitors, Unique visitors/page, Time on Page, Bounce rates
- 56. Performance measures i.e. page load times, data access times, search query times, report generation times
- 57. Micro-conversions per page i.e. #downloads, #forms filled, #information resources used, signups etc.
- 58. Recency-Frequency-Magnitude i.e. #visits, visits/day, last visit, time spent, pages/visit etc.
- 59. SEO parameters:
- 60. Inbound links – referral sites ?
- 63. Analyst expects detailed metrics
- 65. Custom Reports – adding a user generated metric or report format
- 67. last 2 months
- 68. last quarter
- 69. last 6 months
- 70. 2010 / 2009 / 2008
- 71. till date
- 73. by segmentsROI Gross Profit Turnover Net Income Overall Growth Rate Segment Growth Rate Size of Customer Base Schedule vs. Cost Variance($) 10
- 74. Campaign “LoremIpsum” Dashboard – CEO Level View Customer Base Annotations Included Customer Base 11
- 75. Campaign “LoremIpsum” Dashboard – Analyst Level View ROI (%) Cost Predictors 3rd Quarter Segment A Results of Regressions Segment Slices by Attribute 12
- 76. 10 Campaign “LoremIpsum” Dashboard – Analyst Level View Web Traffic Analysis Funnel Charts for Lead Generation Analysis 13
- 77. Recommendation Let’s launch this On-line Campaign
Editor's Notes
- Change in Customer behavior using Perceptual Maps