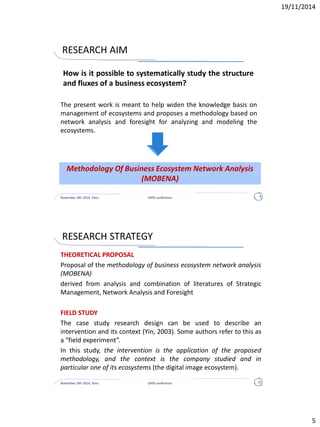
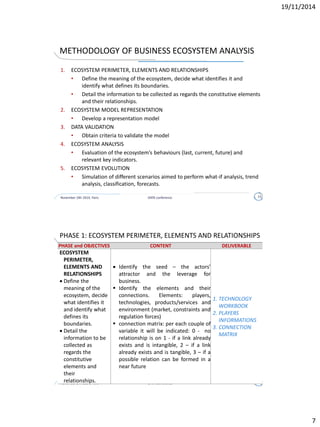
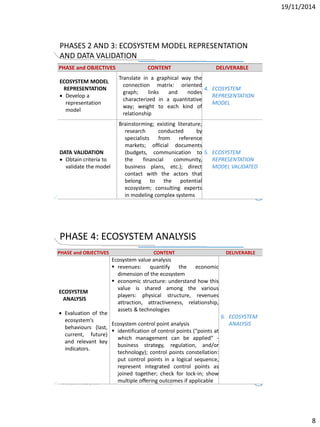
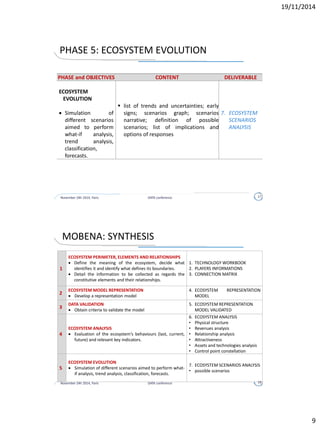
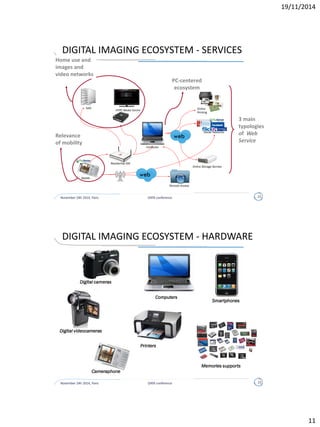
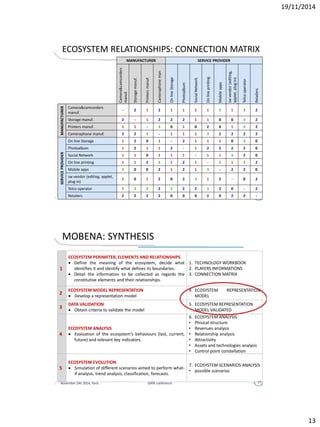
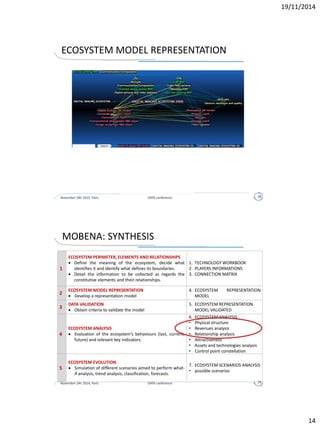
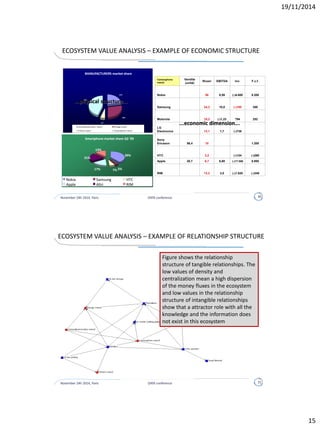
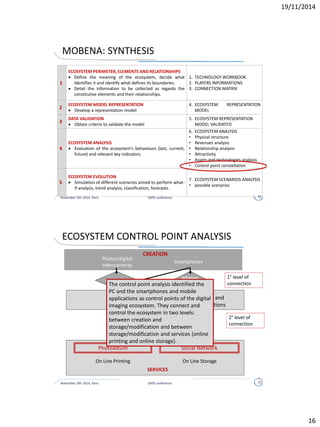
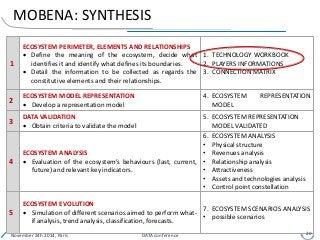
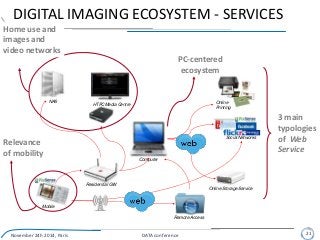
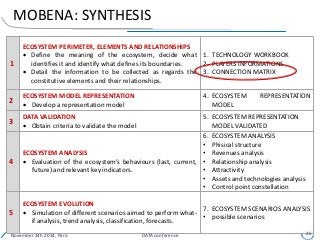
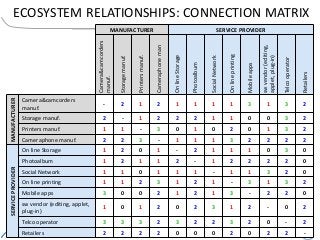
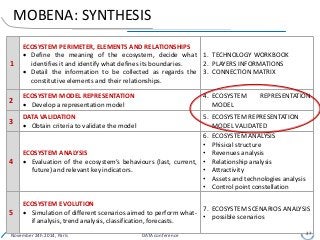
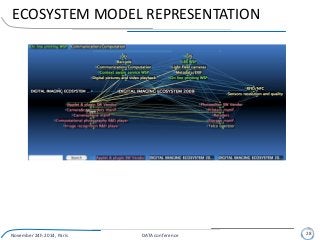
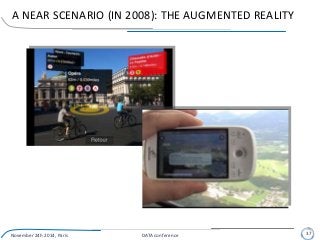
DATA, DIGITAL BUSINESS MODELS,
CLOUD COMPUTING AND ORGANIZATIONAL DESIGN
Université Paris –Sud, Faculté Jean-Monnet, Sceaux, Paris, 24-25 November 2014
Cinzia Battistella
MODELLING A BUSINESS ECOSYSTEM:
A NETWORK ANALYSIS APPROACH
University of Bolzano, Italy
From a work with Colucci, De Toni and Nonino
Ref: Methodology of business ecosystem network analysis,
Technological Forecasting and Social Change 80 (2013) 1194-1210
• Introduction
• Theoretical background
• Research strategy
• Proposal of a methodology for business
ecosystem analysis
• Field study
• Discussion and conclusions
Agenda
November 24h 2014, Paris 2DATA conference
BUSINESS ECOSYSTEM DEFINITION
“A business ecosystem is an economic community supported by a
foundation of interacting organizations and individuals - the
organisms of the business world. It has a complex relational
structure with a high level of reciprocal dependence.
Over time, members co-evolve their capabilities and roles, and
tend to align themselves with the directions set by one or more
central companies. Coordination and collaboration are aimed to
create and share value among all the components of the network.
They enable members:
• to move toward shared visions
• to align their investments
• to find mutually supportive roles.”
Moore, 1993; Iansiti and Levien, 2004
November 24h 2014, Paris DATA conference 3
VALUE CHAIN AND VALUE NETWORK VS BUSINESS ECOSYSTEM
November 24h 2014, Paris DATA conference 4
VALUE
CHAIN
VALUE
NETWORK
BUSINESS
ECOSYSTEM
Porter, 1985 Allee, 2002
Moore, 1993; Iansiti and Levien,
2004
FOCUS value creation process of the firm
complex inter-firms relationships
form the background of the value
creation process
RELATIONSHIPS
volatile supplier/buyer
relationships
network of multi-directional
relationships with firms with shared
values and interests
ADVANTAGES
accumulated value generated by
monetary relationships
also non-monetary advantages –
social capital
FINAL RESULT Sustainability of the single firm
Long term sustainability of the
whole community
UNDERSTANDING THE ECOSYSTEM
Static view - shape and behaviour pattern:
• Architecture: ecosystem components and technological, organizational and
product boundaries
• Integration: relationships and collaborations among companies
• Market management: transitions and balance of power that guarantees their
existence
Dynamic view:
• understanding how it can evolve by monitoring the evolutionary trends with all
the variables involved
November 24h 2014, Paris DATA conference 5
Need of methodologies to help companies in analysing and
monitoring their ecosystems from a static and dynamic point of view,
and investigating how it can potentially impact their businesses.
• Introduction
• Theoretical background
• Research strategy
• Proposal of a methodology for business
ecosystem analysis
• Field study
• Discussion and conclusions
Agenda
November 24h 2014, Paris 6DATA conference
MODELING APPROACHES OF VALUE NETWORKS AND BUSINESS ECOSYSTEMS
MODEL OR
METHODOLOGY
INVESTIGATED OBJECT CRITIQUES
e3-value modeling
(Gordijn et al., 2000)
Value network
(theoretical basis:
industrial view)
Based on agent modeling; Lack of a clear strategic
focus in the model weakens its ability for prescriptive
strategic insights
c3-value model
(Weigand et al., 2007)
Value network
(theoretical basis:
resource-based view)
Based on agent modeling; It focuses on the direct
competitor and the direct customer; It neglects the
inter-dependencies and the potential given by the
network perspective
Value network model
of intangibles
(Alee, 2002)
Value network
Analysis is mostly visual; It assumes that value is
created through exchanges; It is focused on
intangibles exchanges; It does not assign a purpose to
the network; It assumes that the network is not
manageable; It limits potential for strategic analysis
Agent based
methodology
(Marin et al., 2007)
Business ecosystem
Based on agent modeling; Focused only on tangible
exchanges.
BEAM: business
ecosystem analysis and
modeling
(Tian et al., 2009)
Business ecosystem Based on agent modeling; Lacks of a strategic focus
November 24h 2014, Paris DATA conference 7
• Introduction
• Theoretical background
• Research strategy
• Proposal of a methodology for business
ecosystem analysis
• Field study
• Discussion and conclusions
Agenda
November 24h 2014, Paris 8DATA conference
RESEARCH AIM
November 24h 2014, Paris DATA conference 9
The present work is meant to help widen the knowledge basis on
management of ecosystems and proposes a methodology based on
network analysis and foresight for analyzing and modeling the
ecosystems.
Methodology Of Business Ecosystem Network Analysis
(MOBENA)
How is it possible to systematically study the structure
and fluxes of a business ecosystem?
RESEARCH STRATEGY
THEORETICAL PROPOSAL
Proposal of the methodology of business ecosystem network analysis
(MOBENA)
derived from analysis and combination of literatures of Strategic
Management, Network Analysis and Foresight
FIELD STUDY
The case study research design can be used to describe an
intervention and its context (Yin, 2003). Some authors refer to this as
a “field experiment”.
In this study, the intervention is the application of the proposed
methodology, and the context is the company studied and in
particular one of its ecosystems (the digital image ecosystem).
November 24h 2014, Paris DATA conference 10
CHOICE OF THE FIELD STUDY
November 24h 2014, Paris DATA conference 11
• technological innovations headed by ICT and TLC go beyond the value
chain where they have been originated to attract the interest of other
value chains which are so far remote, with different actors, interests
and market objectives
• previous business models can change and latent or even not existing
markets (and consequent business models) can emerge
TLC industry
• exemplar case
• Telecom Italia Future Centre: unit focused on economical studies and
investigation of the future
Telecom Italia
Digital imaging ecosystem
• Introduction
• Theoretical background
• Research strategy
• Proposal of a methodology for business
ecosystem analysis
• Field study
• Discussion and conclusions
Agenda
November 24h 2014, Paris 12DATA conference
METHODOLOGY OF BUSINESS ECOSYSTEM ANALYSIS
November 24h 2014, Paris DATA conference 13
1. ECOSYSTEM PERIMETER, ELEMENTS AND RELATIONSHIPS
• Define the meaning of the ecosystem, decide what identifies it and
identify what defines its boundaries.
• Detail the information to be collected as regards the constitutive elements
and their relationships.
2. ECOSYSTEM MODEL REPRESENTATION
• Develop a representation model
3. DATA VALIDATION
• Obtain criteria to validate the model
4. ECOSYSTEM ANALYSIS
• Evaluation of the ecosystem’s behaviours (last, current, future) and
relevant key indicators.
5. ECOSYSTEM EVOLUTION
• Simulation of different scenarios aimed to perform what-if analysis, trend
analysis, classification, forecasts.
PHASE 1: ECOSYSTEM PERIMETER, ELEMENTS AND RELATIONSHIPS
November 24h 2014, Paris DATA conference 14
PHASE and OBJECTIVES CONTENT DELIVERABLE
ECOSYSTEM
PERIMETER,
ELEMENTS AND
RELATIONSHIPS
 Define the
meaning of the
ecosystem, decide
what identifies it
and identify what
defines its
boundaries.
 Detail the
information to be
collected as
regards the
constitutive
elements and
their
relationships.
 Identify the seed – the actors’
attractor and the leverage for
business.
 Identify the elements and their
connections. Elements: players,
technologies, products/services and
environment (market, constraints and
regulation forces)
 connection matrix: per each couple of
variable it will be indicated: 0 - no
relationship is on 1 - if a link already
exists and is intangible, 2 – if a link
already exists and is tangible, 3 – if a
possible relation can be formed in a
near future
1. TECHNOLOGY
WORKBOOK
2. PLAYERS
INFORMATIONS
3. CONNECTION
MATRIX
November 24h 2014, Paris DATA conference 15
PHASE and OBJECTIVES CONTENT DELIVERABLE
ECOSYSTEM MODEL
REPRESENTATION
 Develop a
representation
model
Translate in a graphical way the
connection matrix: oriented
graph; links and nodes
characterized in a quantitative
way; weight to each kind of
relationship
4. ECOSYSTEM
REPRESENTATION
MODEL
DATA VALIDATION
 Obtain criteria to
validate the model
Brainstorming; existing literature;
research conducted by
specialists from reference
markets; official documents
(budgets, communication to
the financial community,
business plans, etc.); direct
contact with the actors that
belong to the potential
ecosystem; consulting experts
in modeling complex systems
5. ECOSYSTEM
REPRESENTATION
MODEL VALIDATED
PHASES 2 AND 3: ECOSYSTEM MODEL REPRESENTATION
AND DATA VALIDATION
November 24h 2014, Paris DATA conference 16
PHASE and OBJECTIVES CONTENT DELIVERABLE
ECOSYSTEM
ANALYSIS
 Evaluation of the
ecosystem’s
behaviours (last,
current, future)
and relevant key
indicators.
Ecosystem value analysis
 revenues: quantify the economic
dimension of the ecosystem
 economic structure: understand how this
value is shared among the various
players: physical structure, revenues
attraction, attractiveness, relationship,
assets & technologies
Ecosystem control point analysis
 identification of control points (“points at
which management can be applied” -
business strategy, regulation, and/or
technology); control points constellation:
put control points in a logical sequence,
represent integrated control points as
joined together; check for lock-in; show
multiple offering outcomes if applicable
6. ECOSYSTEM
ANALYSIS
PHASE 4: ECOSYSTEM ANALYSIS
November 24h 2014, Paris DATA conference 17
PHASE and OBJECTIVES CONTENT DELIVERABLE
ECOSYSTEM
EVOLUTION
 Simulation of
different scenarios
aimed to perform
what-if analysis,
trend analysis,
classification,
forecasts.
 list of trends and uncertainties; early
signs; scenarios graph; scenarios
narrative; definition of possible
scenarios; list of implications and
options of responses
7. ECOSYSTEM
SCENARIOS
ANALYSIS
PHASE 5: ECOSYSTEM EVOLUTION
MOBENA: SYNTHESIS
1
ECOSYSTEM PERIMETER, ELEMENTS AND RELATIONSHIPS
 Define the meaning of the ecosystem, decide what
identifies it and identify what defines its boundaries.
 Detail the information to be collected as regards the
constitutive elements and their relationships.
1. TECHNOLOGY WORKBOOK
2. PLAYERS INFORMATIONS
3. CONNECTION MATRIX
2
ECOSYSTEM MODEL REPRESENTATION
 Develop a representation model
4. ECOSYSTEM REPRESENTATION
MODEL
3
DATA VALIDATION
 Obtain criteria to validate the model
5. ECOSYSTEM REPRESENTATION
MODEL VALIDATED
4
ECOSYSTEM ANALYSIS
 Evaluation of the ecosystem’s behaviours (last, current,
future) and relevant key indicators.
6. ECOSYSTEM ANALYSIS
• Physical structure
• Revenues analysis
• Relationship analysis
• Attractiveness
• Assets and technologies analysis
• Control point constellation
5
ECOSYSTEM EVOLUTION
 Simulation of different scenarios aimed to perform what-
if analysis, trend analysis, classification, forecasts.
7. ECOSYSTEM SCENARIOS ANALYSIS
• possible scenarios
November 24h 2014, Paris DATA conference 18
• Introduction
• Theoretical background
• Research strategy
• Proposal of a methodology for business
ecosystem analysis
• Field study
• Discussion and conclusions
Agenda
November 24h 2014, Paris 19DATA conference
MOBENA: SYNTHESIS
1
ECOSYSTEM PERIMETER, ELEMENTS AND RELATIONSHIPS
 Define the meaning of the ecosystem, decide what
identifies it and identify what defines its boundaries.
 Detail the information to be collected as regards the
constitutive elements and their relationships.
1. TECHNOLOGY WORKBOOK
2. PLAYERS INFORMATIONS
3. CONNECTION MATRIX
2
ECOSYSTEM MODEL REPRESENTATION
 Develop a representation model
4. ECOSYSTEM REPRESENTATION
MODEL
3
DATA VALIDATION
 Obtain criteria to validate the model
5. ECOSYSTEM REPRESENTATION
MODEL VALIDATED
4
ECOSYSTEM ANALYSIS
 Evaluation of the ecosystem’s behaviours (last, current,
future) and relevant key indicators.
6. ECOSYSTEM ANALYSIS
• Physical structure
• Revenues analysis
• Relationship analysis
• Attractiveness
• Assets and technologies analysis
• Control point constellation
5
ECOSYSTEM EVOLUTION
 Simulation of different scenarios aimed to perform what-
if analysis, trend analysis, classification, forecasts.
7. ECOSYSTEM SCENARIOS ANALYSIS
• possible scenarios
November 24h 2014, Paris DATA conference 20
DIGITAL IMAGING ECOSYSTEM - SERVICES
Digital Imaging Ecosystem /Mobile Channel / Scenario 1
HTPCMedia Centre Online
Printing
Online Storage Service
Computer
NAS
Mobile
Remote Access
Social Networks
Residential GW
3 main
typologies
of Web
Service
PC-centered
ecosystem
Home use and
images and
video networks
Relevance
of mobility
November 24h 2014, Paris DATA conference 21
DIGITAL IMAGING ECOSYSTEM - HARDWARE
Digital cameras
Digital videocameras
Cameraphone
Computers
Smartphones
Printers
Memories supports
November 24h 2014, Paris DATA conference 22
ECOSYSTEM PERIMETER AND ELEMENTS
November 24h 2014, Paris DATA conference 24
ACTORS
Manufacturers: class of actors connected to the consumer-electronics
production, in other words the hardware part of the ecosystem; they are
typically constrained to obtain cost-efficiency through scale-economies and
realize high production-volumes. They are: camera and camcorders
manufacturers, storage manufacturers, printers manufacturers, cameraphone
manufacturers
Service Providers: their offer is connected to services and not-tangible
functionalities for users. They are: on line storage providers; photoalbum
providers; social network providers; on-line printing providers; mobile
applications providers; software vendors providers; telco operators providers;
retailers providers
TECHNOLOGIES
As regards the enabling technologies of the Digital Imaging Ecosystem, we
identified these categories: Computational photography, Sensors resolution and
quality, Still/motion convergence, Barcode / QR Code, RFID / NFC, GPS, Wireless
/ Mobile, Metadata Exif, 3D, Digital pictures and video playback.
MOBENA: SYNTHESIS
1
ECOSYSTEM PERIMETER, ELEMENTS AND RELATIONSHIPS
 Define the meaning of the ecosystem, decide what
identifies it and identify what defines its boundaries.
 Detail the information to be collected as regards the
constitutive elements and their relationships.
1. TECHNOLOGY WORKBOOK
2. PLAYERS INFORMATIONS
3. CONNECTION MATRIX
2
ECOSYSTEM MODEL REPRESENTATION
 Develop a representation model
4. ECOSYSTEM REPRESENTATION
MODEL
3
DATA VALIDATION
 Obtain criteria to validate the model
5. ECOSYSTEM REPRESENTATION
MODEL VALIDATED
4
ECOSYSTEM ANALYSIS
 Evaluation of the ecosystem’s behaviours (last, current,
future) and relevant key indicators.
6. ECOSYSTEM ANALYSIS
• Phisical structure
• Revenues analysis
• Relationship analysis
• Attractivity
• Assets and technologies analysis
• Control point constellation
5
ECOSYSTEM EVOLUTION
 Simulation of different scenarios aimed to perform what-
if analysis, trend analysis, classification, forecasts.
7. ECOSYSTEM SCENARIOS ANALYSIS
• possible scenarios
November 24h 2014, Paris DATA conference 25
ECOSYSTEM RELATIONSHIPS: CONNECTION MATRIX
November 24h 2014, Paris DATA conference 26
MANUFACTURER SERVICE PROVIDER
Camera&camcorders
manuf.
Storagemanuf.
Printersmanuf.
Cameraphoneman
OnlineStorage
Photoalbum
SocialNetwork
Onlineprinting
Mobileapps
swvendor(editing,
applet,plug-in)
Telcooperator
Retailers
MANUFACTURER
Camera&camcorders
manuf.
- 2 1 2 1 1 1 1 3 1 3 2
Storage manuf. 2 - 1 2 2 2 1 1 0 0 3 2
Printers manuf. 1 1 - 3 0 1 0 2 0 1 3 2
Cameraphone manuf. 2 2 3 - 1 1 1 3 2 2 2 2
SERVICEPROVIDER
On line Storage 1 2 0 1 - 2 1 1 1 0 3 0
Photoalbum 1 2 1 1 2 - 1 2 2 2 2 0
Social Network 1 1 0 1 1 1 - 1 1 3 2 0
On line printing 1 1 2 3 1 2 1 - 3 1 3 2
Mobile apps 3 0 0 2 1 2 1 3 - 2 2 0
sw vendor (editing, applet,
plug-in)
1 0 1 2 0 2 3 1 2 - 0 2
Telco operator 3 3 3 2 3 2 2 3 2 0 - 2
Retailers 2 2 2 2 0 0 0 2 0 2 2 -
MOBENA: SYNTHESIS
1
ECOSYSTEM PERIMETER, ELEMENTS AND RELATIONSHIPS
 Define the meaning of the ecosystem, decide what
identifies it and identify what defines its boundaries.
 Detail the information to be collected as regards the
constitutive elements and their relationships.
1. TECHNOLOGY WORKBOOK
2. PLAYERS INFORMATIONS
3. CONNECTION MATRIX
2
ECOSYSTEM MODEL REPRESENTATION
 Develop a representation model
4. ECOSYSTEM REPRESENTATION
MODEL
3
DATA VALIDATION
 Obtain criteria to validate the model
5. ECOSYSTEM REPRESENTATION
MODEL VALIDATED
4
ECOSYSTEM ANALYSIS
 Evaluation of the ecosystem’s behaviours (last, current,
future) and relevant key indicators.
6. ECOSYSTEM ANALYSIS
• Phisical structure
• Revenues analysis
• Relationship analysis
• Attractivity
• Assets and technologies analysis
• Control point constellation
5
ECOSYSTEM EVOLUTION
 Simulation of different scenarios aimed to perform what-
if analysis, trend analysis, classification, forecasts.
7. ECOSYSTEM SCENARIOS ANALYSIS
• possible scenarios
November 24h 2014, Paris DATA conference 27
ECOSYSTEM MODEL REPRESENTATION
November 24h 2014, Paris DATA conference 28
MOBENA: SYNTHESIS
1
ECOSYSTEM PERIMETER, ELEMENTS AND RELATIONSHIPS
 Define the meaning of the ecosystem, decide what
identifies it and identify what defines its boundaries.
 Detail the information to be collected as regards the
constitutive elements and their relationships.
1. TECHNOLOGY WORKBOOK
2. PLAYERS INFORMATIONS
3. CONNECTION MATRIX
2
ECOSYSTEM MODEL REPRESENTATION
 Develop a representation model
4. ECOSYSTEM REPRESENTATION
MODEL
3
DATA VALIDATION
 Obtain criteria to validate the model
5. ECOSYSTEM REPRESENTATION
MODEL VALIDATED
4
ECOSYSTEM ANALYSIS
 Evaluation of the ecosystem’s behaviours (last, current,
future) and relevant key indicators.
6. ECOSYSTEM ANALYSIS
• Physical structure
• Revenues analysis
• Relationship analysis
• Attractiveness
• Assets and technologies analysis
• Control point constellation
5
ECOSYSTEM EVOLUTION
 Simulation of different scenarios aimed to perform what-
if analysis, trend analysis, classification, forecasts.
7. ECOSYSTEM SCENARIOS ANALYSIS
• possible scenarios
November 24h 2014, Paris DATA conference 29
ECOSYSTEM VALUE ANALYSIS – EXAMPLE OF ECONOMIC STRUCTURE
Cameraphone
manuf.
Vendite
(unità)
Ricavi EBITDA Inv. F.c.f.
Nokia 58 9,59 (-)4.600 8.200
Samsung 24,3 10,8 (-)180 300
Motorola 10,2 (-)1,23 794 252
LG
Electronics 13,1 1,7 (-)738
Sony
Ericsson 56,4 10 1.200
HTC 3,2 (-)124 (-)260
Apple 20,7 6,7 8,69 (-)17.000 8.950
RIM 13,2 3,5 (-)1.820 (-)349
MANUFACTURERS market share
22%
28%
44%
6%
Camera&camcorders manuf. Storage manuf.
Printers manuf. Cameraphone manuf.
Smartphone market share Q3 '09
39%
3%7%17%
21%
13%
Nokia Samsung HTC
Apple Altri RIM
...physical structure...
...economic dimension...
November 24h 2014, Paris DATA conference 30
ECOSYSTEM VALUE ANALYSIS – EXAMPLE OF RELATIONSHIP STRUCTURE
November 24h 2014, Paris DATA conference 31
Figure shows the relationship
structure of tangible relationships. The
low values of density and
centralization mean a high dispersion
of the money fluxes in the ecosystem
and low values in the relationship
structure of intangible relationships
show that a attractor role with all the
knowledge and the information does
not exist in this ecosystem
MOBENA: SYNTHESIS
1
ECOSYSTEM PERIMETER, ELEMENTS AND RELATIONSHIPS
 Define the meaning of the ecosystem, decide what
identifies it and identify what defines its boundaries.
 Detail the information to be collected as regards the
constitutive elements and their relationships.
1. TECHNOLOGY WORKBOOK
2. PLAYERS INFORMATIONS
3. CONNECTION MATRIX
2
ECOSYSTEM MODEL REPRESENTATION
 Develop a representation model
4. ECOSYSTEM REPRESENTATION
MODEL
3
DATA VALIDATION
 Obtain criteria to validate the model
5. ECOSYSTEM REPRESENTATION
MODEL VALIDATED
4
ECOSYSTEM ANALYSIS
 Evaluation of the ecosystem’s behaviours (last, current,
future) and relevant key indicators.
6. ECOSYSTEM ANALYSIS
• Physical structure
• Revenues analysis
• Relationship analysis
• Attractivity
• Assets and technologies analysis
• Control point constellation
5
ECOSYSTEM EVOLUTION
 Simulation of different scenarios aimed to perform what-
if analysis, trend analysis, classification, forecasts.
7. ECOSYSTEM SCENARIOS ANALYSIS
• possible scenarios
November 24h 2014, Paris DATA conference 32
ECOSYSTEM CONTROL POINT ANALYSIS
CREATION
Photos/digital
videocameras
Smartphones
Wireless
connection
Connection
On Line Storage
Photoalbum
On Line Printing
Social Network
SERVICES
1° level of
connection
INTERNET CONNECTION
Wired Wireless
November 24h 2014, Paris DATA conference 33
2° level of
connection
Smartphones and
mobile applications
PC STORAGE/
MODIFICATION
The control point analysis identified the
PC and the smartphones and mobile
applications as control points of the digital
imaging ecosystem. They connect and
control the ecosystem in two levels:
between creation and
storage/modification and between
storage/modification and services (online
printing and online storage).
MOBENA: SYNTHESIS
1
ECOSYSTEM PERIMETER, ELEMENTS AND RELATIONSHIPS
 Define the meaning of the ecosystem, decide what
identifies it and identify what defines its boundaries.
 Detail the information to be collected as regards the
constitutive elements and their relationships.
1. TECHNOLOGY WORKBOOK
2. PLAYERS INFORMATIONS
3. CONNECTION MATRIX
2
ECOSYSTEM MODEL REPRESENTATION
 Develop a representation model
4. ECOSYSTEM REPRESENTATION
MODEL
3
DATA VALIDATION
 Obtain criteria to validate the model
5. ECOSYSTEM REPRESENTATION
MODEL VALIDATED
4
ECOSYSTEM ANALYSIS
 Evaluation of the ecosystem’s behaviours (last, current,
future) and relevant key indicators.
6. ECOSYSTEM ANALYSIS
• Physical structure
• Revenues analysis
• Relationship analysis
• Attractiveness
• Assets and technologies analysis
• Control point constellation
5
ECOSYSTEM EVOLUTION
 Simulation of different scenarios aimed to perform what-
if analysis, trend analysis, classification, forecasts.
7. ECOSYSTEM SCENARIOS ANALYSIS
• possible scenarios
November 24h 2014, Paris DATA conference 34
TRENDS AFFECTING THE ECOSYSTEM
Memory capacity
increment
Diminution of the price for GB
Fonte: www.letsgodigital.org
Fonte: http://www.researchinchina.com/report/Electronics/3390.html
November 24h 2014, Paris DATA conference 35
UNCERTAINTIES
There are two main uncertainties (service ubiquity
and information sources)
 identify four main scenarios (Real Time Sharing,
Image Recognition, Mobile Augmented Reality,
On line backup & Sharing).
November 24h 2014, Paris DATA conference 36
A NEAR SCENARIO (IN 2008): THE AUGMENTED REALITY
November 24h 2014, Paris DATA conference 37
• Introduction
• Theoretical background
• Research strategy
• Proposal of a methodology for business
ecosystem analysis
• Field study
• Discussion and conclusions
Agenda
November 24h 2014, Paris 38DATA conference
CONCLUSIONS
As businesses become more and more modularized, characterizing entity
relationships and understanding how business decisions or actions taken by one
entity impact all of the interrelated entities, both within and among
enterprises, become a key challenge. Ignoring these interactions can lead to
unexpected and potentially undesirable outcomes.
Tools that help to systematically characterize the business ecosystem (or network)
and analyze the potential impact of different business decisions on each entity
in the network are essential for improving business design.
The knowledge of a phenomenon is the basis of its evolution. The methodology of
business ecosystem network analysis (MOBENA) is a first step to build a tool
that can facilitate the knowledge about the business ecosystems, with a first
improvement toward the standardization of the procedure for different
contexts and the reusability of data and information.
November 24h 2014, Paris DATA conference 39
DATA, DIGITAL BUSINESS MODELS,
CLOUD COMPUTING AND ORGANIZATIONAL DESIGN
Université Paris –Sud, Faculté Jean-Monnet, Sceaux, Paris, 24-25 November 2014
Cinzia Battistella
MODELLING A BUSINESS ECOSYSTEM:
A NETWORK ANALYSIS APPROACH
University of Bolzano, Italy
From a work with Colucci, De Toni and Nonino
Ref: Methodology of business ecosystem network analysis,
Technological Forecasting and Social Change 80 (2013) 1194-1210

Cinzia Battistella; Modeling a business ecosystem: a network analysis approach

  • 1.
    DATA, DIGITAL BUSINESSMODELS, CLOUD COMPUTING AND ORGANIZATIONAL DESIGN Université Paris –Sud, Faculté Jean-Monnet, Sceaux, Paris, 24-25 November 2014 Cinzia Battistella MODELLING A BUSINESS ECOSYSTEM: A NETWORK ANALYSIS APPROACH University of Bolzano, Italy From a work with Colucci, De Toni and Nonino Ref: Methodology of business ecosystem network analysis, Technological Forecasting and Social Change 80 (2013) 1194-1210
  • 2.
    • Introduction • Theoreticalbackground • Research strategy • Proposal of a methodology for business ecosystem analysis • Field study • Discussion and conclusions Agenda November 24h 2014, Paris 2DATA conference
  • 3.
    BUSINESS ECOSYSTEM DEFINITION “Abusiness ecosystem is an economic community supported by a foundation of interacting organizations and individuals - the organisms of the business world. It has a complex relational structure with a high level of reciprocal dependence. Over time, members co-evolve their capabilities and roles, and tend to align themselves with the directions set by one or more central companies. Coordination and collaboration are aimed to create and share value among all the components of the network. They enable members: • to move toward shared visions • to align their investments • to find mutually supportive roles.” Moore, 1993; Iansiti and Levien, 2004 November 24h 2014, Paris DATA conference 3
  • 4.
    VALUE CHAIN ANDVALUE NETWORK VS BUSINESS ECOSYSTEM November 24h 2014, Paris DATA conference 4 VALUE CHAIN VALUE NETWORK BUSINESS ECOSYSTEM Porter, 1985 Allee, 2002 Moore, 1993; Iansiti and Levien, 2004 FOCUS value creation process of the firm complex inter-firms relationships form the background of the value creation process RELATIONSHIPS volatile supplier/buyer relationships network of multi-directional relationships with firms with shared values and interests ADVANTAGES accumulated value generated by monetary relationships also non-monetary advantages – social capital FINAL RESULT Sustainability of the single firm Long term sustainability of the whole community
  • 5.
    UNDERSTANDING THE ECOSYSTEM Staticview - shape and behaviour pattern: • Architecture: ecosystem components and technological, organizational and product boundaries • Integration: relationships and collaborations among companies • Market management: transitions and balance of power that guarantees their existence Dynamic view: • understanding how it can evolve by monitoring the evolutionary trends with all the variables involved November 24h 2014, Paris DATA conference 5 Need of methodologies to help companies in analysing and monitoring their ecosystems from a static and dynamic point of view, and investigating how it can potentially impact their businesses.
  • 6.
    • Introduction • Theoreticalbackground • Research strategy • Proposal of a methodology for business ecosystem analysis • Field study • Discussion and conclusions Agenda November 24h 2014, Paris 6DATA conference
  • 7.
    MODELING APPROACHES OFVALUE NETWORKS AND BUSINESS ECOSYSTEMS MODEL OR METHODOLOGY INVESTIGATED OBJECT CRITIQUES e3-value modeling (Gordijn et al., 2000) Value network (theoretical basis: industrial view) Based on agent modeling; Lack of a clear strategic focus in the model weakens its ability for prescriptive strategic insights c3-value model (Weigand et al., 2007) Value network (theoretical basis: resource-based view) Based on agent modeling; It focuses on the direct competitor and the direct customer; It neglects the inter-dependencies and the potential given by the network perspective Value network model of intangibles (Alee, 2002) Value network Analysis is mostly visual; It assumes that value is created through exchanges; It is focused on intangibles exchanges; It does not assign a purpose to the network; It assumes that the network is not manageable; It limits potential for strategic analysis Agent based methodology (Marin et al., 2007) Business ecosystem Based on agent modeling; Focused only on tangible exchanges. BEAM: business ecosystem analysis and modeling (Tian et al., 2009) Business ecosystem Based on agent modeling; Lacks of a strategic focus November 24h 2014, Paris DATA conference 7
  • 8.
    • Introduction • Theoreticalbackground • Research strategy • Proposal of a methodology for business ecosystem analysis • Field study • Discussion and conclusions Agenda November 24h 2014, Paris 8DATA conference
  • 9.
    RESEARCH AIM November 24h2014, Paris DATA conference 9 The present work is meant to help widen the knowledge basis on management of ecosystems and proposes a methodology based on network analysis and foresight for analyzing and modeling the ecosystems. Methodology Of Business Ecosystem Network Analysis (MOBENA) How is it possible to systematically study the structure and fluxes of a business ecosystem?
  • 10.
    RESEARCH STRATEGY THEORETICAL PROPOSAL Proposalof the methodology of business ecosystem network analysis (MOBENA) derived from analysis and combination of literatures of Strategic Management, Network Analysis and Foresight FIELD STUDY The case study research design can be used to describe an intervention and its context (Yin, 2003). Some authors refer to this as a “field experiment”. In this study, the intervention is the application of the proposed methodology, and the context is the company studied and in particular one of its ecosystems (the digital image ecosystem). November 24h 2014, Paris DATA conference 10
  • 11.
    CHOICE OF THEFIELD STUDY November 24h 2014, Paris DATA conference 11 • technological innovations headed by ICT and TLC go beyond the value chain where they have been originated to attract the interest of other value chains which are so far remote, with different actors, interests and market objectives • previous business models can change and latent or even not existing markets (and consequent business models) can emerge TLC industry • exemplar case • Telecom Italia Future Centre: unit focused on economical studies and investigation of the future Telecom Italia Digital imaging ecosystem
  • 12.
    • Introduction • Theoreticalbackground • Research strategy • Proposal of a methodology for business ecosystem analysis • Field study • Discussion and conclusions Agenda November 24h 2014, Paris 12DATA conference
  • 13.
    METHODOLOGY OF BUSINESSECOSYSTEM ANALYSIS November 24h 2014, Paris DATA conference 13 1. ECOSYSTEM PERIMETER, ELEMENTS AND RELATIONSHIPS • Define the meaning of the ecosystem, decide what identifies it and identify what defines its boundaries. • Detail the information to be collected as regards the constitutive elements and their relationships. 2. ECOSYSTEM MODEL REPRESENTATION • Develop a representation model 3. DATA VALIDATION • Obtain criteria to validate the model 4. ECOSYSTEM ANALYSIS • Evaluation of the ecosystem’s behaviours (last, current, future) and relevant key indicators. 5. ECOSYSTEM EVOLUTION • Simulation of different scenarios aimed to perform what-if analysis, trend analysis, classification, forecasts.
  • 14.
    PHASE 1: ECOSYSTEMPERIMETER, ELEMENTS AND RELATIONSHIPS November 24h 2014, Paris DATA conference 14 PHASE and OBJECTIVES CONTENT DELIVERABLE ECOSYSTEM PERIMETER, ELEMENTS AND RELATIONSHIPS  Define the meaning of the ecosystem, decide what identifies it and identify what defines its boundaries.  Detail the information to be collected as regards the constitutive elements and their relationships.  Identify the seed – the actors’ attractor and the leverage for business.  Identify the elements and their connections. Elements: players, technologies, products/services and environment (market, constraints and regulation forces)  connection matrix: per each couple of variable it will be indicated: 0 - no relationship is on 1 - if a link already exists and is intangible, 2 – if a link already exists and is tangible, 3 – if a possible relation can be formed in a near future 1. TECHNOLOGY WORKBOOK 2. PLAYERS INFORMATIONS 3. CONNECTION MATRIX
  • 15.
    November 24h 2014,Paris DATA conference 15 PHASE and OBJECTIVES CONTENT DELIVERABLE ECOSYSTEM MODEL REPRESENTATION  Develop a representation model Translate in a graphical way the connection matrix: oriented graph; links and nodes characterized in a quantitative way; weight to each kind of relationship 4. ECOSYSTEM REPRESENTATION MODEL DATA VALIDATION  Obtain criteria to validate the model Brainstorming; existing literature; research conducted by specialists from reference markets; official documents (budgets, communication to the financial community, business plans, etc.); direct contact with the actors that belong to the potential ecosystem; consulting experts in modeling complex systems 5. ECOSYSTEM REPRESENTATION MODEL VALIDATED PHASES 2 AND 3: ECOSYSTEM MODEL REPRESENTATION AND DATA VALIDATION
  • 16.
    November 24h 2014,Paris DATA conference 16 PHASE and OBJECTIVES CONTENT DELIVERABLE ECOSYSTEM ANALYSIS  Evaluation of the ecosystem’s behaviours (last, current, future) and relevant key indicators. Ecosystem value analysis  revenues: quantify the economic dimension of the ecosystem  economic structure: understand how this value is shared among the various players: physical structure, revenues attraction, attractiveness, relationship, assets & technologies Ecosystem control point analysis  identification of control points (“points at which management can be applied” - business strategy, regulation, and/or technology); control points constellation: put control points in a logical sequence, represent integrated control points as joined together; check for lock-in; show multiple offering outcomes if applicable 6. ECOSYSTEM ANALYSIS PHASE 4: ECOSYSTEM ANALYSIS
  • 17.
    November 24h 2014,Paris DATA conference 17 PHASE and OBJECTIVES CONTENT DELIVERABLE ECOSYSTEM EVOLUTION  Simulation of different scenarios aimed to perform what-if analysis, trend analysis, classification, forecasts.  list of trends and uncertainties; early signs; scenarios graph; scenarios narrative; definition of possible scenarios; list of implications and options of responses 7. ECOSYSTEM SCENARIOS ANALYSIS PHASE 5: ECOSYSTEM EVOLUTION
  • 18.
    MOBENA: SYNTHESIS 1 ECOSYSTEM PERIMETER,ELEMENTS AND RELATIONSHIPS  Define the meaning of the ecosystem, decide what identifies it and identify what defines its boundaries.  Detail the information to be collected as regards the constitutive elements and their relationships. 1. TECHNOLOGY WORKBOOK 2. PLAYERS INFORMATIONS 3. CONNECTION MATRIX 2 ECOSYSTEM MODEL REPRESENTATION  Develop a representation model 4. ECOSYSTEM REPRESENTATION MODEL 3 DATA VALIDATION  Obtain criteria to validate the model 5. ECOSYSTEM REPRESENTATION MODEL VALIDATED 4 ECOSYSTEM ANALYSIS  Evaluation of the ecosystem’s behaviours (last, current, future) and relevant key indicators. 6. ECOSYSTEM ANALYSIS • Physical structure • Revenues analysis • Relationship analysis • Attractiveness • Assets and technologies analysis • Control point constellation 5 ECOSYSTEM EVOLUTION  Simulation of different scenarios aimed to perform what- if analysis, trend analysis, classification, forecasts. 7. ECOSYSTEM SCENARIOS ANALYSIS • possible scenarios November 24h 2014, Paris DATA conference 18
  • 19.
    • Introduction • Theoreticalbackground • Research strategy • Proposal of a methodology for business ecosystem analysis • Field study • Discussion and conclusions Agenda November 24h 2014, Paris 19DATA conference
  • 20.
    MOBENA: SYNTHESIS 1 ECOSYSTEM PERIMETER,ELEMENTS AND RELATIONSHIPS  Define the meaning of the ecosystem, decide what identifies it and identify what defines its boundaries.  Detail the information to be collected as regards the constitutive elements and their relationships. 1. TECHNOLOGY WORKBOOK 2. PLAYERS INFORMATIONS 3. CONNECTION MATRIX 2 ECOSYSTEM MODEL REPRESENTATION  Develop a representation model 4. ECOSYSTEM REPRESENTATION MODEL 3 DATA VALIDATION  Obtain criteria to validate the model 5. ECOSYSTEM REPRESENTATION MODEL VALIDATED 4 ECOSYSTEM ANALYSIS  Evaluation of the ecosystem’s behaviours (last, current, future) and relevant key indicators. 6. ECOSYSTEM ANALYSIS • Physical structure • Revenues analysis • Relationship analysis • Attractiveness • Assets and technologies analysis • Control point constellation 5 ECOSYSTEM EVOLUTION  Simulation of different scenarios aimed to perform what- if analysis, trend analysis, classification, forecasts. 7. ECOSYSTEM SCENARIOS ANALYSIS • possible scenarios November 24h 2014, Paris DATA conference 20
  • 21.
    DIGITAL IMAGING ECOSYSTEM- SERVICES Digital Imaging Ecosystem /Mobile Channel / Scenario 1 HTPCMedia Centre Online Printing Online Storage Service Computer NAS Mobile Remote Access Social Networks Residential GW 3 main typologies of Web Service PC-centered ecosystem Home use and images and video networks Relevance of mobility November 24h 2014, Paris DATA conference 21
  • 22.
    DIGITAL IMAGING ECOSYSTEM- HARDWARE Digital cameras Digital videocameras Cameraphone Computers Smartphones Printers Memories supports November 24h 2014, Paris DATA conference 22
  • 23.
    ECOSYSTEM PERIMETER ANDELEMENTS November 24h 2014, Paris DATA conference 24 ACTORS Manufacturers: class of actors connected to the consumer-electronics production, in other words the hardware part of the ecosystem; they are typically constrained to obtain cost-efficiency through scale-economies and realize high production-volumes. They are: camera and camcorders manufacturers, storage manufacturers, printers manufacturers, cameraphone manufacturers Service Providers: their offer is connected to services and not-tangible functionalities for users. They are: on line storage providers; photoalbum providers; social network providers; on-line printing providers; mobile applications providers; software vendors providers; telco operators providers; retailers providers TECHNOLOGIES As regards the enabling technologies of the Digital Imaging Ecosystem, we identified these categories: Computational photography, Sensors resolution and quality, Still/motion convergence, Barcode / QR Code, RFID / NFC, GPS, Wireless / Mobile, Metadata Exif, 3D, Digital pictures and video playback.
  • 24.
    MOBENA: SYNTHESIS 1 ECOSYSTEM PERIMETER,ELEMENTS AND RELATIONSHIPS  Define the meaning of the ecosystem, decide what identifies it and identify what defines its boundaries.  Detail the information to be collected as regards the constitutive elements and their relationships. 1. TECHNOLOGY WORKBOOK 2. PLAYERS INFORMATIONS 3. CONNECTION MATRIX 2 ECOSYSTEM MODEL REPRESENTATION  Develop a representation model 4. ECOSYSTEM REPRESENTATION MODEL 3 DATA VALIDATION  Obtain criteria to validate the model 5. ECOSYSTEM REPRESENTATION MODEL VALIDATED 4 ECOSYSTEM ANALYSIS  Evaluation of the ecosystem’s behaviours (last, current, future) and relevant key indicators. 6. ECOSYSTEM ANALYSIS • Phisical structure • Revenues analysis • Relationship analysis • Attractivity • Assets and technologies analysis • Control point constellation 5 ECOSYSTEM EVOLUTION  Simulation of different scenarios aimed to perform what- if analysis, trend analysis, classification, forecasts. 7. ECOSYSTEM SCENARIOS ANALYSIS • possible scenarios November 24h 2014, Paris DATA conference 25
  • 25.
    ECOSYSTEM RELATIONSHIPS: CONNECTIONMATRIX November 24h 2014, Paris DATA conference 26 MANUFACTURER SERVICE PROVIDER Camera&camcorders manuf. Storagemanuf. Printersmanuf. Cameraphoneman OnlineStorage Photoalbum SocialNetwork Onlineprinting Mobileapps swvendor(editing, applet,plug-in) Telcooperator Retailers MANUFACTURER Camera&camcorders manuf. - 2 1 2 1 1 1 1 3 1 3 2 Storage manuf. 2 - 1 2 2 2 1 1 0 0 3 2 Printers manuf. 1 1 - 3 0 1 0 2 0 1 3 2 Cameraphone manuf. 2 2 3 - 1 1 1 3 2 2 2 2 SERVICEPROVIDER On line Storage 1 2 0 1 - 2 1 1 1 0 3 0 Photoalbum 1 2 1 1 2 - 1 2 2 2 2 0 Social Network 1 1 0 1 1 1 - 1 1 3 2 0 On line printing 1 1 2 3 1 2 1 - 3 1 3 2 Mobile apps 3 0 0 2 1 2 1 3 - 2 2 0 sw vendor (editing, applet, plug-in) 1 0 1 2 0 2 3 1 2 - 0 2 Telco operator 3 3 3 2 3 2 2 3 2 0 - 2 Retailers 2 2 2 2 0 0 0 2 0 2 2 -
  • 26.
    MOBENA: SYNTHESIS 1 ECOSYSTEM PERIMETER,ELEMENTS AND RELATIONSHIPS  Define the meaning of the ecosystem, decide what identifies it and identify what defines its boundaries.  Detail the information to be collected as regards the constitutive elements and their relationships. 1. TECHNOLOGY WORKBOOK 2. PLAYERS INFORMATIONS 3. CONNECTION MATRIX 2 ECOSYSTEM MODEL REPRESENTATION  Develop a representation model 4. ECOSYSTEM REPRESENTATION MODEL 3 DATA VALIDATION  Obtain criteria to validate the model 5. ECOSYSTEM REPRESENTATION MODEL VALIDATED 4 ECOSYSTEM ANALYSIS  Evaluation of the ecosystem’s behaviours (last, current, future) and relevant key indicators. 6. ECOSYSTEM ANALYSIS • Phisical structure • Revenues analysis • Relationship analysis • Attractivity • Assets and technologies analysis • Control point constellation 5 ECOSYSTEM EVOLUTION  Simulation of different scenarios aimed to perform what- if analysis, trend analysis, classification, forecasts. 7. ECOSYSTEM SCENARIOS ANALYSIS • possible scenarios November 24h 2014, Paris DATA conference 27
  • 27.
    ECOSYSTEM MODEL REPRESENTATION November24h 2014, Paris DATA conference 28
  • 28.
    MOBENA: SYNTHESIS 1 ECOSYSTEM PERIMETER,ELEMENTS AND RELATIONSHIPS  Define the meaning of the ecosystem, decide what identifies it and identify what defines its boundaries.  Detail the information to be collected as regards the constitutive elements and their relationships. 1. TECHNOLOGY WORKBOOK 2. PLAYERS INFORMATIONS 3. CONNECTION MATRIX 2 ECOSYSTEM MODEL REPRESENTATION  Develop a representation model 4. ECOSYSTEM REPRESENTATION MODEL 3 DATA VALIDATION  Obtain criteria to validate the model 5. ECOSYSTEM REPRESENTATION MODEL VALIDATED 4 ECOSYSTEM ANALYSIS  Evaluation of the ecosystem’s behaviours (last, current, future) and relevant key indicators. 6. ECOSYSTEM ANALYSIS • Physical structure • Revenues analysis • Relationship analysis • Attractiveness • Assets and technologies analysis • Control point constellation 5 ECOSYSTEM EVOLUTION  Simulation of different scenarios aimed to perform what- if analysis, trend analysis, classification, forecasts. 7. ECOSYSTEM SCENARIOS ANALYSIS • possible scenarios November 24h 2014, Paris DATA conference 29
  • 29.
    ECOSYSTEM VALUE ANALYSIS– EXAMPLE OF ECONOMIC STRUCTURE Cameraphone manuf. Vendite (unità) Ricavi EBITDA Inv. F.c.f. Nokia 58 9,59 (-)4.600 8.200 Samsung 24,3 10,8 (-)180 300 Motorola 10,2 (-)1,23 794 252 LG Electronics 13,1 1,7 (-)738 Sony Ericsson 56,4 10 1.200 HTC 3,2 (-)124 (-)260 Apple 20,7 6,7 8,69 (-)17.000 8.950 RIM 13,2 3,5 (-)1.820 (-)349 MANUFACTURERS market share 22% 28% 44% 6% Camera&camcorders manuf. Storage manuf. Printers manuf. Cameraphone manuf. Smartphone market share Q3 '09 39% 3%7%17% 21% 13% Nokia Samsung HTC Apple Altri RIM ...physical structure... ...economic dimension... November 24h 2014, Paris DATA conference 30
  • 30.
    ECOSYSTEM VALUE ANALYSIS– EXAMPLE OF RELATIONSHIP STRUCTURE November 24h 2014, Paris DATA conference 31 Figure shows the relationship structure of tangible relationships. The low values of density and centralization mean a high dispersion of the money fluxes in the ecosystem and low values in the relationship structure of intangible relationships show that a attractor role with all the knowledge and the information does not exist in this ecosystem
  • 31.
    MOBENA: SYNTHESIS 1 ECOSYSTEM PERIMETER,ELEMENTS AND RELATIONSHIPS  Define the meaning of the ecosystem, decide what identifies it and identify what defines its boundaries.  Detail the information to be collected as regards the constitutive elements and their relationships. 1. TECHNOLOGY WORKBOOK 2. PLAYERS INFORMATIONS 3. CONNECTION MATRIX 2 ECOSYSTEM MODEL REPRESENTATION  Develop a representation model 4. ECOSYSTEM REPRESENTATION MODEL 3 DATA VALIDATION  Obtain criteria to validate the model 5. ECOSYSTEM REPRESENTATION MODEL VALIDATED 4 ECOSYSTEM ANALYSIS  Evaluation of the ecosystem’s behaviours (last, current, future) and relevant key indicators. 6. ECOSYSTEM ANALYSIS • Physical structure • Revenues analysis • Relationship analysis • Attractivity • Assets and technologies analysis • Control point constellation 5 ECOSYSTEM EVOLUTION  Simulation of different scenarios aimed to perform what- if analysis, trend analysis, classification, forecasts. 7. ECOSYSTEM SCENARIOS ANALYSIS • possible scenarios November 24h 2014, Paris DATA conference 32
  • 32.
    ECOSYSTEM CONTROL POINTANALYSIS CREATION Photos/digital videocameras Smartphones Wireless connection Connection On Line Storage Photoalbum On Line Printing Social Network SERVICES 1° level of connection INTERNET CONNECTION Wired Wireless November 24h 2014, Paris DATA conference 33 2° level of connection Smartphones and mobile applications PC STORAGE/ MODIFICATION The control point analysis identified the PC and the smartphones and mobile applications as control points of the digital imaging ecosystem. They connect and control the ecosystem in two levels: between creation and storage/modification and between storage/modification and services (online printing and online storage).
  • 33.
    MOBENA: SYNTHESIS 1 ECOSYSTEM PERIMETER,ELEMENTS AND RELATIONSHIPS  Define the meaning of the ecosystem, decide what identifies it and identify what defines its boundaries.  Detail the information to be collected as regards the constitutive elements and their relationships. 1. TECHNOLOGY WORKBOOK 2. PLAYERS INFORMATIONS 3. CONNECTION MATRIX 2 ECOSYSTEM MODEL REPRESENTATION  Develop a representation model 4. ECOSYSTEM REPRESENTATION MODEL 3 DATA VALIDATION  Obtain criteria to validate the model 5. ECOSYSTEM REPRESENTATION MODEL VALIDATED 4 ECOSYSTEM ANALYSIS  Evaluation of the ecosystem’s behaviours (last, current, future) and relevant key indicators. 6. ECOSYSTEM ANALYSIS • Physical structure • Revenues analysis • Relationship analysis • Attractiveness • Assets and technologies analysis • Control point constellation 5 ECOSYSTEM EVOLUTION  Simulation of different scenarios aimed to perform what- if analysis, trend analysis, classification, forecasts. 7. ECOSYSTEM SCENARIOS ANALYSIS • possible scenarios November 24h 2014, Paris DATA conference 34
  • 34.
    TRENDS AFFECTING THEECOSYSTEM Memory capacity increment Diminution of the price for GB Fonte: www.letsgodigital.org Fonte: http://www.researchinchina.com/report/Electronics/3390.html November 24h 2014, Paris DATA conference 35
  • 35.
    UNCERTAINTIES There are twomain uncertainties (service ubiquity and information sources)  identify four main scenarios (Real Time Sharing, Image Recognition, Mobile Augmented Reality, On line backup & Sharing). November 24h 2014, Paris DATA conference 36
  • 36.
    A NEAR SCENARIO(IN 2008): THE AUGMENTED REALITY November 24h 2014, Paris DATA conference 37
  • 37.
    • Introduction • Theoreticalbackground • Research strategy • Proposal of a methodology for business ecosystem analysis • Field study • Discussion and conclusions Agenda November 24h 2014, Paris 38DATA conference
  • 38.
    CONCLUSIONS As businesses becomemore and more modularized, characterizing entity relationships and understanding how business decisions or actions taken by one entity impact all of the interrelated entities, both within and among enterprises, become a key challenge. Ignoring these interactions can lead to unexpected and potentially undesirable outcomes. Tools that help to systematically characterize the business ecosystem (or network) and analyze the potential impact of different business decisions on each entity in the network are essential for improving business design. The knowledge of a phenomenon is the basis of its evolution. The methodology of business ecosystem network analysis (MOBENA) is a first step to build a tool that can facilitate the knowledge about the business ecosystems, with a first improvement toward the standardization of the procedure for different contexts and the reusability of data and information. November 24h 2014, Paris DATA conference 39
  • 39.
    DATA, DIGITAL BUSINESSMODELS, CLOUD COMPUTING AND ORGANIZATIONAL DESIGN Université Paris –Sud, Faculté Jean-Monnet, Sceaux, Paris, 24-25 November 2014 Cinzia Battistella MODELLING A BUSINESS ECOSYSTEM: A NETWORK ANALYSIS APPROACH University of Bolzano, Italy From a work with Colucci, De Toni and Nonino Ref: Methodology of business ecosystem network analysis, Technological Forecasting and Social Change 80 (2013) 1194-1210

Editor's Notes

  • #4 Un ecosistema di business è una complessa struttura relazionale ad elevato grado di dipendenza reciproca, in cui gli attori sono le imprese. Il coordinamento e la collaborazione sono finalizzati ad un unico obiettivo: la creazione e la ripartizione del valore tra tutti i componenti della rete. “An economic community supported by a foundation of interacting organizations and individuals - the organisms of the business world. This economic community produces goods and services of value to customers, who are themselves members of the ecosystem. The member organizations also include suppliers, lead producers, competitors, and other stakeholders. Over time, they co-evolve their capabilities and roles, and tend to align themselves with the directions set by one or more central companies. Those companies holding leadership roles may change over time, but the function of ecosystem leader is valued by the community because it enables members to move toward shared visions to align their investments and to find mutually supportive roles.” Moore, 1993
  • #5 Today’s dynamic and complex environment requires a higher level, network view of inter-organizational exchanges at both the conceptual and practical level. The Value Chain and the Value Network models (Porter, 1985; Allee, 2002) are concepts focused on the value creation process of the firm, instead the Business Ecosystem (Moore, 1993; Iansiti and Levien, 2004) concept is useful to understand complex inter-firms relationships which form the background of the value creation process. In fact, the success of a business ecosystem lies in the combination of efforts from business, government, education, and all segments of the community. The cultural and two-sided interactions between actors of a community sharing the same values and especially the same interests have the implicit objective of long-term sustainability of the whole community. While value chains are based on volatile supplier/buyer relationships, the business ecosystems are based on a network of multi-directional relationships with firms with shared values and interests. The relationships are both monetary and not monetary, and the winners are those actors who can leverage network externalities. Whereas value chains are essentially defined by the accumulated value generated by monetary relationships, business ecosystems are also defined by the non-monetary advantages derived by firms participating in them. Therefore, a business ecosystems growth depends also on the quality of the non-monetary, qualitative interactions between stakeholders. These interactions create something intangible that is shared by all participants, the social capital (see Durlauf and Fafchamps, 2004). Networks, common norms, shared values and trust, comparable expectations, brought forth in cooperation and business relationships, create a web of social relations that have productive benefits by facilitating coordinated actions. While value chains create value, business ecosystems generate value and social capital, resulting in a long-term and sustainable relationships.
  • #6 If a company would like to know the complex dynamics intercepting it and/or if it would like to enter and act in an ecosystem, it has to rely on a deep knowledge and analysis of the ecosystem itself. It is a matter of identifying and describing the ecosystem components, the relationships between them and the balance of power that guarantees their existence. All these elements together define the shape and behaviour pattern: how the ecosystem “lives”. Moreover, also the time variable is fundamental: the relationships between the constituent elements may change the ecosystem structure. So, understanding the ecosystem means not only drawing the shape and relationships among the constituent elements in a certain moment in time, but understanding how it can evolve by monitoring the evolutionary trends with all the variables involved. It is thus important that companies establish monitoring processes for their ecosystem from a static and dynamic point of view, and that they analyse business ecosystems and investigate how it can potentially impact their businesses. Clearly, these analyzes need to be supported by appropriate tools and methodologies to work on. But, despite the importance of the practical application of the business ecosystem concept as a representation of the real situation, literature on methodologies for business ecosystems is still in its infancy, while the majority of the contributions are focused on the discussion of business ecosystems per se (i.e. comparisons between natural ecosystems and business ecosystems, differences between value chain and business ecosystem, business ecosystems properties, their strategies, etc.). The scope of this paper is the analysis of the business ecosystems, as reticular structures interacting one with each other. The aim is to propose a methodology for analyzing and modeling the ecosystems and to illustrate its application in a field study conducted inside the Telecom Italia Future Centre. The methodology is called methodology of business ecosystem network analysis (MOBENA).
  • #8 Various approaches have been proposed to create a modeling language for firm interactions. In the view of Value Network, different modelling approaches have been proposed, as the e3-value model (Gordijn et al., 2000), the c3-value (Weigand et al., 2007) and the value network’s model of intangibles (Allee, 2002). In the view of business ecosystems analysis, we found some first works all based on agent-based modeling, such as the Business Ecosystem Analysis Methodology (BEAM - Tian et al., 2009). The following table (Table 1) shows a synthetic description of such methodologies, their main characteristics and compares them to our methodology. The methodologies for business ecosystems are very few. The main problems that we highlighted are that these methodologies are strongly interconnected to an agent-based modeling, therefore they over-simplify the problem. Moreover, they limit potential for strategic analysis.
  • #10 Despite the importance of the practical application of the business ecosystem concept as a representation of the real situation, literature on methodologies for business ecosystems is still in its infancy, while the majority of the contributions are focused on the discussion of business ecosystems per se (i.e. comparisons between natural ecosystems and business ecosystems, differences between value chain and business ecosystem, business ecosystems properties, their strategies, etc.). The scope of this paper is the analysis of the business ecosystems, as reticular structures interacting one with each other. The aim is to propose a methodology for analyzing and modeling the ecosystems and to illustrate its application in a field study conducted inside the Telecom Italia Future Centre. The methodology is called methodology of business ecosystem network analysis (MOBENA).
  • #11 The present work is meant to help widen the knowledge basis on management of ecosystems and proposes a methodology based on network analysis and foresight. This paper attempts to answer to the following research questions: How is it possible to systematically study the structure and fluxes of a business ecosystem? Increasingly, the technological innovations headed by ICT and TLC go beyond the value chain where they have been originated to attract the interest of other value chains which are so far remote, with different actors, interests and market objectives. Therefore actors interact now in a business ecosystem. In this new context, previous business models can change and latent or even not existing markets (and consequent business models) can emerge. That is why we decided to focus our research on the TLC industry. Moreover, we took an exemplar case: the most important TLC company in Italy, Telecom Italia (and in particular its unit focused on economical studies and investigation of the future, the Telecom Italia Future Centre). Among the ecosystems studied by the Future Centre, we chose to focus on the digital imaging ecosystem. The research methodology includes an analysis of literature on Strategic Management, Network Analysis and Foresight, from whence the theoretical proposal of the methodology of business ecosystem network analysis (MOBENA) was born. The case study design is opportune for presenting a relevant overview of the importance and applicability of the methodology (Eisenhardt, 1989; McCutcheon and Meredith, 1993; Meredith, 1998). The object of the case study is the test of the proposed methodology of business ecosystem network analysis. As described by Yin (2003), the case study research design can be used to describe an intervention and its context. Some authors refer to this as a “field experiment”. In the test in this study, the intervention is the application of the proposed methodology, and the context is the company studied and in particular one of its ecosystems (the digital image ecosystem).
  • #12 The present work is meant to help widen the knowledge basis on management of ecosystems and proposes a methodology based on network analysis and foresight. This paper attempts to answer to the following research questions: How is it possible to systematically study the structure and fluxes of a business ecosystem? Increasingly, the technological innovations headed by ICT and TLC go beyond the value chain where they have been originated to attract the interest of other value chains which are so far remote, with different actors, interests and market objectives. Therefore actors interact now in a business ecosystem. In this new context, previous business models can change and latent or even not existing markets (and consequent business models) can emerge. That is why we decided to focus our research on the TLC industry. Moreover, we took an exemplar case: the most important TLC company in Italy, Telecom Italia (and in particular its unit focused on economical studies and investigation of the future, the Telecom Italia Future Centre). Among the ecosystems studied by the Future Centre, we chose to focus on the digital imaging ecosystem. The research methodology includes an analysis of literature on Strategic Management, Network Analysis and Foresight, from whence the theoretical proposal of the methodology of business ecosystem network analysis (MOBENA) was born. The case study design is opportune for presenting a relevant overview of the importance and applicability of the methodology (Eisenhardt, 1989; McCutcheon and Meredith, 1993; Meredith, 1998). The object of the case study is the test of the proposed methodology of business ecosystem network analysis. As described by Yin (2003), the case study research design can be used to describe an intervention and its context. Some authors refer to this as a “field experiment”. In the test in this study, the intervention is the application of the proposed methodology, and the context is the company studied and in particular one of its ecosystems (the digital image ecosystem).
  • #14 The methodology aims to provide a theoretical and operational framework for analyzing the business ecosystems. It is designed to support the identification and understanding of the business ecosystems by providing the criteria to define its structure and analyze and evaluate the relevant behaviour. The methodology is based on five steps
  • #22 The objective of this first step is to identify the perimeter and constituent parts of the ecosystem. In the digital imaging ecosystem, the seed is the service, based on the psychology of the “management of the memories” and the “digital translation” of the reality, that permit new possibilities and functionalities for the personal sphere of the individual.
  • #25 The objective of this first step is to identify the perimeter and constituent parts of the ecosystem. In the digital imaging ecosystem, the seed is the service, based on the psychology of the “management of the memories” and the “digital translation” of the reality, that permit new possibilities and functionalities for the personal sphere of the individual. Another important point for the decision about the borders of the object of observation are the constitutive elements of the ecosystem and the relationships among them. For the digital imaging ecosystem, the team preliminarily identified two macro-classes of actors in the ecosystem and for each one listed the component actors and the main players: Manufacturers: class of actors connected to the consumer-electronics production, in other words the hardware part of the ecosystem; they are typically constrained to obtain cost-efficiency through scale-economies and realize high production-volumes. They are: camera and camcorders manufacturers, storage manufacturers, printers manufacturers, cameraphone manufacturers Service Providers: their offer is connected to services and not-tangible functionalities for users. They are: on line storage providers; photoalbum providers; social network providers; on-line printing providers; mobile applications providers; software vendors providers; telco operators providers; retailers providers As regards the enabling technologies of the Digital Imaging Ecosystem, we identified these categories: Computational photography, Sensors resolution and quality, Still/motion convergence, Barcode / QR Code, RFID / NFC, GPS, Wireless / Mobile, Metadata Exif, 3D, Digital pictures and video playback. The next step is the construction of the Connections Matrix which has the purpose to highlight the links between the constituent parts of the ecosystem. The connection matrix of the Digital Imaging Ecosystem is in Table 3.
  • #29 The objective of this first step is to identify the perimeter and constituent parts of the ecosystem. In the digital imaging ecosystem, the seed is the service, based on the psychology of the “management of the memories” and the “digital translation” of the reality, that permit new possibilities and functionalities for the personal sphere of the individual. Another important point for the decision about the borders of the object of observation are the constitutive elements of the ecosystem and the relationships among them. For the digital imaging ecosystem, the team preliminarily identified two macro-classes of actors in the ecosystem and for each one listed the component actors and the main players: Manufacturers: class of actors connected to the consumer-electronics production, in other words the hardware part of the ecosystem; they are typically constrained to obtain cost-efficiency through scale-economies and realize high production-volumes. They are: camera and camcorders manufacturers, storage manufacturers, printers manufacturers, cameraphone manufacturers Service Providers: their offer is connected to services and not-tangible functionalities for users. They are: on line storage providers; photoalbum providers; social network providers; on-line printing providers; mobile applications providers; software vendors providers; telco operators providers; retailers providers As regards the enabling technologies of the Digital Imaging Ecosystem, we identified these categories: Computational photography, Sensors resolution and quality, Still/motion convergence, Barcode / QR Code, RFID / NFC, GPS, Wireless / Mobile, Metadata Exif, 3D, Digital pictures and video playback. The next step is the construction of the Connections Matrix which has the purpose to highlight the links between the constituent parts of the ecosystem. The connection matrix of the Digital Imaging Ecosystem is in Table 3.
  • #40 As businesses become more and more modularized, characterizing entity relationships and understanding how business decisions or actions taken by one entity impact all of the interrelated entities, both within and among enterprises, become a key challenge. Ignoring these interactions can lead to unexpected and potentially undesirable outcomes. Tools that help to systematically characterize the business ecosystem (or network) and analyze the potential impact of different business decisions on each entity in the network are essential for improving business design. The knowledge of a phenomenon is the basis of its evolution. The methodology of business ecosystem network analysis (MOBENA) is a first step to build a tool that can facilitate the knowledge about the business ecosystems, with a first improvement toward the standardization of the procedure for different contexts and the reusability of data and information.