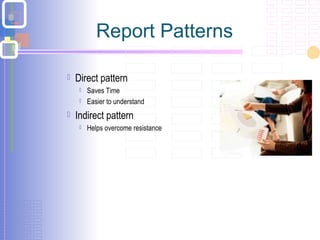
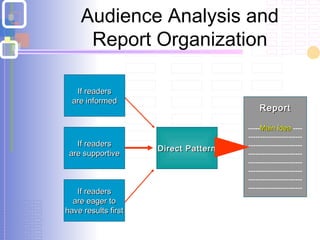
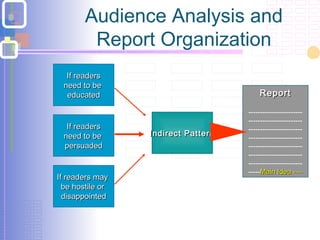
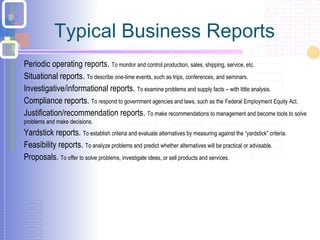
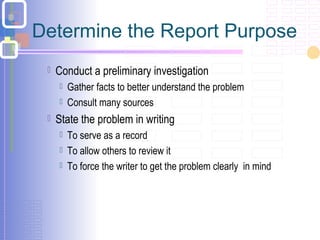
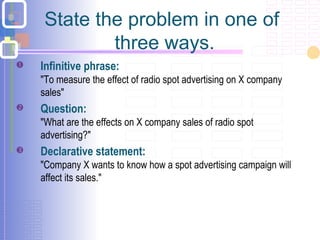
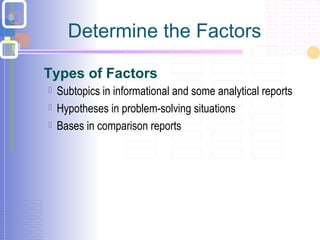
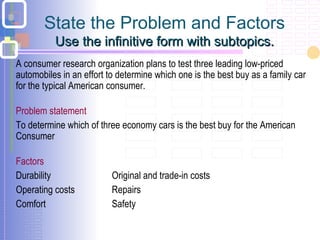
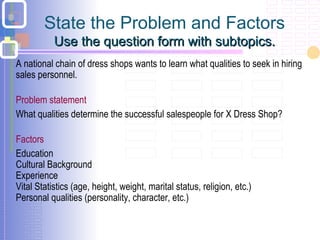
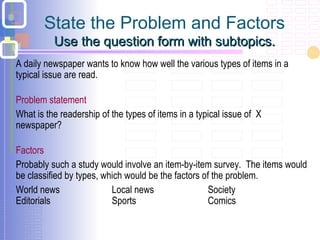
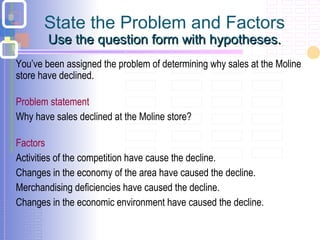
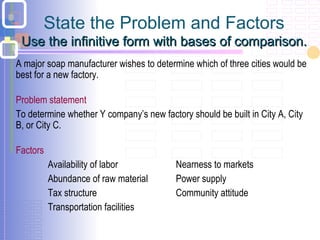
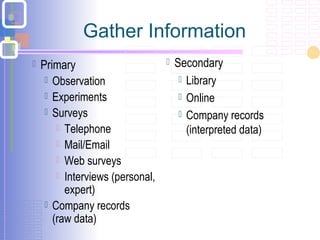
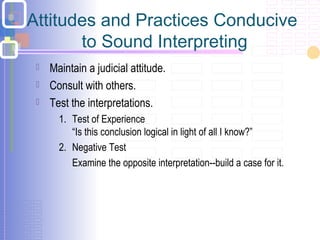
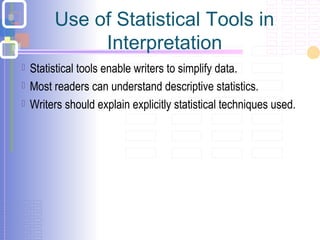
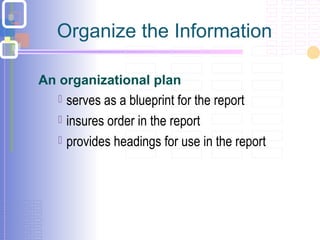
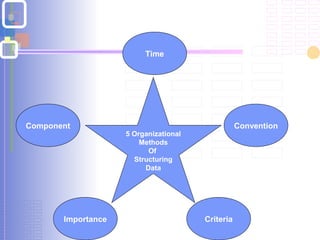
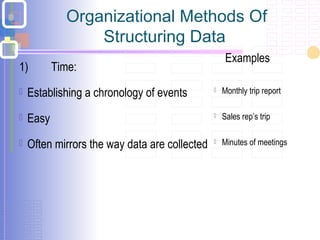
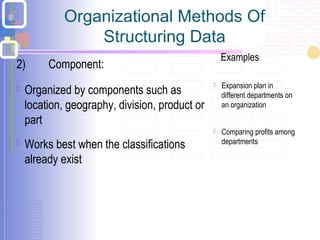
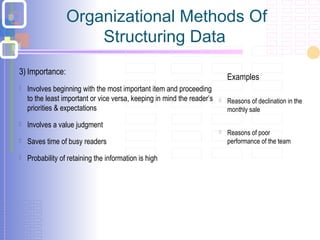
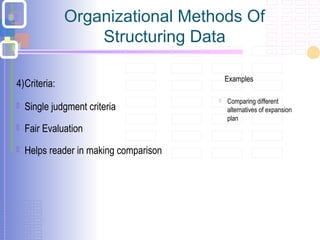
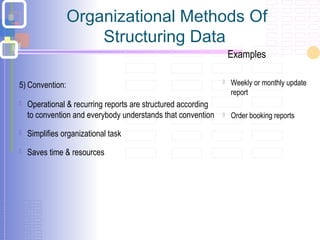
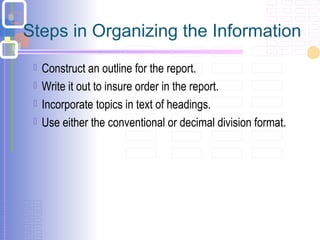
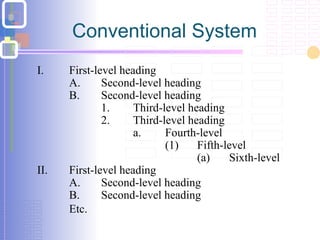
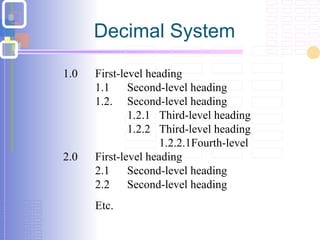
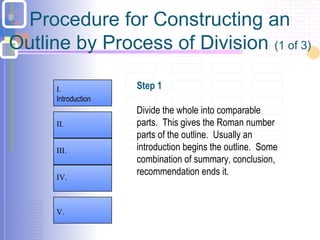
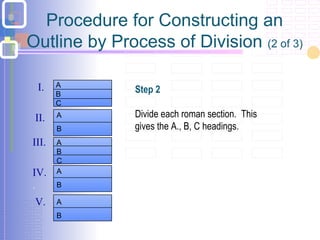
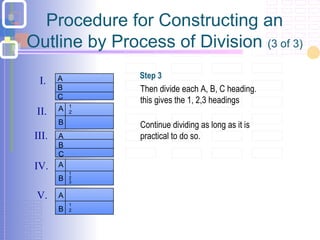
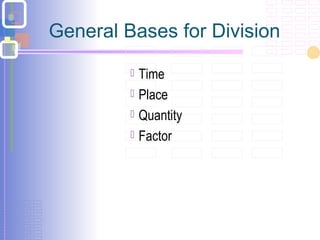
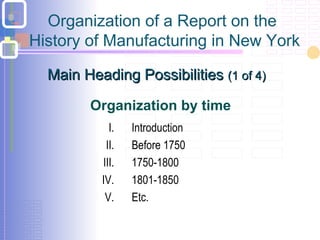
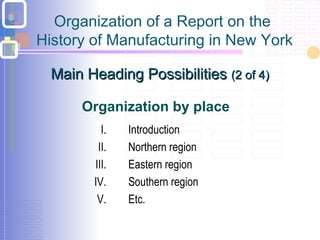
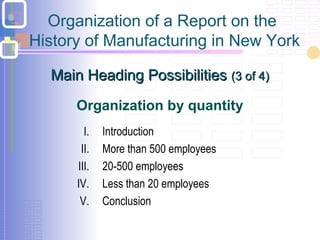
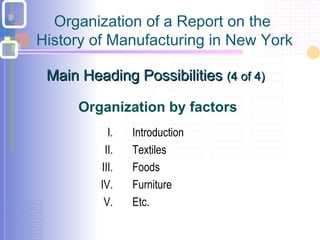
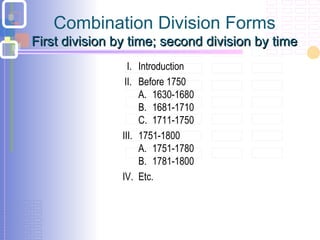
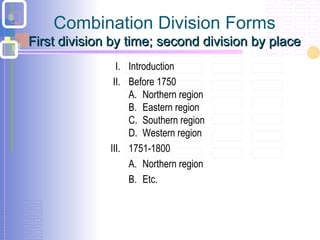
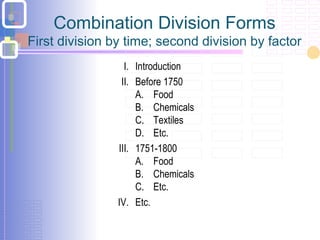
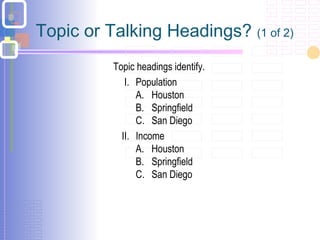
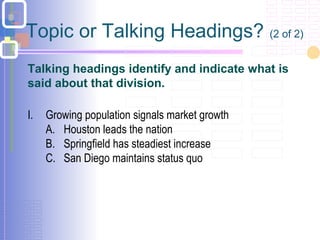
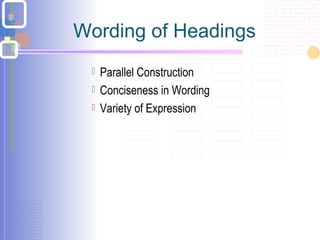
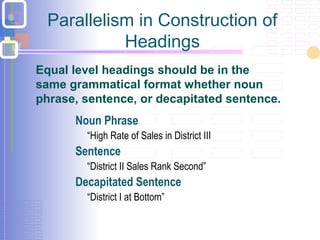
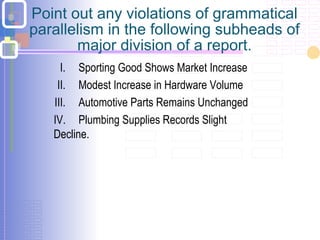
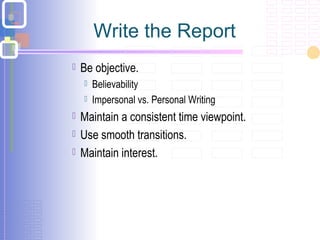
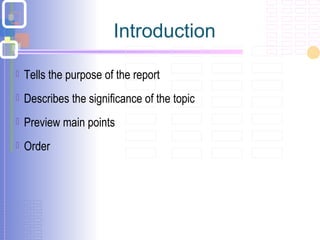
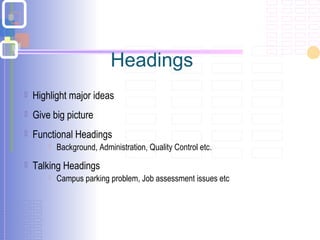
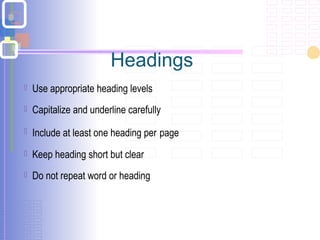
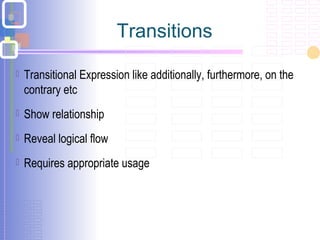
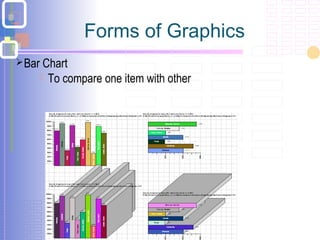
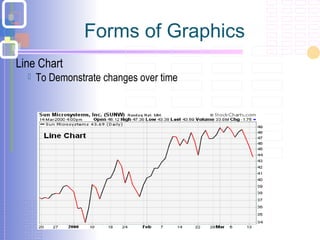
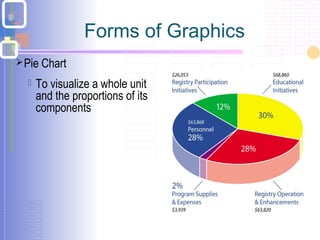
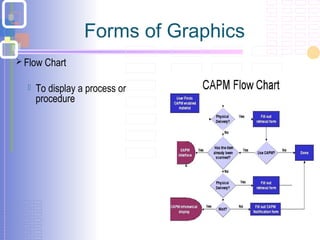
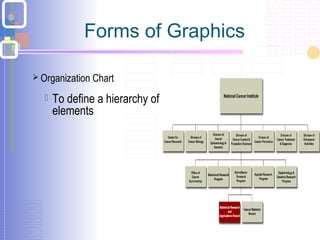
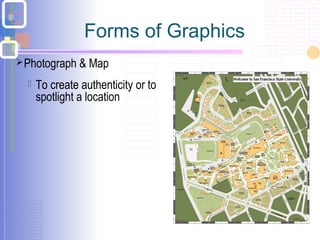
Basics of Report Writing
part 2
Session 11-12
Report Patterns
Report Patterns
 Direct pattern
 Saves Time
 Easier to understand
 Indirect pattern
 Helps overcome resistance
Audience Analysis and
Report Organization
Direct PatternDirect Pattern
ReportReport
-----Main IdeaMain Idea ----
-----------------------
-----------------------
-----------------------
-----------------------
-----------------------
-----------------------
-----------------------
If readersIf readers
are informedare informed
If readersIf readers
are supportiveare supportive
If readersIf readers
are eager toare eager to
have results firsthave results first
Audience Analysis and
Report Organization
ReportReport
-----------------------
-----------------------
-----------------------
-----------------------
-----------------------
-----------------------
-----------------------
-----Main Idea ----Main Idea ----
Indirect PatternIndirect Pattern
If readersIf readers
need to beneed to be
educatededucated
If readersIf readers
need to beneed to be
persuadedpersuaded
If readers mayIf readers may
be hostile orbe hostile or
disappointeddisappointed
Typical Business Reports
Periodic operating reports. To monitor and control production, sales, shipping, service, etc.
Situational reports. To describe one-time events, such as trips, conferences, and seminars.
Investigative/informational reports. To examine problems and supply facts – with little analysis.
Compliance reports. To respond to government agencies and laws, such as the Federal Employment Equity Act.
Justification/recommendation reports. To make recommendations to management and become tools to solve
problems and make decisions.
Yardstick reports. To establish criteria and evaluate alternatives by measuring against the “yardstick” criteria.
Feasibility reports. To analyze problems and predict whether alternatives will be practical or advisable.
Proposals. To offer to solve problems, investigate ideas, or sell products and services.
Determine the Report Purpose
 Conduct a preliminary investigation
 Gather facts to better understand the problem
 Consult many sources
 State the problem in writing
 To serve as a record
 To allow others to review it
 To force the writer to get the problem clearly in mind
State the problem in one of
three ways.
 Infinitive phrase:
"To measure the effect of radio spot advertising on X company
sales"
 Question:
"What are the effects on X company sales of radio spot
advertising?"
 Declarative statement:
"Company X wants to know how a spot advertising campaign will
affect its sales."
Types of Factors
Determine the Factors
 Subtopics in informational and some analytical reports
 Hypotheses in problem-solving situations
 Bases in comparison reports
State the Problem and Factors
Use the infinitive form with subtopics.Use the infinitive form with subtopics.
A consumer research organization plans to test three leading low-priced
automobiles in an effort to determine which one is the best buy as a family car
for the typical American consumer.
Problem statement
To determine which of three economy cars is the best buy for the American
Consumer
Factors
Durability Original and trade-in costs
Operating costs Repairs
Comfort Safety
State the Problem and Factors
Use the question form with subtopics.Use the question form with subtopics.
A national chain of dress shops wants to learn what qualities to seek in hiring
sales personnel.
Problem statement
What qualities determine the successful salespeople for X Dress Shop?
Factors
Education
Cultural Background
Experience
Vital Statistics (age, height, weight, marital status, religion, etc.)
Personal qualities (personality, character, etc.)
State the Problem and Factors
Use the question form with subtopics.Use the question form with subtopics.
A daily newspaper wants to know how well the various types of items in a
typical issue are read.
Problem statement
What is the readership of the types of items in a typical issue of X
newspaper?
Factors
Probably such a study would involve an item-by-item survey. The items would
be classified by types, which would be the factors of the problem.
World news Local news Society
Editorials Sports Comics
State the Problem and Factors
Use the question form with hypotheses.Use the question form with hypotheses.
You’ve been assigned the problem of determining why sales at the Moline
store have declined.
Problem statement
Why have sales declined at the Moline store?
Factors
Activities of the competition have cause the decline.
Changes in the economy of the area have caused the decline.
Merchandising deficiencies have caused the decline.
Changes in the economic environment have caused the decline.
State the Problem and Factors
Use the infinitive form with bases of comparison.Use the infinitive form with bases of comparison.
A major soap manufacturer wishes to determine which of three cities would be
best for a new factory.
Problem statement
To determine whether Y company’s new factory should be built in City A, City
B, or City C.
Factors
Availability of labor Nearness to markets
Abundance of raw material Power supply
Tax structure Community attitude
Transportation facilities
Gather Information
 Primary
 Observation
 Experiments
 Surveys
 Telephone
 Mail/Email
 Web surveys
 Interviews (personal,
expert)
 Company records
(raw data)
 Secondary
 Library
 Online
 Company records
(interpreted data)
Attitudes and Practices Conducive
to Sound Interpreting
 Maintain a judicial attitude.
 Consult with others.
 Test the interpretations.
1. Test of Experience
“Is this conclusion logical in light of all I know?”
2. Negative Test
 Examine the opposite interpretation--build a case for it.
Use of Statistical Tools in
Interpretation
 Statistical tools enable writers to simplify data.
 Most readers can understand descriptive statistics.
 Writers should explain explicitly statistical techniques used.
An organizational plan
Organize the Information
 serves as a blueprint for the report
 insures order in the report
 provides headings for use in the report
5 Organizational
Methods
Of
Structuring
Data
Component
Time
Convention
CriteriaImportance
Organizational Methods Of
Structuring Data
1) Time:
 Establishing a chronology of events
 Easy
 Often mirrors the way data are collected
Examples
 Monthly trip report
 Sales rep’s trip
 Minutes of meetings
Organizational Methods Of
Structuring Data
2) Component:
 Organized by components such as
location, geography, division, product or
part
 Works best when the classifications
already exist
Examples
 Expansion plan in
different departments on
an organization
 Comparing profits among
departments
Organizational Methods Of
Structuring Data
3) Importance:
 Involves beginning with the most important item and proceeding
to the least important or vice versa, keeping in mind the reader’s
priorities & expectations
 Involves a value judgment
 Saves time of busy readers
 Probability of retaining the information is high
Examples
 Reasons of declination in the
monthly sale
 Reasons of poor
performance of the team
Organizational Methods Of
Structuring Data
4)Criteria:
 Single judgment criteria
 Fair Evaluation
 Helps reader in making comparison
Examples
 Comparing different
alternatives of expansion
plan
Organizational Methods Of
Structuring Data
5) Convention:
 Operational & recurring reports are structured according
to convention and everybody understands that convention
 Simplifies organizational task
 Saves time & resources
Examples
 Weekly or monthly update
report
 Order booking reports
Steps in Organizing the Information
 Construct an outline for the report.
 Write it out to insure order in the report.
 Incorporate topics in text of headings.
 Use either the conventional or decimal division format.
I. First-level heading
A. Second-level heading
B. Second-level heading
1. Third-level heading
2. Third-level heading
a. Fourth-level
(1) Fifth-level
(a) Sixth-level
II. First-level heading
A. Second-level heading
B. Second-level heading
Etc.
Conventional System
1.0 First-level heading
1.1 Second-level heading
1.2. Second-level heading
1.2.1 Third-level heading
1.2.2 Third-level heading
1.2.2.1Fourth-level
2.0 First-level heading
2.1 Second-level heading
2.2 Second-level heading
Etc.
Decimal System
Procedure for Constructing an
Outline by Process of Division (1 of 3)
Step 1
Divide the whole into comparable
parts. This gives the Roman number
parts of the outline. Usually an
introduction begins the outline. Some
combination of summary, conclusion,
recommendation ends it.
I.
Introduction
II.
III.
IV.
V.
Procedure for Constructing an
Outline by Process of Division (2 of 3)
Step 2
Divide each roman section. This
gives the A., B, C headings.
.
I.
II.
III.
IV.
V.
A
B
A
B
C
A
B
C
A
B
A
B
Step 3
Then divide each A, B, C heading.
this gives the 1, 2,3 headings
Continue dividing as long as it is
practical to do so.
Procedure for Constructing an
Outline by Process of Division (3 of 3)
I.
II.
III.
IV.
V.
A
B
A
B
C
A
B
C
A
B
A
B
1
2
1
2
3
1
2
General Bases for Division
 Time
 Place
 Quantity
 Factor
Organization by time
Organization of a Report on the
History of Manufacturing in New York
I. Introduction
II. Before 1750
III. 1750-1800
IV. 1801-1850
V. Etc.
Main Heading PossibilitiesMain Heading Possibilities (1 of 4)(1 of 4)
Organization of a Report on the
History of Manufacturing in New York
I. Introduction
II. Northern region
III. Eastern region
IV. Southern region
V. Etc.
Organization by place
Main Heading PossibilitiesMain Heading Possibilities (2 of 4)(2 of 4)
Organization by quantity
I. Introduction
II. More than 500 employees
III. 20-500 employees
IV. Less than 20 employees
V. Conclusion
Organization of a Report on the
History of Manufacturing in New York
Main Heading PossibilitiesMain Heading Possibilities (3 of 4)(3 of 4)
Organization of a Report on the
History of Manufacturing in New York
I. Introduction
II. Textiles
III. Foods
IV. Furniture
V. Etc.
Organization by factors
Main Heading PossibilitiesMain Heading Possibilities (4 of 4)(4 of 4)
Combination Division Forms
First division by time; second division by timeFirst division by time; second division by time
I. Introduction
II. Before 1750
A. 1630-1680
B. 1681-1710
C. 1711-1750
III. 1751-1800
A. 1751-1780
B. 1781-1800
IV. Etc.
Combination Division Forms
First division by time; second division by placeFirst division by time; second division by place
I. Introduction
II. Before 1750
A. Northern region
B. Eastern region
C. Southern region
D. Western region
III. 1751-1800
A. Northern region
B. Etc.
Combination Division Forms
First division by time; second division by factor
I. Introduction
II. Before 1750
A. Food
B. Chemicals
C. Textiles
D. Etc.
III. 1751-1800
A. Food
B. Chemicals
C. Etc.
IV. Etc.
Topic or Talking Headings? (1 of 2)
Topic headings identify.
I. Population
A. Houston
B. Springfield
C. San Diego
II. Income
A. Houston
B. Springfield
C. San Diego
Topic or Talking Headings? (2 of 2)
Talking headings identify and indicate what is
said about that division.
I. Growing population signals market growth
A. Houston leads the nation
B. Springfield has steadiest increase
C. San Diego maintains status quo
Wording of Headings
 Parallel Construction
 Conciseness in Wording
 Variety of Expression
Parallelism in Construction of
Headings
 Noun Phrase
 “High Rate of Sales in District III
 Sentence
 “District II Sales Rank Second”
 Decapitated Sentence
 “District I at Bottom”
Equal level headings should be in the
same grammatical format whether noun
phrase, sentence, or decapitated sentence.
Point out any violations of grammatical
parallelism in the following subheads of
major division of a report.
I. Sporting Good Shows Market Increase
II. Modest Increase in Hardware Volume
III. Automotive Parts Remains Unchanged
IV. Plumbing Supplies Records Slight
Decline.
Point out any violations of grammatical
parallelism in the following subheads of
major division of a report.
A. Predominance of Cotton Farming in Southern Region
B. Livestock Paces Farm Income in the Western Region
C. Wheat Crop Dominant in the Northern Region
D. Truck Farming Leads in Central and Eastern Regions
Conciseness in Wording
Not this:
Personal appearance enhancement is the most desirable
benefit of lasik surgery that patients report.
But this:
Personal appearance most desirable benefit.
Headings should be the shortest possible
word arrangement.
Variety of Expression
Not this:
A. Illinois Computer Sales
B. New York Computer Sales
C. Washington Computer Sales
But this:
A. Illinois Ranks First in Industry Sales
B. New York Maintains Second Position
C. Washington Posts Third Slot
Replace monotonous repetitions of words
in topic headings with a variety of words.
Write the Report
 Be objective.
 Believability
 Impersonal vs. Personal Writing
 Maintain a consistent time viewpoint.
 Use smooth transitions.
 Maintain interest.
Write the Report
 Be objective.
 Believability
 Impersonal vs. Personal Writing
 Maintain a consistent time viewpoint.
 Use smooth transitions.
 Maintain interest.
Introduction
 Tells the purpose of the report
 Describes the significance of the topic
 Preview main points
 Order
Headings
 Highlight major ideas
 Give big picture
 Functional Headings
 Background, Administration, Quality Control etc.
 Talking Headings
 Campus parking problem, Job assessment issues etc
Headings
 Use appropriate heading levels
 Capitalize and underline carefully
 Include at least one heading per page
 Keep heading short but clear
 Do not repeat word or heading
Transitions
 Transitional Expression like additionally, furthermore, on the
contrary etc
 Show relationship
 Reveal logical flow
 Requires appropriate usage
Illustrating With Graphics
Why Graphics?
 Easy to understand
Easy to remember
Make numerical data meaningful
Simplify complex idea
Provide summarized information
Visual interest
Protects audience from getting bored
Three important functions
of Graphics
Clarify data
Condense and simplify data
Emphasize data
A Dilemma
 Same data can be shown in many different forms, Like:
 A table
 A graph – Bar Chart, Pie Chart, Line Chart etc.
 A mach between appropriate graphic and your objective
 Decide what data are significant and to be highlighted
 Who is your audience?
Forms of Graphics
Table
 To show exact figures and values
Forms of Graphics
Bar Chart
 To compare one item with other
Forms of Graphics
Line Chart
 To Demonstrate changes over time
Forms of Graphics
Pie Chart
 To visualize a whole unit
and the proportions of its
components
Forms of Graphics
 Flow Chart
 To display a process or
procedure
Forms of Graphics
 Organization Chart
 To define a hierarchy of
elements
Forms of Graphics
Photograph & Map
 To create authenticity or to
spotlight a location
Incorporating Graphics in
Reports
Evaluate the Audience
 Nature of report internal or external
 Evaluate reader, content and schedule
 For internal report 5-6 graphs
 For external report can be more
Incorporating Graphics in
Reports
Be Accurate and Ethical
 Ensure accuracy of figures
 Graphs must not be misleading
 Use appropriate scaling
 Use references in case of external visuals
Introduce Graphic meaningfully
 Place the graphic close to the discussion point
 Use proper reference to every graphics
 Draw the concentration towards the conclusion you derived
 Interpret them for readers
Incorporating Graphics in
Reports
Conclusion
Conclusion of a Report
Most widely read portion of a report which summarizes & explains the findings in a report. Heart
of a report which shows goals, background & frame of reference, all should support the
conclusion you make.
Audience of a report wants:
 How the data in related to the problem being studied?
 What do the findings mean in terms of solving the original report
problem?
Conclusion of a Report -
Functions
 Interpret & summarize the findings
 Don’t manipulate the findings to achieve preconceived purpose
 Always try to be objective & bias free
 Consistent evaluation criteria (same criteria for evaluation…)
 Relate the conclusion to the report problem
Recommendation
Recommendation
 Conclusions explain what the problem is, while the recommendations tell how
to solve it.
 Readers prefer specific & practical recommendations agreeable to them.
 How a suggestion can be implemented
 Authorization is required for specification
 What are you required to do and what does the reader expect?
 Avoid using conditional words such as maybe & perhaps………..
Recommendation
 Try to present the recommendation as a command
 Shows your command on the subject
 When possible, arrange the recommendation in an announced order, such as important
to least important
 Can combine the recommendations & conclusions
 May omit the conclusion in short reports

Basics (Reports Writing 2)

  • 1.
    Basics of ReportWriting part 2 Session 11-12
  • 2.
  • 3.
    Report Patterns  Directpattern  Saves Time  Easier to understand  Indirect pattern  Helps overcome resistance
  • 4.
    Audience Analysis and ReportOrganization Direct PatternDirect Pattern ReportReport -----Main IdeaMain Idea ---- ----------------------- ----------------------- ----------------------- ----------------------- ----------------------- ----------------------- ----------------------- If readersIf readers are informedare informed If readersIf readers are supportiveare supportive If readersIf readers are eager toare eager to have results firsthave results first
  • 5.
    Audience Analysis and ReportOrganization ReportReport ----------------------- ----------------------- ----------------------- ----------------------- ----------------------- ----------------------- ----------------------- -----Main Idea ----Main Idea ---- Indirect PatternIndirect Pattern If readersIf readers need to beneed to be educatededucated If readersIf readers need to beneed to be persuadedpersuaded If readers mayIf readers may be hostile orbe hostile or disappointeddisappointed
  • 6.
    Typical Business Reports Periodicoperating reports. To monitor and control production, sales, shipping, service, etc. Situational reports. To describe one-time events, such as trips, conferences, and seminars. Investigative/informational reports. To examine problems and supply facts – with little analysis. Compliance reports. To respond to government agencies and laws, such as the Federal Employment Equity Act. Justification/recommendation reports. To make recommendations to management and become tools to solve problems and make decisions. Yardstick reports. To establish criteria and evaluate alternatives by measuring against the “yardstick” criteria. Feasibility reports. To analyze problems and predict whether alternatives will be practical or advisable. Proposals. To offer to solve problems, investigate ideas, or sell products and services.
  • 7.
    Determine the ReportPurpose  Conduct a preliminary investigation  Gather facts to better understand the problem  Consult many sources  State the problem in writing  To serve as a record  To allow others to review it  To force the writer to get the problem clearly in mind
  • 8.
    State the problemin one of three ways.  Infinitive phrase: "To measure the effect of radio spot advertising on X company sales"  Question: "What are the effects on X company sales of radio spot advertising?"  Declarative statement: "Company X wants to know how a spot advertising campaign will affect its sales."
  • 9.
    Types of Factors Determinethe Factors  Subtopics in informational and some analytical reports  Hypotheses in problem-solving situations  Bases in comparison reports
  • 10.
    State the Problemand Factors Use the infinitive form with subtopics.Use the infinitive form with subtopics. A consumer research organization plans to test three leading low-priced automobiles in an effort to determine which one is the best buy as a family car for the typical American consumer. Problem statement To determine which of three economy cars is the best buy for the American Consumer Factors Durability Original and trade-in costs Operating costs Repairs Comfort Safety
  • 11.
    State the Problemand Factors Use the question form with subtopics.Use the question form with subtopics. A national chain of dress shops wants to learn what qualities to seek in hiring sales personnel. Problem statement What qualities determine the successful salespeople for X Dress Shop? Factors Education Cultural Background Experience Vital Statistics (age, height, weight, marital status, religion, etc.) Personal qualities (personality, character, etc.)
  • 12.
    State the Problemand Factors Use the question form with subtopics.Use the question form with subtopics. A daily newspaper wants to know how well the various types of items in a typical issue are read. Problem statement What is the readership of the types of items in a typical issue of X newspaper? Factors Probably such a study would involve an item-by-item survey. The items would be classified by types, which would be the factors of the problem. World news Local news Society Editorials Sports Comics
  • 13.
    State the Problemand Factors Use the question form with hypotheses.Use the question form with hypotheses. You’ve been assigned the problem of determining why sales at the Moline store have declined. Problem statement Why have sales declined at the Moline store? Factors Activities of the competition have cause the decline. Changes in the economy of the area have caused the decline. Merchandising deficiencies have caused the decline. Changes in the economic environment have caused the decline.
  • 14.
    State the Problemand Factors Use the infinitive form with bases of comparison.Use the infinitive form with bases of comparison. A major soap manufacturer wishes to determine which of three cities would be best for a new factory. Problem statement To determine whether Y company’s new factory should be built in City A, City B, or City C. Factors Availability of labor Nearness to markets Abundance of raw material Power supply Tax structure Community attitude Transportation facilities
  • 15.
    Gather Information  Primary Observation  Experiments  Surveys  Telephone  Mail/Email  Web surveys  Interviews (personal, expert)  Company records (raw data)  Secondary  Library  Online  Company records (interpreted data)
  • 16.
    Attitudes and PracticesConducive to Sound Interpreting  Maintain a judicial attitude.  Consult with others.  Test the interpretations. 1. Test of Experience “Is this conclusion logical in light of all I know?” 2. Negative Test  Examine the opposite interpretation--build a case for it.
  • 17.
    Use of StatisticalTools in Interpretation  Statistical tools enable writers to simplify data.  Most readers can understand descriptive statistics.  Writers should explain explicitly statistical techniques used.
  • 18.
    An organizational plan Organizethe Information  serves as a blueprint for the report  insures order in the report  provides headings for use in the report
  • 19.
  • 20.
    Organizational Methods Of StructuringData 1) Time:  Establishing a chronology of events  Easy  Often mirrors the way data are collected Examples  Monthly trip report  Sales rep’s trip  Minutes of meetings
  • 21.
    Organizational Methods Of StructuringData 2) Component:  Organized by components such as location, geography, division, product or part  Works best when the classifications already exist Examples  Expansion plan in different departments on an organization  Comparing profits among departments
  • 22.
    Organizational Methods Of StructuringData 3) Importance:  Involves beginning with the most important item and proceeding to the least important or vice versa, keeping in mind the reader’s priorities & expectations  Involves a value judgment  Saves time of busy readers  Probability of retaining the information is high Examples  Reasons of declination in the monthly sale  Reasons of poor performance of the team
  • 23.
    Organizational Methods Of StructuringData 4)Criteria:  Single judgment criteria  Fair Evaluation  Helps reader in making comparison Examples  Comparing different alternatives of expansion plan
  • 24.
    Organizational Methods Of StructuringData 5) Convention:  Operational & recurring reports are structured according to convention and everybody understands that convention  Simplifies organizational task  Saves time & resources Examples  Weekly or monthly update report  Order booking reports
  • 25.
    Steps in Organizingthe Information  Construct an outline for the report.  Write it out to insure order in the report.  Incorporate topics in text of headings.  Use either the conventional or decimal division format.
  • 26.
    I. First-level heading A.Second-level heading B. Second-level heading 1. Third-level heading 2. Third-level heading a. Fourth-level (1) Fifth-level (a) Sixth-level II. First-level heading A. Second-level heading B. Second-level heading Etc. Conventional System
  • 27.
    1.0 First-level heading 1.1Second-level heading 1.2. Second-level heading 1.2.1 Third-level heading 1.2.2 Third-level heading 1.2.2.1Fourth-level 2.0 First-level heading 2.1 Second-level heading 2.2 Second-level heading Etc. Decimal System
  • 28.
    Procedure for Constructingan Outline by Process of Division (1 of 3) Step 1 Divide the whole into comparable parts. This gives the Roman number parts of the outline. Usually an introduction begins the outline. Some combination of summary, conclusion, recommendation ends it. I. Introduction II. III. IV. V.
  • 29.
    Procedure for Constructingan Outline by Process of Division (2 of 3) Step 2 Divide each roman section. This gives the A., B, C headings. . I. II. III. IV. V. A B A B C A B C A B A B
  • 30.
    Step 3 Then divideeach A, B, C heading. this gives the 1, 2,3 headings Continue dividing as long as it is practical to do so. Procedure for Constructing an Outline by Process of Division (3 of 3) I. II. III. IV. V. A B A B C A B C A B A B 1 2 1 2 3 1 2
  • 31.
    General Bases forDivision  Time  Place  Quantity  Factor
  • 32.
    Organization by time Organizationof a Report on the History of Manufacturing in New York I. Introduction II. Before 1750 III. 1750-1800 IV. 1801-1850 V. Etc. Main Heading PossibilitiesMain Heading Possibilities (1 of 4)(1 of 4)
  • 33.
    Organization of aReport on the History of Manufacturing in New York I. Introduction II. Northern region III. Eastern region IV. Southern region V. Etc. Organization by place Main Heading PossibilitiesMain Heading Possibilities (2 of 4)(2 of 4)
  • 34.
    Organization by quantity I.Introduction II. More than 500 employees III. 20-500 employees IV. Less than 20 employees V. Conclusion Organization of a Report on the History of Manufacturing in New York Main Heading PossibilitiesMain Heading Possibilities (3 of 4)(3 of 4)
  • 35.
    Organization of aReport on the History of Manufacturing in New York I. Introduction II. Textiles III. Foods IV. Furniture V. Etc. Organization by factors Main Heading PossibilitiesMain Heading Possibilities (4 of 4)(4 of 4)
  • 36.
    Combination Division Forms Firstdivision by time; second division by timeFirst division by time; second division by time I. Introduction II. Before 1750 A. 1630-1680 B. 1681-1710 C. 1711-1750 III. 1751-1800 A. 1751-1780 B. 1781-1800 IV. Etc.
  • 37.
    Combination Division Forms Firstdivision by time; second division by placeFirst division by time; second division by place I. Introduction II. Before 1750 A. Northern region B. Eastern region C. Southern region D. Western region III. 1751-1800 A. Northern region B. Etc.
  • 38.
    Combination Division Forms Firstdivision by time; second division by factor I. Introduction II. Before 1750 A. Food B. Chemicals C. Textiles D. Etc. III. 1751-1800 A. Food B. Chemicals C. Etc. IV. Etc.
  • 39.
    Topic or TalkingHeadings? (1 of 2) Topic headings identify. I. Population A. Houston B. Springfield C. San Diego II. Income A. Houston B. Springfield C. San Diego
  • 40.
    Topic or TalkingHeadings? (2 of 2) Talking headings identify and indicate what is said about that division. I. Growing population signals market growth A. Houston leads the nation B. Springfield has steadiest increase C. San Diego maintains status quo
  • 41.
    Wording of Headings Parallel Construction  Conciseness in Wording  Variety of Expression
  • 42.
    Parallelism in Constructionof Headings  Noun Phrase  “High Rate of Sales in District III  Sentence  “District II Sales Rank Second”  Decapitated Sentence  “District I at Bottom” Equal level headings should be in the same grammatical format whether noun phrase, sentence, or decapitated sentence.
  • 43.
    Point out anyviolations of grammatical parallelism in the following subheads of major division of a report. I. Sporting Good Shows Market Increase II. Modest Increase in Hardware Volume III. Automotive Parts Remains Unchanged IV. Plumbing Supplies Records Slight Decline.
  • 44.
    Point out anyviolations of grammatical parallelism in the following subheads of major division of a report. A. Predominance of Cotton Farming in Southern Region B. Livestock Paces Farm Income in the Western Region C. Wheat Crop Dominant in the Northern Region D. Truck Farming Leads in Central and Eastern Regions
  • 45.
    Conciseness in Wording Notthis: Personal appearance enhancement is the most desirable benefit of lasik surgery that patients report. But this: Personal appearance most desirable benefit. Headings should be the shortest possible word arrangement.
  • 46.
    Variety of Expression Notthis: A. Illinois Computer Sales B. New York Computer Sales C. Washington Computer Sales But this: A. Illinois Ranks First in Industry Sales B. New York Maintains Second Position C. Washington Posts Third Slot Replace monotonous repetitions of words in topic headings with a variety of words.
  • 47.
    Write the Report Be objective.  Believability  Impersonal vs. Personal Writing  Maintain a consistent time viewpoint.  Use smooth transitions.  Maintain interest.
  • 48.
    Write the Report Be objective.  Believability  Impersonal vs. Personal Writing  Maintain a consistent time viewpoint.  Use smooth transitions.  Maintain interest.
  • 49.
    Introduction  Tells thepurpose of the report  Describes the significance of the topic  Preview main points  Order
  • 50.
    Headings  Highlight majorideas  Give big picture  Functional Headings  Background, Administration, Quality Control etc.  Talking Headings  Campus parking problem, Job assessment issues etc
  • 51.
    Headings  Use appropriateheading levels  Capitalize and underline carefully  Include at least one heading per page  Keep heading short but clear  Do not repeat word or heading
  • 52.
    Transitions  Transitional Expressionlike additionally, furthermore, on the contrary etc  Show relationship  Reveal logical flow  Requires appropriate usage
  • 53.
    Illustrating With Graphics WhyGraphics?  Easy to understand Easy to remember Make numerical data meaningful Simplify complex idea Provide summarized information Visual interest Protects audience from getting bored
  • 54.
    Three important functions ofGraphics Clarify data Condense and simplify data Emphasize data
  • 55.
    A Dilemma  Samedata can be shown in many different forms, Like:  A table  A graph – Bar Chart, Pie Chart, Line Chart etc.  A mach between appropriate graphic and your objective  Decide what data are significant and to be highlighted  Who is your audience?
  • 56.
    Forms of Graphics Table To show exact figures and values
  • 57.
    Forms of Graphics BarChart  To compare one item with other
  • 58.
    Forms of Graphics LineChart  To Demonstrate changes over time
  • 59.
    Forms of Graphics PieChart  To visualize a whole unit and the proportions of its components
  • 60.
    Forms of Graphics Flow Chart  To display a process or procedure
  • 61.
    Forms of Graphics Organization Chart  To define a hierarchy of elements
  • 62.
    Forms of Graphics Photograph& Map  To create authenticity or to spotlight a location
  • 63.
    Incorporating Graphics in Reports Evaluatethe Audience  Nature of report internal or external  Evaluate reader, content and schedule  For internal report 5-6 graphs  For external report can be more
  • 64.
    Incorporating Graphics in Reports BeAccurate and Ethical  Ensure accuracy of figures  Graphs must not be misleading  Use appropriate scaling  Use references in case of external visuals
  • 65.
    Introduce Graphic meaningfully Place the graphic close to the discussion point  Use proper reference to every graphics  Draw the concentration towards the conclusion you derived  Interpret them for readers Incorporating Graphics in Reports
  • 66.
  • 67.
    Conclusion of aReport Most widely read portion of a report which summarizes & explains the findings in a report. Heart of a report which shows goals, background & frame of reference, all should support the conclusion you make. Audience of a report wants:  How the data in related to the problem being studied?  What do the findings mean in terms of solving the original report problem?
  • 68.
    Conclusion of aReport - Functions  Interpret & summarize the findings  Don’t manipulate the findings to achieve preconceived purpose  Always try to be objective & bias free  Consistent evaluation criteria (same criteria for evaluation…)  Relate the conclusion to the report problem
  • 69.
  • 70.
    Recommendation  Conclusions explainwhat the problem is, while the recommendations tell how to solve it.  Readers prefer specific & practical recommendations agreeable to them.  How a suggestion can be implemented  Authorization is required for specification  What are you required to do and what does the reader expect?  Avoid using conditional words such as maybe & perhaps………..
  • 71.
    Recommendation  Try topresent the recommendation as a command  Shows your command on the subject  When possible, arrange the recommendation in an announced order, such as important to least important  Can combine the recommendations & conclusions  May omit the conclusion in short reports