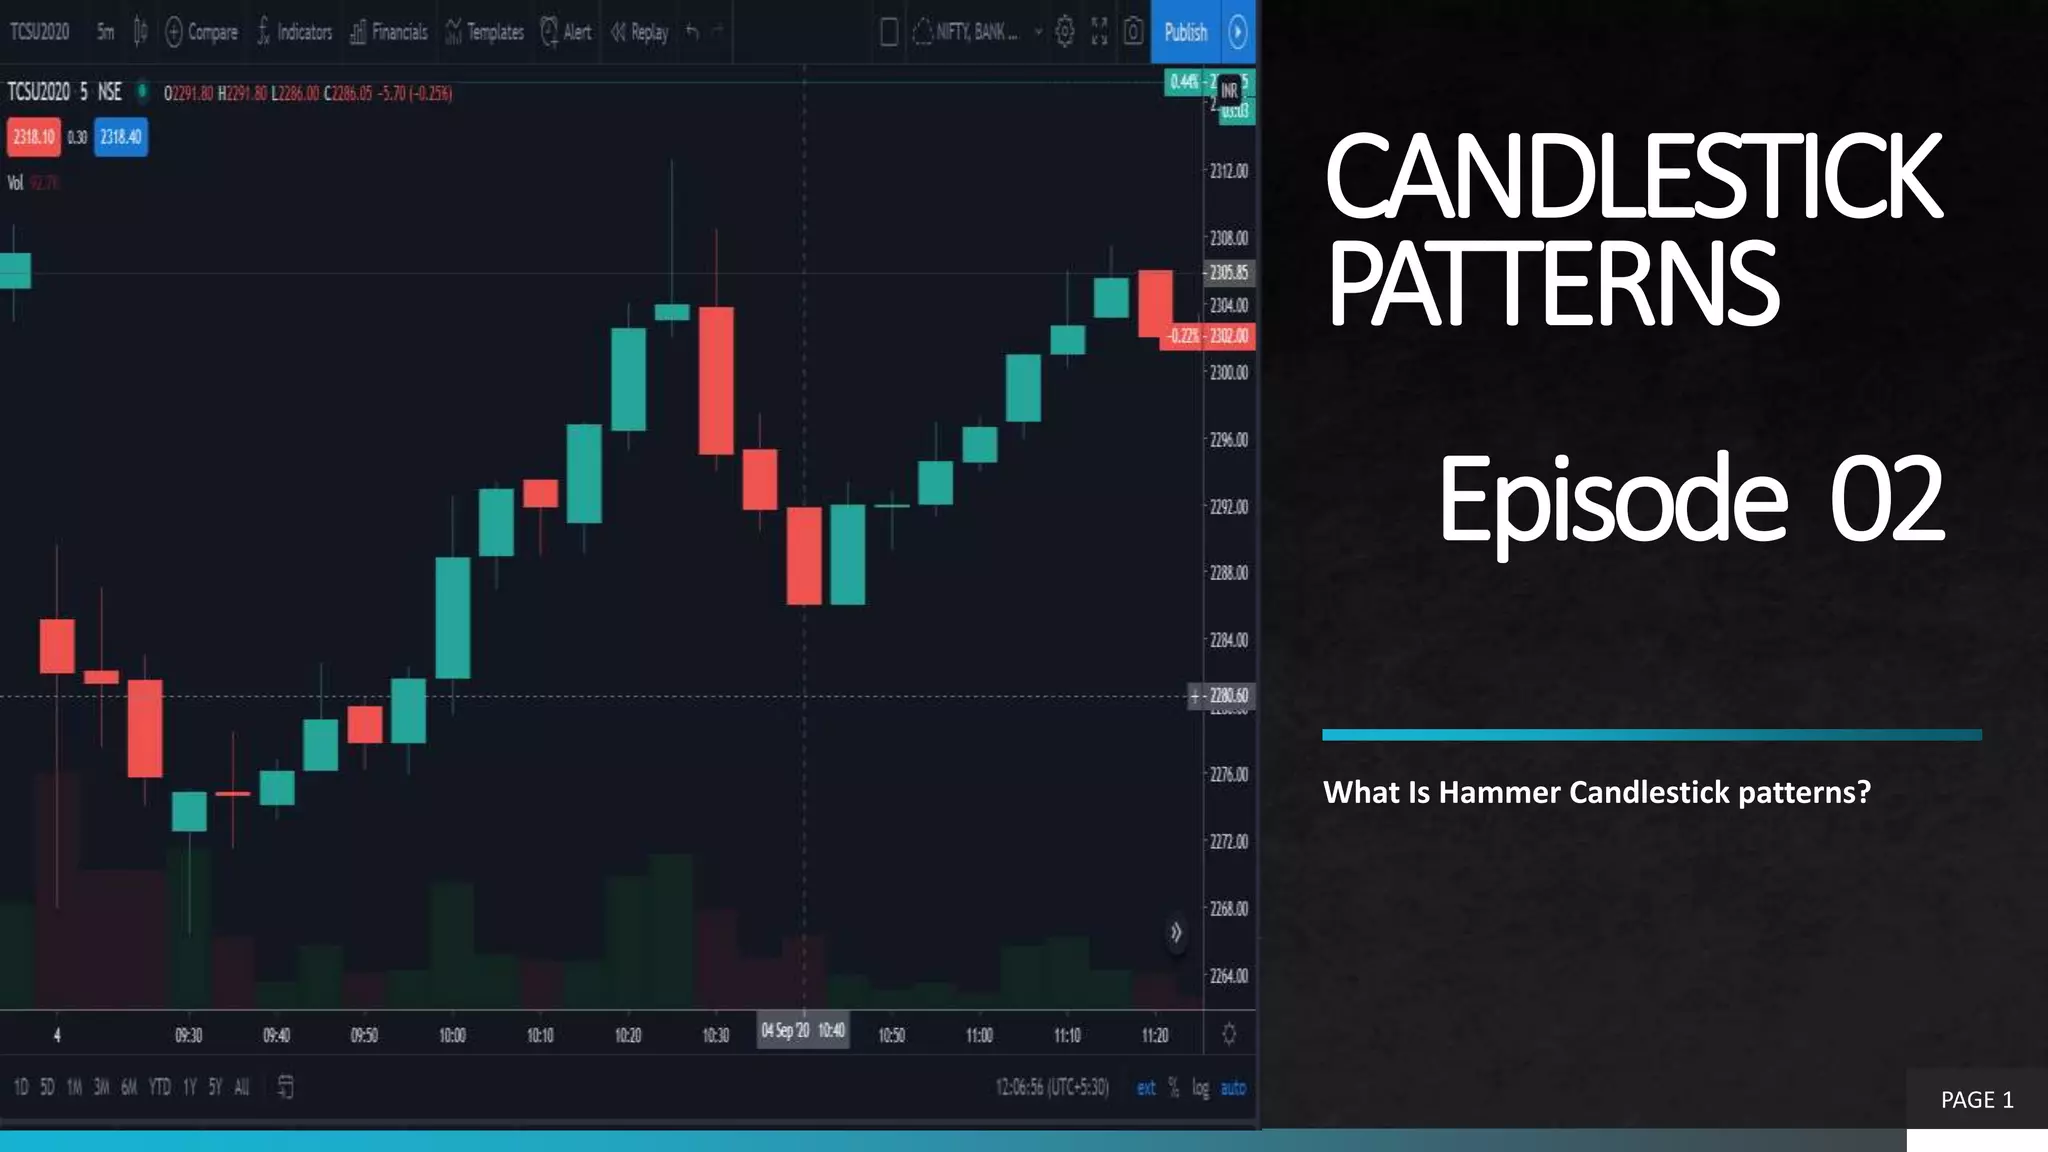
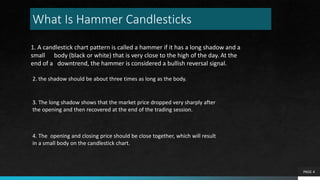
CANDLESTICK
PATTERNS
Episode 02
What Is Hammer Candlestick patterns?
PAGE 1
Course
Outline
PAGE 2
What is Hammer Candlesticks
Patterns?
Sign of Reversal Patterns
HAMMER CANDLESTICK TERMINOLOGY
AND MARKET EMOTION
We will cover these topics
Hammer Candles
PAGE 3
What Is Hammer Candlesticks
PAGE 4
1. A candlestick chart pattern is called a hammer if it has a long shadow and a
small body (black or white) that is very close to the high of the day. At the
end of a downtrend, the hammer is considered a bullish reversal signal.
2. the shadow should be about three times as long as the body.
3. The long shadow shows that the market price dropped very sharply after
the opening and then recovered at the end of the trading session.
4. The opening and closing price should be close together, which will result
in a small body on the candlestick chart.
HAMMER CANDLESTICK
TERMINOLOGY AND MARKET
EMOTION
 Hammer are the way to measure
the emotional component of the
market.
 Hammer is Bullish reversal
Patterns
 Buyers are in momentirily control
 The Longer the wick, the greater
the price rejection
PAGE 5
First Skill Second Skill
Third Skill
Conclusion
Market Emotion
First Lesson
Summary
Here is what we learned
 Hammer Candlesticks Patterns
 Hammer is bullish reversal patterns
 Hammer is indicator of price action either in uptrend or
downtrends
PAGE 6
First Skill Second Skill Third Skill
Conclusion

candlestick pattern trading strategy ,What is Hammer candlestick ? Technical Analysis | Episode 02

  • 1.
    CANDLESTICK PATTERNS Episode 02 What IsHammer Candlestick patterns? PAGE 1
  • 2.
    Course Outline PAGE 2 What isHammer Candlesticks Patterns? Sign of Reversal Patterns HAMMER CANDLESTICK TERMINOLOGY AND MARKET EMOTION We will cover these topics
  • 3.
  • 4.
    What Is HammerCandlesticks PAGE 4 1. A candlestick chart pattern is called a hammer if it has a long shadow and a small body (black or white) that is very close to the high of the day. At the end of a downtrend, the hammer is considered a bullish reversal signal. 2. the shadow should be about three times as long as the body. 3. The long shadow shows that the market price dropped very sharply after the opening and then recovered at the end of the trading session. 4. The opening and closing price should be close together, which will result in a small body on the candlestick chart.
  • 5.
    HAMMER CANDLESTICK TERMINOLOGY ANDMARKET EMOTION  Hammer are the way to measure the emotional component of the market.  Hammer is Bullish reversal Patterns  Buyers are in momentirily control  The Longer the wick, the greater the price rejection PAGE 5 First Skill Second Skill Third Skill Conclusion Market Emotion
  • 6.
    First Lesson Summary Here iswhat we learned  Hammer Candlesticks Patterns  Hammer is bullish reversal patterns  Hammer is indicator of price action either in uptrend or downtrends PAGE 6 First Skill Second Skill Third Skill Conclusion