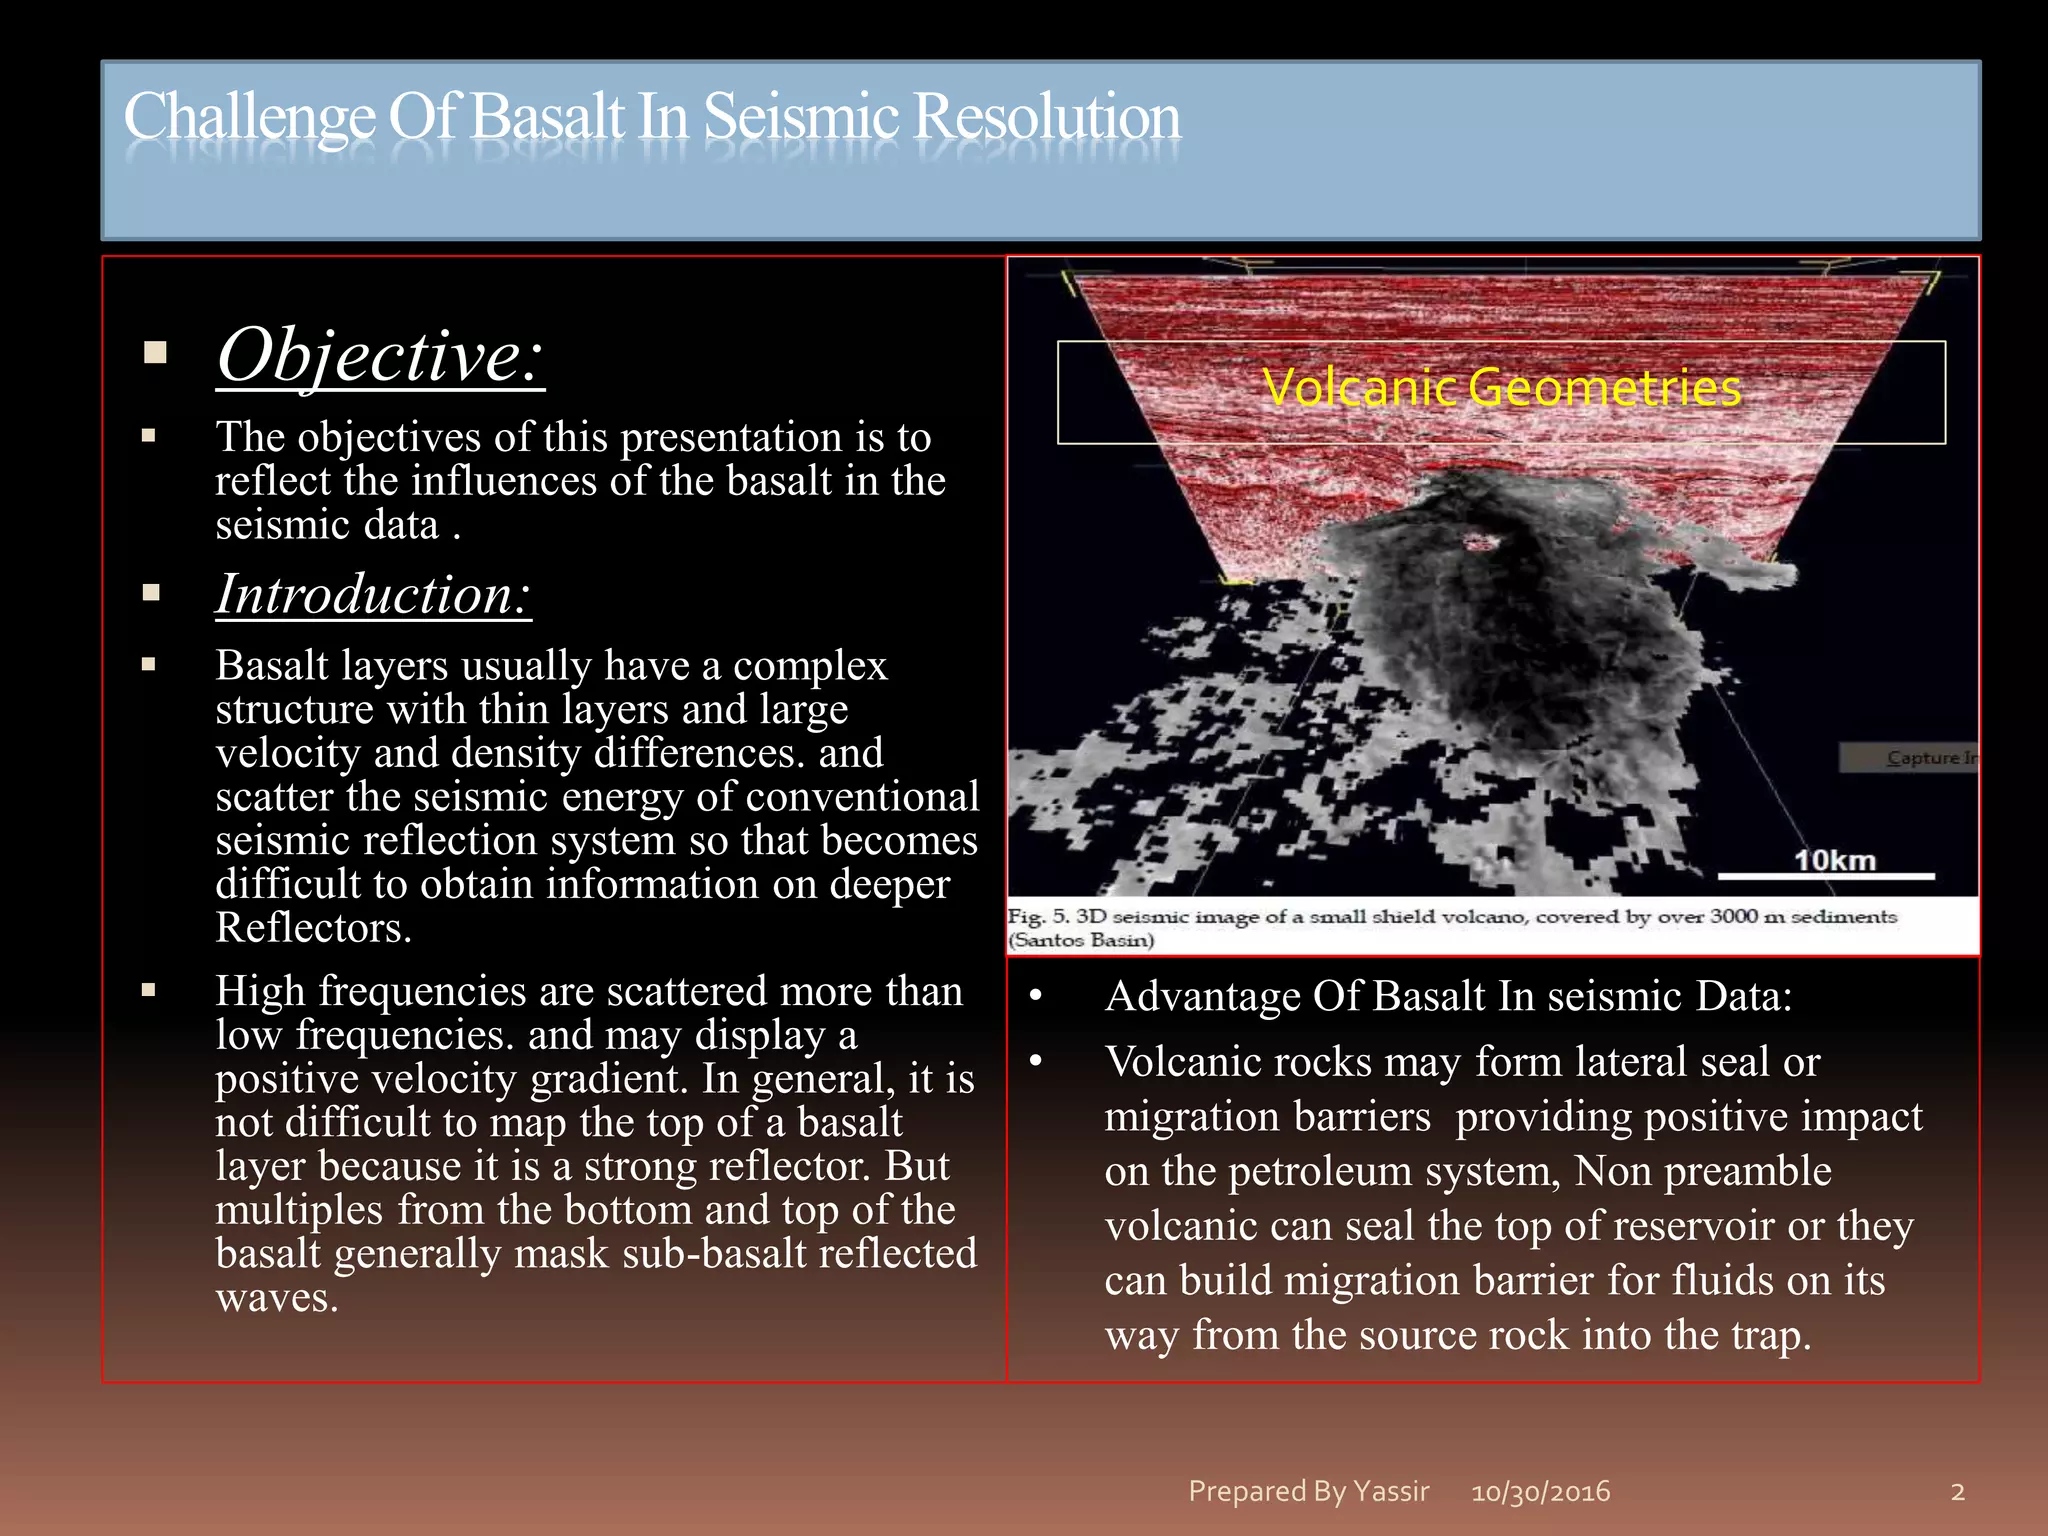
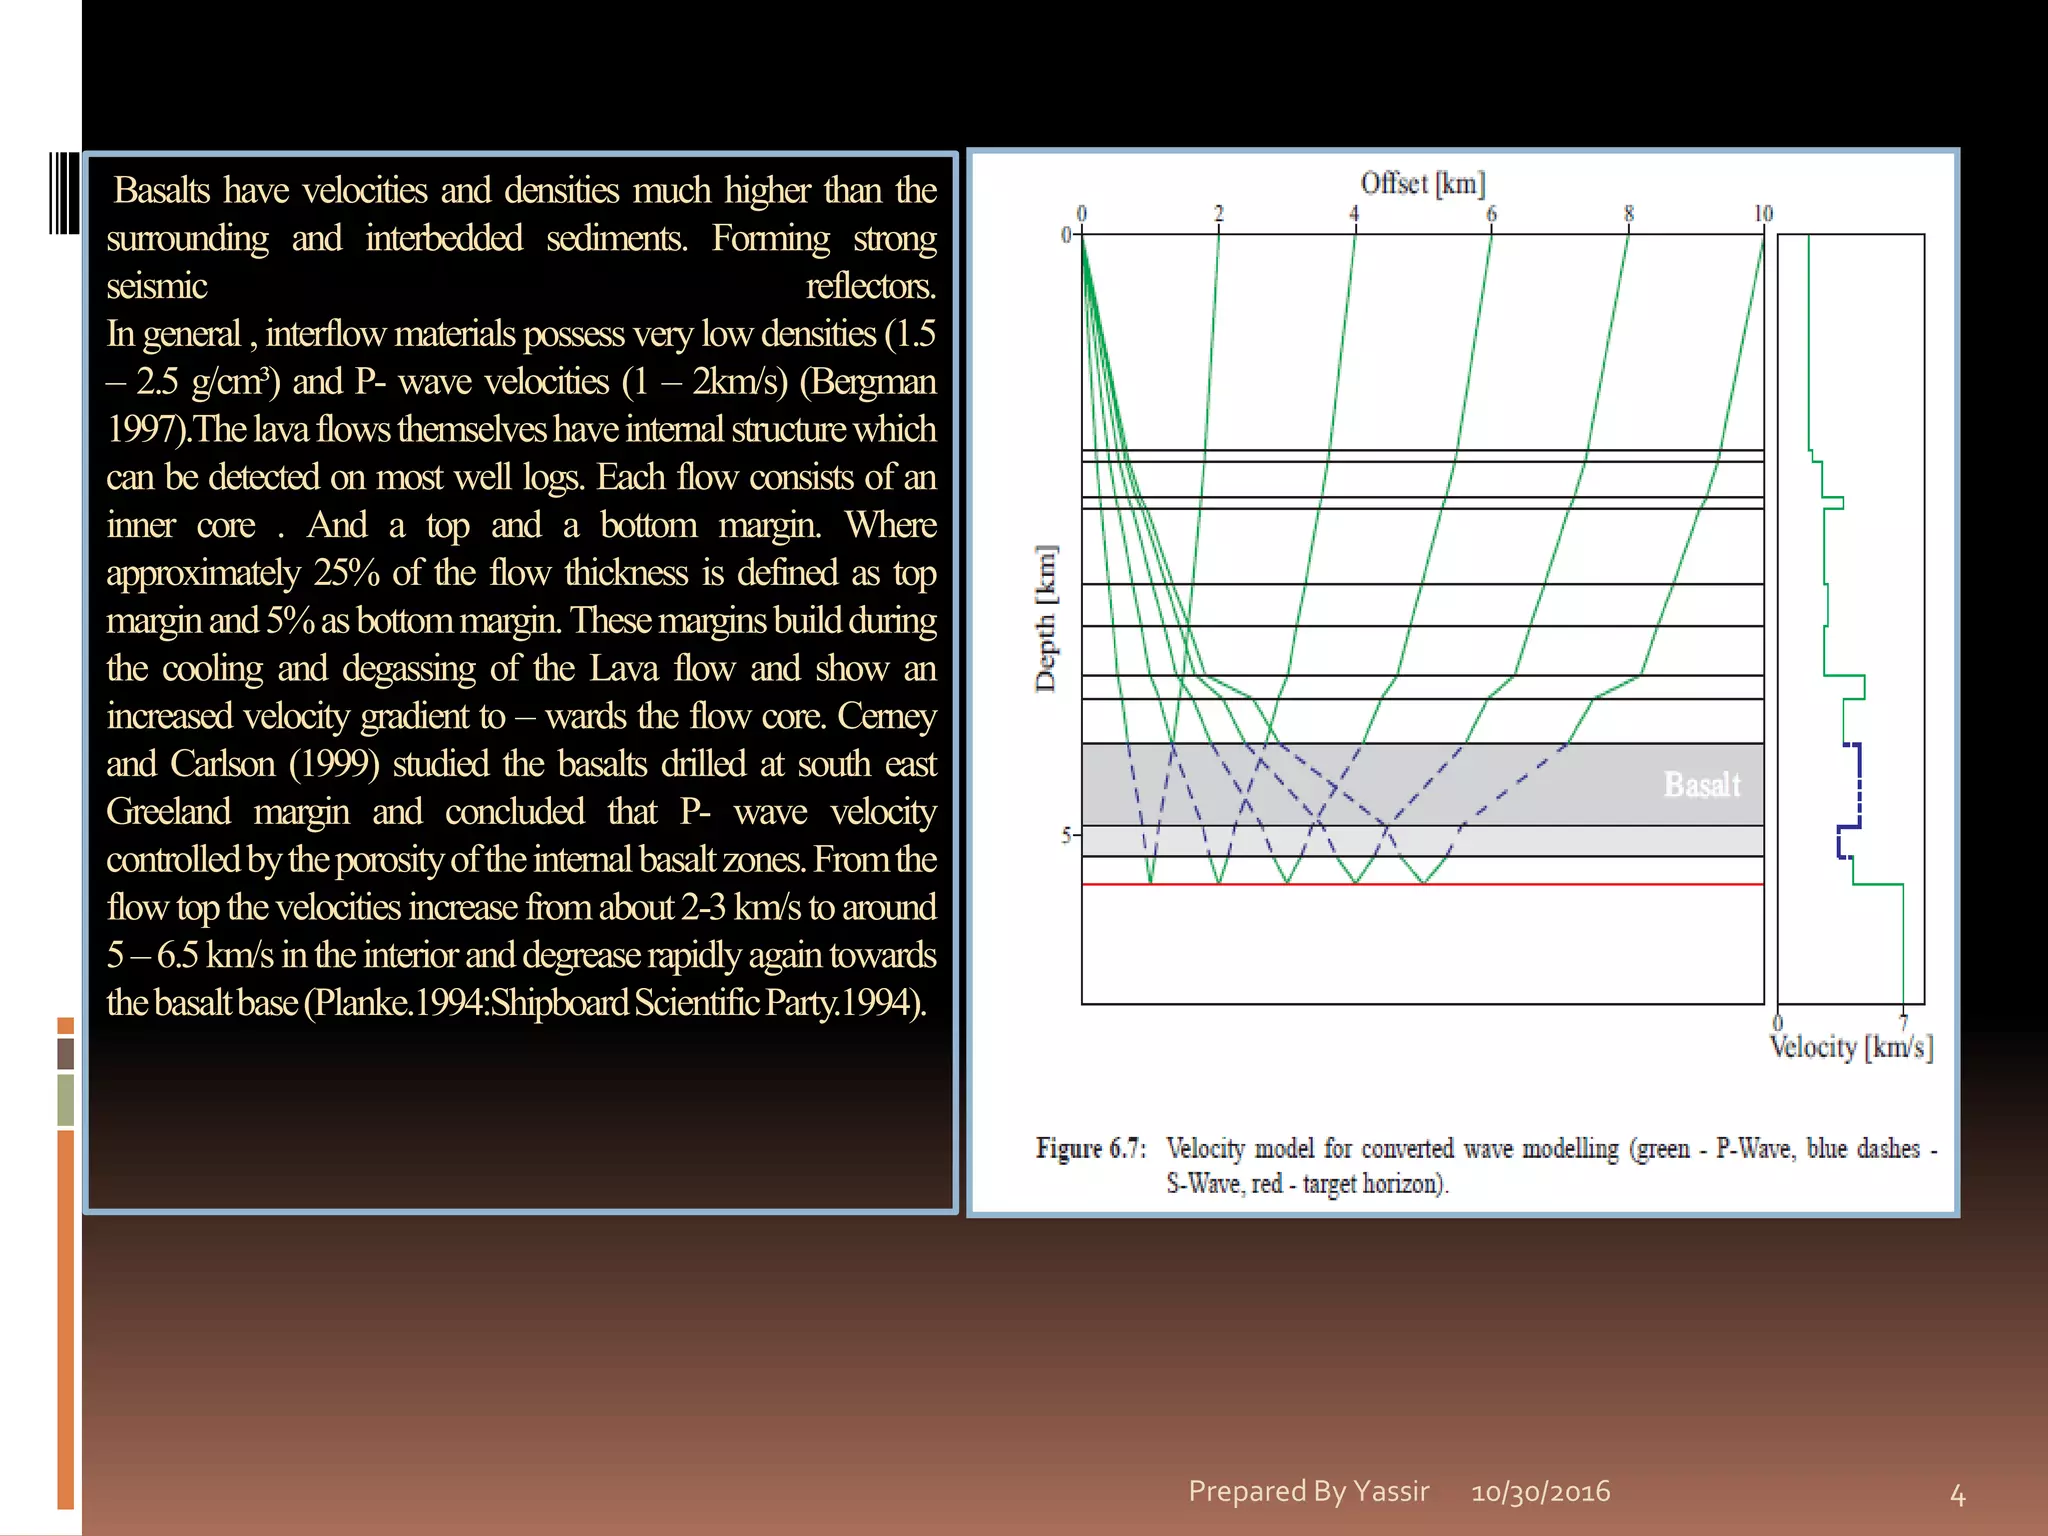
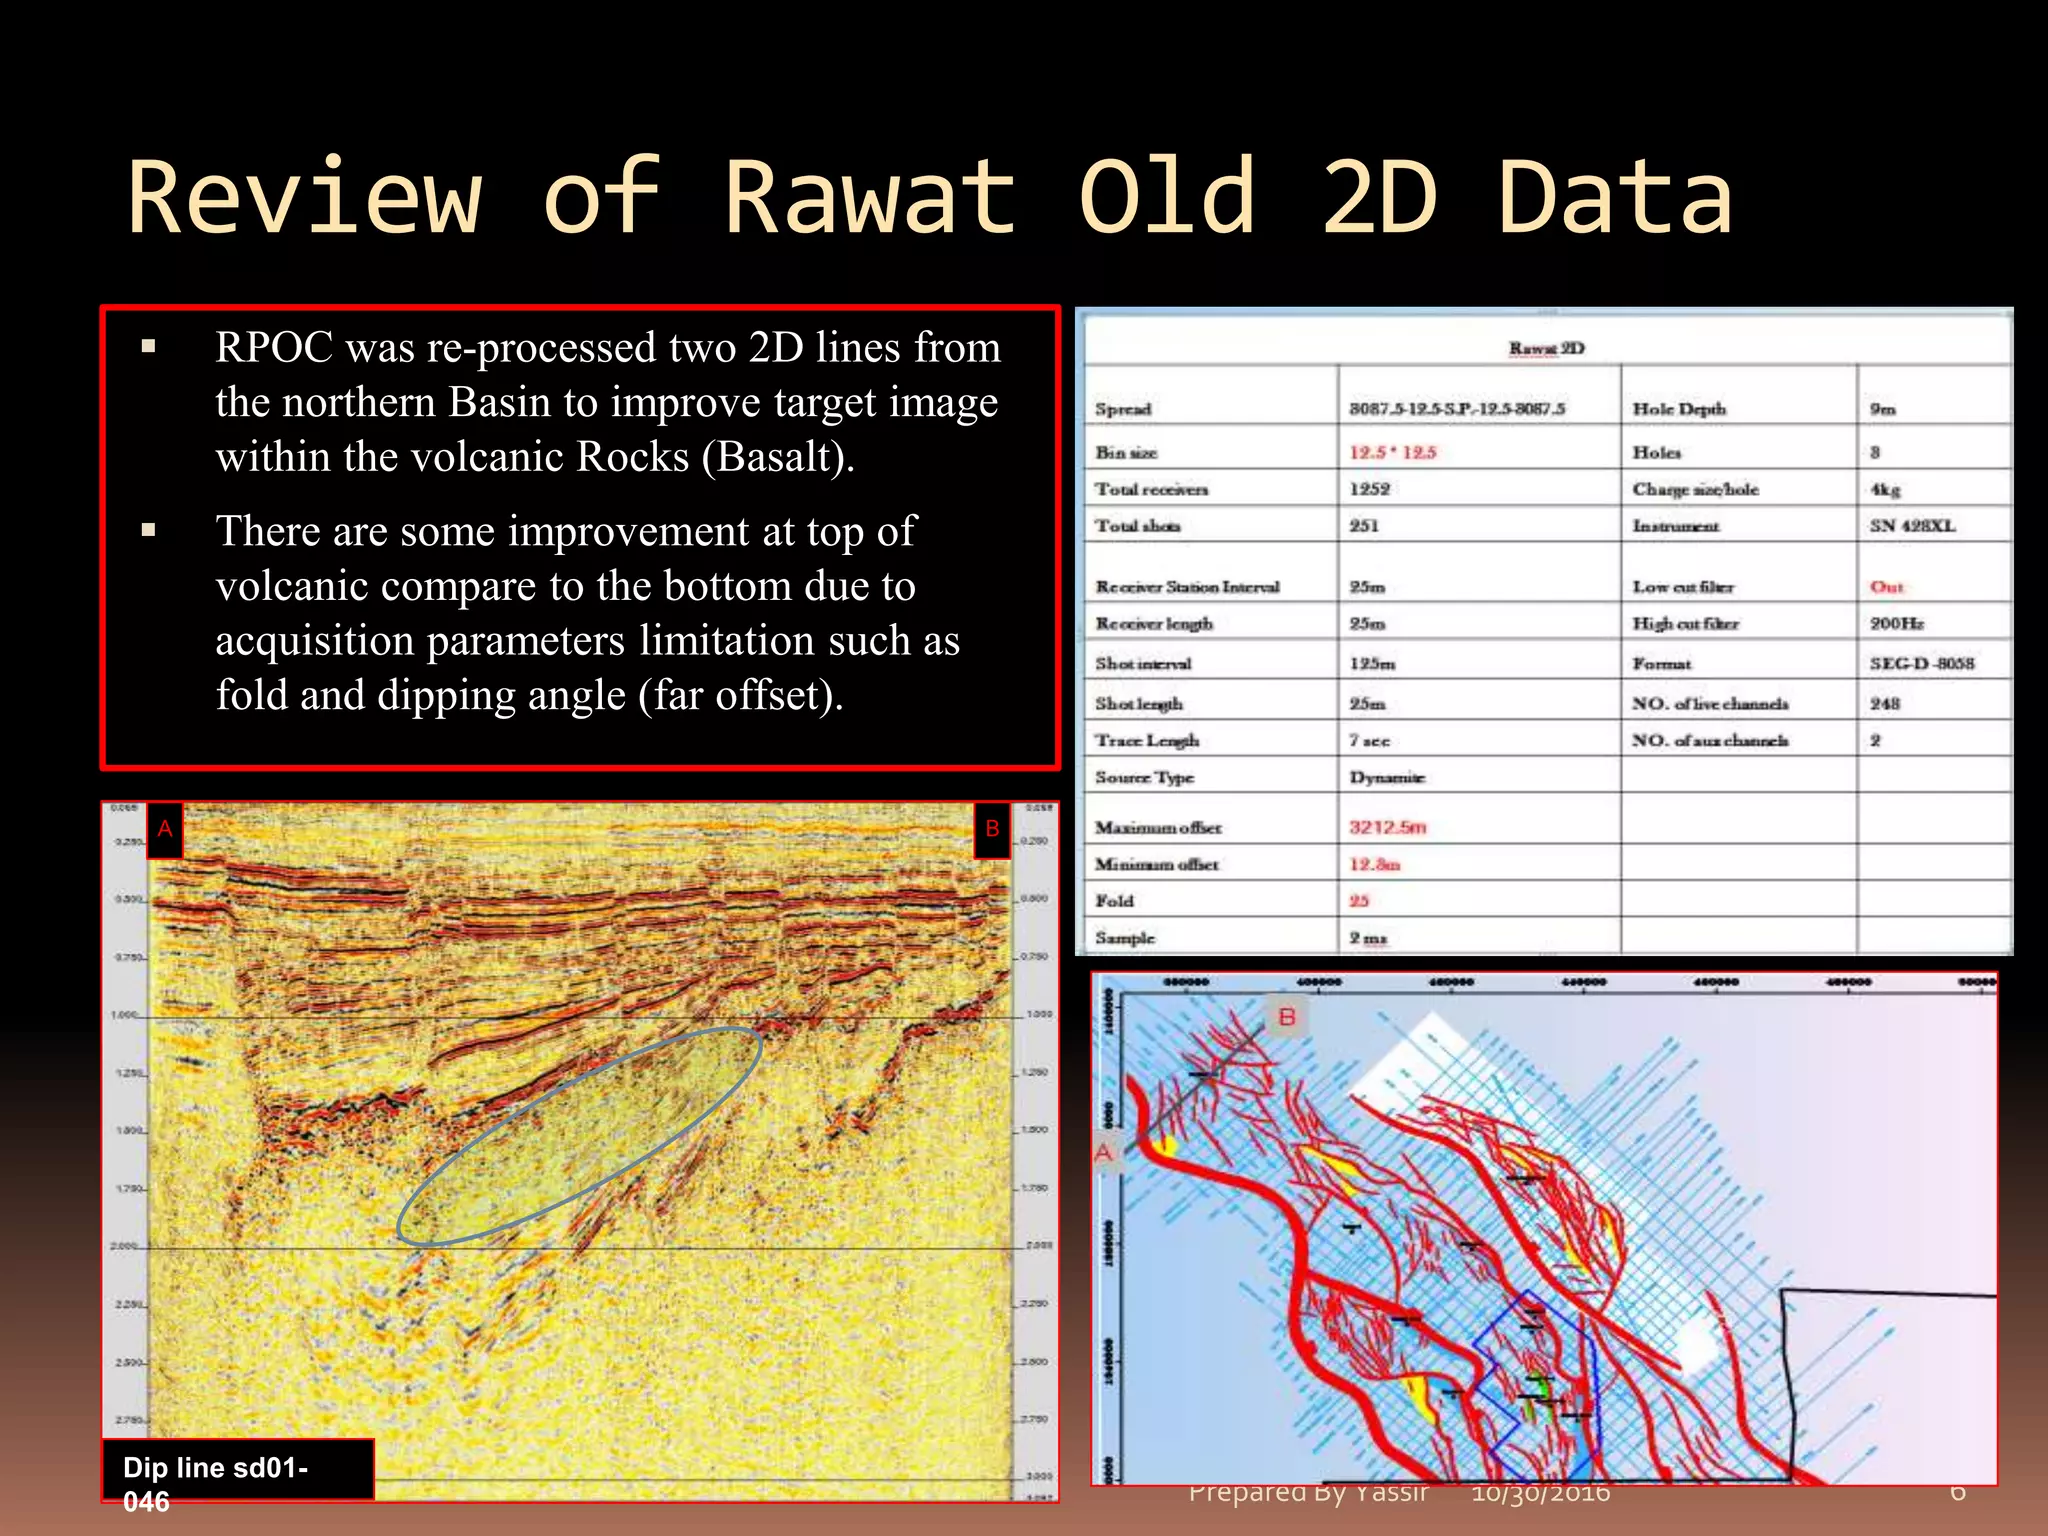
10/30/2016Prepared By Yassir 1
OUT LINES:
Challenge Of Basalt In Seismic Resolution.
Reflection and Transmission in Basalt.
Review of Rawat Old 2D Data.
Technique used for better imaging sub –basalt.
Proposed Parameters Test for New 2D Project.
Challenge Of Basalt In Seismic Resolution
 Objective:
 The objectives of this presentation is to
reflect the influences of the basalt in the
seismic data .
 Introduction:
 Basalt layers usually have a complex
structure with thin layers and large
velocity and density differences. and
scatter the seismic energy of conventional
seismic reflection system so that becomes
difficult to obtain information on deeper
Reflectors.
 High frequencies are scattered more than
low frequencies. and may display a
positive velocity gradient. In general, it is
not difficult to map the top of a basalt
layer because it is a strong reflector. But
multiples from the bottom and top of the
basalt generally mask sub-basalt reflected
waves.
10/30/2016Prepared By Yassir 2
VolcanicGeometries
• Advantage Of Basalt In seismic Data:
• Volcanic rocks may form lateral seal or
migration barriers providing positive impact
on the petroleum system, Non preamble
volcanic can seal the top of reservoir or they
can build migration barrier for fluids on its
way from the source rock into the trap.
Line SD01-062
Line SD01-047
• The high impedance contrast between
sedimentary and basaltic rocks directly
influences the reflection and transmission of
waves. If a wave encounters an interface
between a sedimentary layer and a basalt,
most of the energy will be reflected back and
less energy will be transmitted through the
interface. The top of a basalt sequence will
have a high reflectivity and therefore will
transmit less energy through it. An incident
P-wave will produce reflected P- and S-
modes also beyond the critical angle, but the
transmission of a P-wave down into the
high-velocity layer will stop at this point and
only S-wave energy will travel further down.
Reflection and Transmission in Basalt
10/30/2016Prepared By Yassir 3
Basalts have velocities and densities much higher than the
surrounding and interbedded sediments. Forming strong
seismic reflectors.
Ingeneral ,interflow materialspossessverylowdensities(1.5
– 2.5 g/cm³) and P- wave velocities (1 – 2km/s) (Bergman
1997).Thelavaflowsthemselveshaveinternalstructurewhich
can be detected on most well logs. Each flow consists of an
inner core . And a top and a bottom margin. Where
approximately 25% of the flow thickness is defined as top
marginand5%asbottommargin.Thesemarginsbuildduring
the cooling and degassing of the Lava flow and show an
increased velocity gradient to – wards the flow core. Cerney
and Carlson (1999) studied the basalts drilled at south east
Greeland margin and concluded that P- wave velocity
controlledbytheporosityoftheinternalbasaltzones.Fromthe
flowtopthevelocitiesincreasefromabout2-3km/stoaround
5–6.5km/sintheinterioranddegreaserapidlyagaintowards
thebasaltbase(Planke.1994:ShipboardScientificParty.1994).
10/30/2016Prepared By Yassir 4
• FMI result is reflect there is high
resistivity, low ROP zones were
interpreted as igneous rocks and
they covered part of the Northern
Sub-basin.
• The effect of these igneous bodies
on the petroleum system of the
area is poorly known.
Volcanic Interpretation for the Drilled
Well
Top Volcanic
Bottom Volcanic
10/30/2016Prepared By Yassir 5
Review of Rawat Old 2D Data
 RPOC was re-processed two 2D lines from
the northern Basin to improve target image
within the volcanic Rocks (Basalt).
 There are some improvement at top of
volcanic compare to the bottom due to
acquisition parameters limitation such as
fold and dipping angle (far offset).
10/30/2016Prepared By Yassir 6
Dip line sd01-
046
BA
Re-Processeddatahasslightlyimprovementbeneaththebasalt
10/30/2016Prepared By Yassir 7
Re-processed (2016)Processed (2001)
10/30/2016Prepared By Yassir 8
10/30/2016Prepared By Yassir 9
S.Int R.Int Charge
Size
T.
Station
Max.Offse
t
Fold
Coverag
e
50 m 25 m 2 Kg 280 3487.5 70
S.Int R.Int Charge
Size
T. Station Max.Offset Fold
Coverage
125 m 25 m 12 Kg 248 2312.5 25
2001 2009
Dip Line
Probability Of Improving Data Quality with dynamite crew
10/30/2016Prepared By Yassir 10
10/30/2016Prepared By Yassir 11
S.Int R.Int Charge
Size
T. Station Max.Offset Fold
Coverage
125 m 25 m 12 Kg 248 2312.5 25
S.Int R.Int Charge
Size
T.
Station
Max.Offse
t
Fold
Coverag
e
50 m 25 m 2 Kg 280 3487.5 70
Probability Of Improving Data Quality with dynamite crew
Strike Line
Technique used for better imaging sub –basalt
WideAngle
 Technique used for better
imaging sub –basalt:
 Wide –angle (long offset)
seismic surveys to avoid
scattering problem to some
extent , usually give results
related only to large scale
interval velocity of the
basalt.
 The Use of Broad Band
contain low frequency
seismic waves may avoid
the scattering problem of
thin layering and lateral
heterogeneous and may
provide the basis for
reflection energy to
penetrate through the
basalt (Gatliff et al.1984
10/30/2016Prepared By Yassir 12
Long offset to improve S/N and NMO resolution and to
allow processing of most critical reflections.
Low FrequencyHigh FrequencyImpedance
Sediments Volcanic
Technique used for better imaging sub –basalt
Low Frequency
The basalt lead to filter and scattered most of the High Frequency and reflected as
multiples layers.
10/30/2016Prepared By Yassir 13
35 HZ 10 HZ
10/30/2016Prepared By Yassir 14
10-20 Hz
Frequency Analysis
10/30/2016Prepared By Yassir 15
Band pass 20-40Hz
Frequency Analysis
10/30/2016Prepared By Yassir 16
Band pass 30-60Hz
Frequency Analysis
10/30/2016Prepared By Yassir 17
Ground Equipment has used for Low frequency
 Micro Electro Mechanical System (MEMS) is
advanced geophone use for low frequency and it
is accelerometers that work below their resonant
frequency ,while coiled geophone are
velocimeters that work above their resonant
frequency .This different provides the two types
of sensor with quite different dimensions and
specification.
 Ground motion can be measured as
displacement, velocity and acceleration. A mass/
spring assembly used for these measurement.
 The essential benefit of MEMS accelerometers
is broadband linear amplitude and phase
response that may extend from 0 DC to 800Hz
within ±1% in amplitude and ±20 µs in time.
MEMS resonant frequency is far above the
seismic band (1 kHz).
 This makes it possible to record frequencies
below 10 Hz without attenuation, including the
direct current related to gravity acceleration.
 The gravity vector provides useful reference for
sensitivity calibration and tilt measurement (3C
sensor).
10/30/2016Prepared By Yassir 18
Comparison BetweenAnalog and Digital Geophone
10/30/2016Prepared By Yassir 19
Linear phase and amplitude response compared
between MEMS and 10HZ Geophone.
Comparison in the velocity domain of electric
noise of geophone with one of digital sensor
unit with MEMS.
No. No.Holes Hole Depth Holes
Patterns
Charge
Size
T. Charge
Size
1 1 12 m 12.5m 4 Kg 4 Kg
2 2 12 m 8 - 12.5 – 8 m 3 kg 6 Kg
2 2 9 m 8 - 12.5 – 8 m 3 kg 6 Kg
4 3 9 m 8 – 8 – 8 m 2 kg 6 Kg
5 4 6 m 4 – 4 – 4 – 4 m 2 kg 8 Kg
Proposed Source Parameters Test
As far as we are looking for broad band frequency rather than strong energy which could be
lead to increase source generate Noise and ground Roll amount. Deep hole with reasonable
charge size is recommended.
2D Geometry:
Total Live Channels:420
Receiver Interval: 25
Source Interval: 50
Fold Coverage:105
Max Offset: 5250 m
10/30/2016Prepared By Yassir 20
Propose test will carry out
with using double geophones
string for better sampling and
n ambient noise attenuation.
Proposed 2D Lines (300 Km)
10/30/2016Prepared By Yassir 21
10/30/2016Prepared By Yassir 22
Fold Plot shows
the effects of
mute function on
CMP across the
survey
The Diagram shows the
strike line azimuth and
Bin or CMP distribution
10/30/2016Prepared By Yassir 23

Basalt Presentation

  • 1.
    10/30/2016Prepared By Yassir1 OUT LINES: Challenge Of Basalt In Seismic Resolution. Reflection and Transmission in Basalt. Review of Rawat Old 2D Data. Technique used for better imaging sub –basalt. Proposed Parameters Test for New 2D Project.
  • 2.
    Challenge Of BasaltIn Seismic Resolution  Objective:  The objectives of this presentation is to reflect the influences of the basalt in the seismic data .  Introduction:  Basalt layers usually have a complex structure with thin layers and large velocity and density differences. and scatter the seismic energy of conventional seismic reflection system so that becomes difficult to obtain information on deeper Reflectors.  High frequencies are scattered more than low frequencies. and may display a positive velocity gradient. In general, it is not difficult to map the top of a basalt layer because it is a strong reflector. But multiples from the bottom and top of the basalt generally mask sub-basalt reflected waves. 10/30/2016Prepared By Yassir 2 VolcanicGeometries • Advantage Of Basalt In seismic Data: • Volcanic rocks may form lateral seal or migration barriers providing positive impact on the petroleum system, Non preamble volcanic can seal the top of reservoir or they can build migration barrier for fluids on its way from the source rock into the trap.
  • 3.
    Line SD01-062 Line SD01-047 •The high impedance contrast between sedimentary and basaltic rocks directly influences the reflection and transmission of waves. If a wave encounters an interface between a sedimentary layer and a basalt, most of the energy will be reflected back and less energy will be transmitted through the interface. The top of a basalt sequence will have a high reflectivity and therefore will transmit less energy through it. An incident P-wave will produce reflected P- and S- modes also beyond the critical angle, but the transmission of a P-wave down into the high-velocity layer will stop at this point and only S-wave energy will travel further down. Reflection and Transmission in Basalt 10/30/2016Prepared By Yassir 3
  • 4.
    Basalts have velocitiesand densities much higher than the surrounding and interbedded sediments. Forming strong seismic reflectors. Ingeneral ,interflow materialspossessverylowdensities(1.5 – 2.5 g/cm³) and P- wave velocities (1 – 2km/s) (Bergman 1997).Thelavaflowsthemselveshaveinternalstructurewhich can be detected on most well logs. Each flow consists of an inner core . And a top and a bottom margin. Where approximately 25% of the flow thickness is defined as top marginand5%asbottommargin.Thesemarginsbuildduring the cooling and degassing of the Lava flow and show an increased velocity gradient to – wards the flow core. Cerney and Carlson (1999) studied the basalts drilled at south east Greeland margin and concluded that P- wave velocity controlledbytheporosityoftheinternalbasaltzones.Fromthe flowtopthevelocitiesincreasefromabout2-3km/stoaround 5–6.5km/sintheinterioranddegreaserapidlyagaintowards thebasaltbase(Planke.1994:ShipboardScientificParty.1994). 10/30/2016Prepared By Yassir 4
  • 5.
    • FMI resultis reflect there is high resistivity, low ROP zones were interpreted as igneous rocks and they covered part of the Northern Sub-basin. • The effect of these igneous bodies on the petroleum system of the area is poorly known. Volcanic Interpretation for the Drilled Well Top Volcanic Bottom Volcanic 10/30/2016Prepared By Yassir 5
  • 6.
    Review of RawatOld 2D Data  RPOC was re-processed two 2D lines from the northern Basin to improve target image within the volcanic Rocks (Basalt).  There are some improvement at top of volcanic compare to the bottom due to acquisition parameters limitation such as fold and dipping angle (far offset). 10/30/2016Prepared By Yassir 6 Dip line sd01- 046 BA
  • 7.
  • 8.
  • 9.
  • 10.
    S.Int R.Int Charge Size T. Station Max.Offse t Fold Coverag e 50m 25 m 2 Kg 280 3487.5 70 S.Int R.Int Charge Size T. Station Max.Offset Fold Coverage 125 m 25 m 12 Kg 248 2312.5 25 2001 2009 Dip Line Probability Of Improving Data Quality with dynamite crew 10/30/2016Prepared By Yassir 10
  • 11.
    10/30/2016Prepared By Yassir11 S.Int R.Int Charge Size T. Station Max.Offset Fold Coverage 125 m 25 m 12 Kg 248 2312.5 25 S.Int R.Int Charge Size T. Station Max.Offse t Fold Coverag e 50 m 25 m 2 Kg 280 3487.5 70 Probability Of Improving Data Quality with dynamite crew Strike Line
  • 12.
    Technique used forbetter imaging sub –basalt WideAngle  Technique used for better imaging sub –basalt:  Wide –angle (long offset) seismic surveys to avoid scattering problem to some extent , usually give results related only to large scale interval velocity of the basalt.  The Use of Broad Band contain low frequency seismic waves may avoid the scattering problem of thin layering and lateral heterogeneous and may provide the basis for reflection energy to penetrate through the basalt (Gatliff et al.1984 10/30/2016Prepared By Yassir 12 Long offset to improve S/N and NMO resolution and to allow processing of most critical reflections.
  • 13.
    Low FrequencyHigh FrequencyImpedance SedimentsVolcanic Technique used for better imaging sub –basalt Low Frequency The basalt lead to filter and scattered most of the High Frequency and reflected as multiples layers. 10/30/2016Prepared By Yassir 13
  • 14.
    35 HZ 10HZ 10/30/2016Prepared By Yassir 14
  • 15.
  • 16.
    Band pass 20-40Hz FrequencyAnalysis 10/30/2016Prepared By Yassir 16
  • 17.
    Band pass 30-60Hz FrequencyAnalysis 10/30/2016Prepared By Yassir 17
  • 18.
    Ground Equipment hasused for Low frequency  Micro Electro Mechanical System (MEMS) is advanced geophone use for low frequency and it is accelerometers that work below their resonant frequency ,while coiled geophone are velocimeters that work above their resonant frequency .This different provides the two types of sensor with quite different dimensions and specification.  Ground motion can be measured as displacement, velocity and acceleration. A mass/ spring assembly used for these measurement.  The essential benefit of MEMS accelerometers is broadband linear amplitude and phase response that may extend from 0 DC to 800Hz within ±1% in amplitude and ±20 µs in time. MEMS resonant frequency is far above the seismic band (1 kHz).  This makes it possible to record frequencies below 10 Hz without attenuation, including the direct current related to gravity acceleration.  The gravity vector provides useful reference for sensitivity calibration and tilt measurement (3C sensor). 10/30/2016Prepared By Yassir 18
  • 19.
    Comparison BetweenAnalog andDigital Geophone 10/30/2016Prepared By Yassir 19 Linear phase and amplitude response compared between MEMS and 10HZ Geophone. Comparison in the velocity domain of electric noise of geophone with one of digital sensor unit with MEMS.
  • 20.
    No. No.Holes HoleDepth Holes Patterns Charge Size T. Charge Size 1 1 12 m 12.5m 4 Kg 4 Kg 2 2 12 m 8 - 12.5 – 8 m 3 kg 6 Kg 2 2 9 m 8 - 12.5 – 8 m 3 kg 6 Kg 4 3 9 m 8 – 8 – 8 m 2 kg 6 Kg 5 4 6 m 4 – 4 – 4 – 4 m 2 kg 8 Kg Proposed Source Parameters Test As far as we are looking for broad band frequency rather than strong energy which could be lead to increase source generate Noise and ground Roll amount. Deep hole with reasonable charge size is recommended. 2D Geometry: Total Live Channels:420 Receiver Interval: 25 Source Interval: 50 Fold Coverage:105 Max Offset: 5250 m 10/30/2016Prepared By Yassir 20
  • 21.
    Propose test willcarry out with using double geophones string for better sampling and n ambient noise attenuation. Proposed 2D Lines (300 Km) 10/30/2016Prepared By Yassir 21
  • 22.
    10/30/2016Prepared By Yassir22 Fold Plot shows the effects of mute function on CMP across the survey The Diagram shows the strike line azimuth and Bin or CMP distribution
  • 23.