This document outlines 6 questions for a math assignment on various interpolation techniques:
1. Use a degree 3 polynomial to estimate life expectancies in 3 years for 2 countries.
2. Fit an exponential function to 5 data points to determine coefficients.
3. Compare accuracy of interpolating a function using cubic spline, pchip cubic, and degree 5 polynomial.
4. Generate and analyze cubic spline and pchip interpolants, with derivatives, for another data set.
5. Find the least squares solution to an overdetermined system of linear equations from altitude measurements.
6. Determine the best fitting function - quadratic, power, or exponential - for another data set. Instructions are provided for including
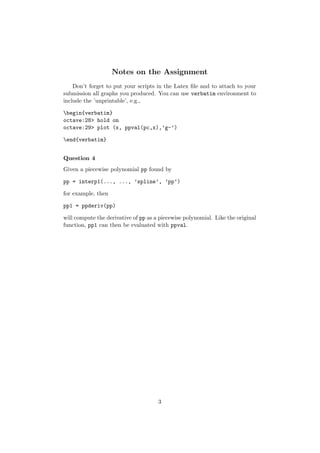
![AMTH250 Assignment 4
Due: 27th August
Question 1 [2 marks]
The following data are related to the life expectation of citizens of two
countries:
1975 1980 1985 1990
Tanab 72.8 74.2 75.2 76.4
Sarac 70.2 70.2 70.3 71.2
Use the interpolating polynomial of degree three to estimate the life
expectation in 1977, 1983, and 1988.
Question 2 [2 marks]
A function
y = a1 e−2x + a2 e−x + a3 + a4 ex + a5 e2x
has the values
x -2 -1 0 1 2
y 125.948 7.673 -4.000 -14.493 -103.429
Determine the coefficients a1 , a2 , a3 , a4 , a5 .
Question 3 [2 marks]
√
Interpolate and plot the following values of the function y = x using
(a) a cubic spline, (b) a pchip cubic and (c) a polynomial of degree 5.
x 0 0.01 0.04 0.09 0.16 0.25
y 0 0.1 0.2 0.3 0.4 0.5
Which is most accurate over most of the domain?
Which is most accurate between 0 and 0.01?
(Plot the errors over the domain of x and over the interval [0, 0.01] and
compare them.)
1](https://image.slidesharecdn.com/assignment4-130413002307-phpapp01/85/Assignment4-1-320.jpg)
![Question 4 [3 marks]
For the data
x 1.0 2.0 3.0 4.0 5.0 6.0 7.0
y 1.9 2.7 4.8 5.3 7.1 9.4 11.3
(a) Compute and plot the cubic spline and pchip interpolants and their
first, second and third derivatives. Use ppderiv for the derivatives.
(b) Verify, from the graphs, that the defining conditions for a cubic
spline and a pchip cubic are satisfied. How does the ”not-a-knot” condition
for the cubic spline show up in the graphs?
Question 5 [3 marks]
The following problem arises in surveying. Suppose we wish to determine
the altitudes x1 , x2 , x3 and x4 of four points. As well as measuring each
altitude with respect to some reference point, each point is measured with
respect to all of the others. The resulting measurements are:
x1 2.95
x2 1.74
x3 -1.45
x4 1.32
x1 − x2 1.23
x1 − x3 4.45
x1 − x4 1.61
x2 − x3 3.21
x2 − x4 0.45
x3 − x4 -2.75
These form an overdetermined set of linear equations. Find the least-squares
solution. How do the computed values compare to the direct measurements?
Question 6 [4 marks]
Fit a quadratic polynomial, a power function y = axp and an exponential
function y = aekx to the data:
x 1.0 2.0 3.0 4.0 5.0 6.0 7.0 8.0 9.0 10.0
y 27.7 39.3 38.4 57.6 46.3 54.8 108.5 137.6 194.1 281.2
Which do you think gives the best representation of the data?
2](https://image.slidesharecdn.com/assignment4-130413002307-phpapp01/85/Assignment4-2-320.jpg)