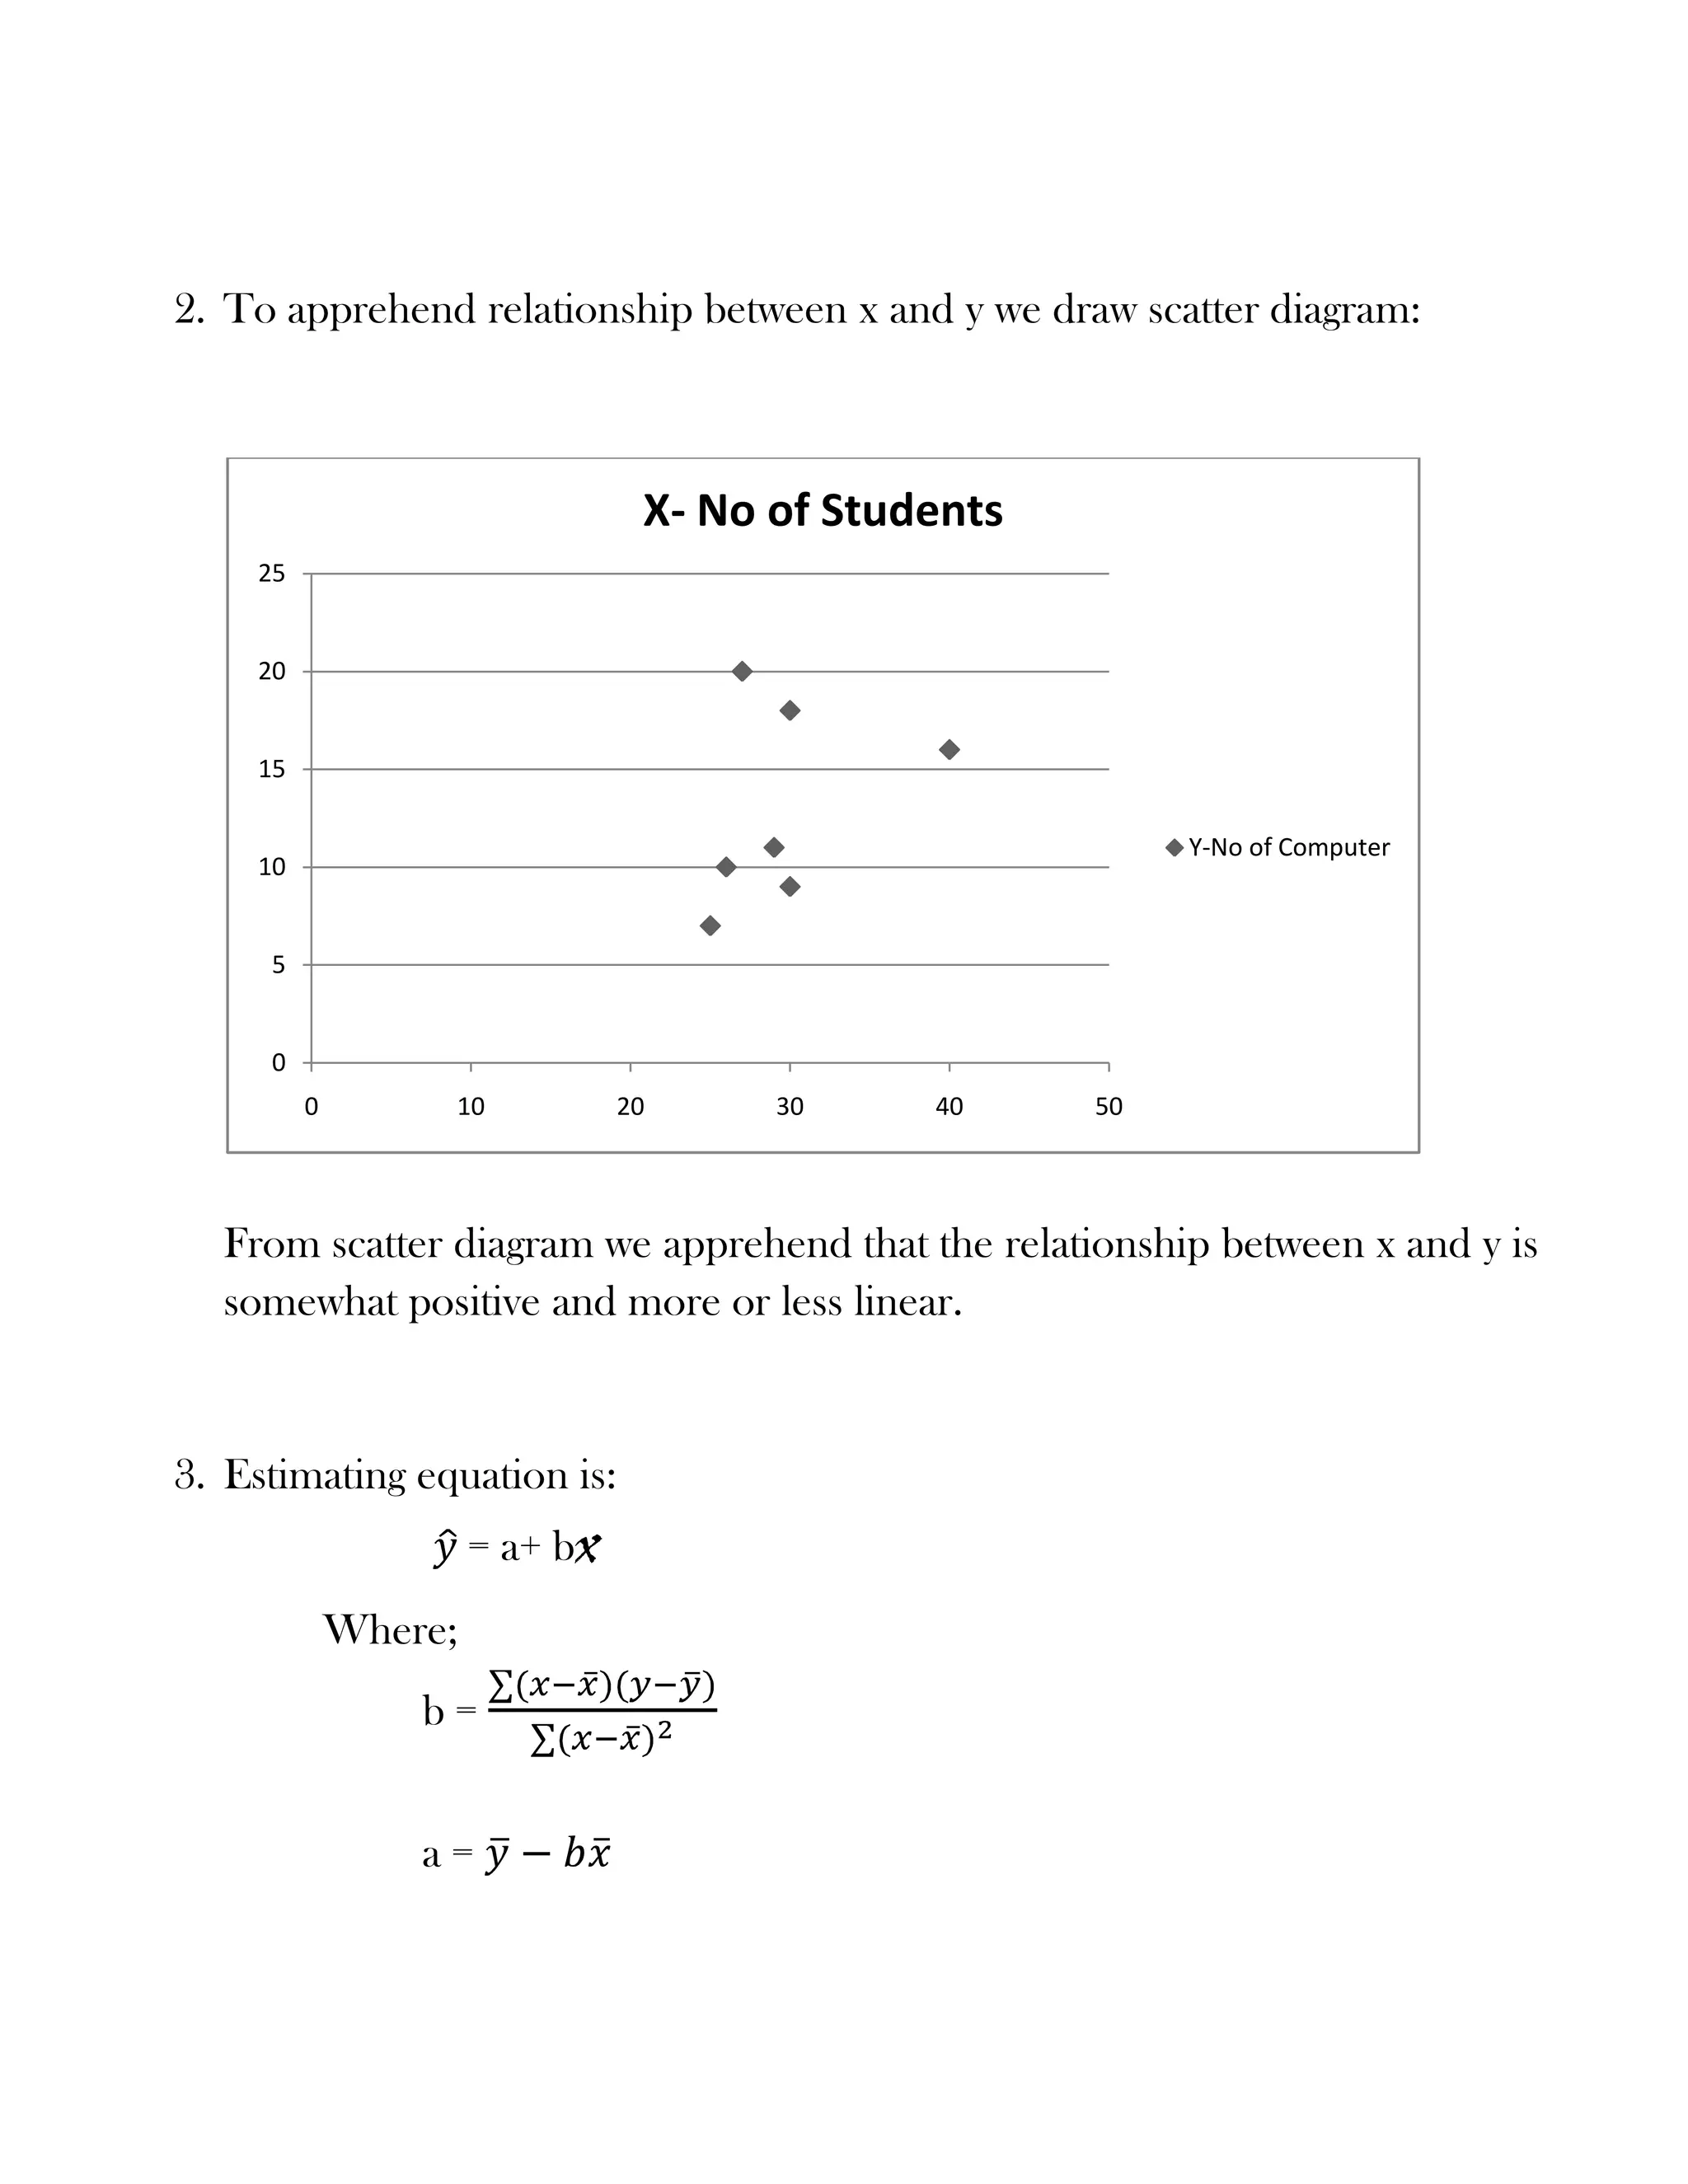
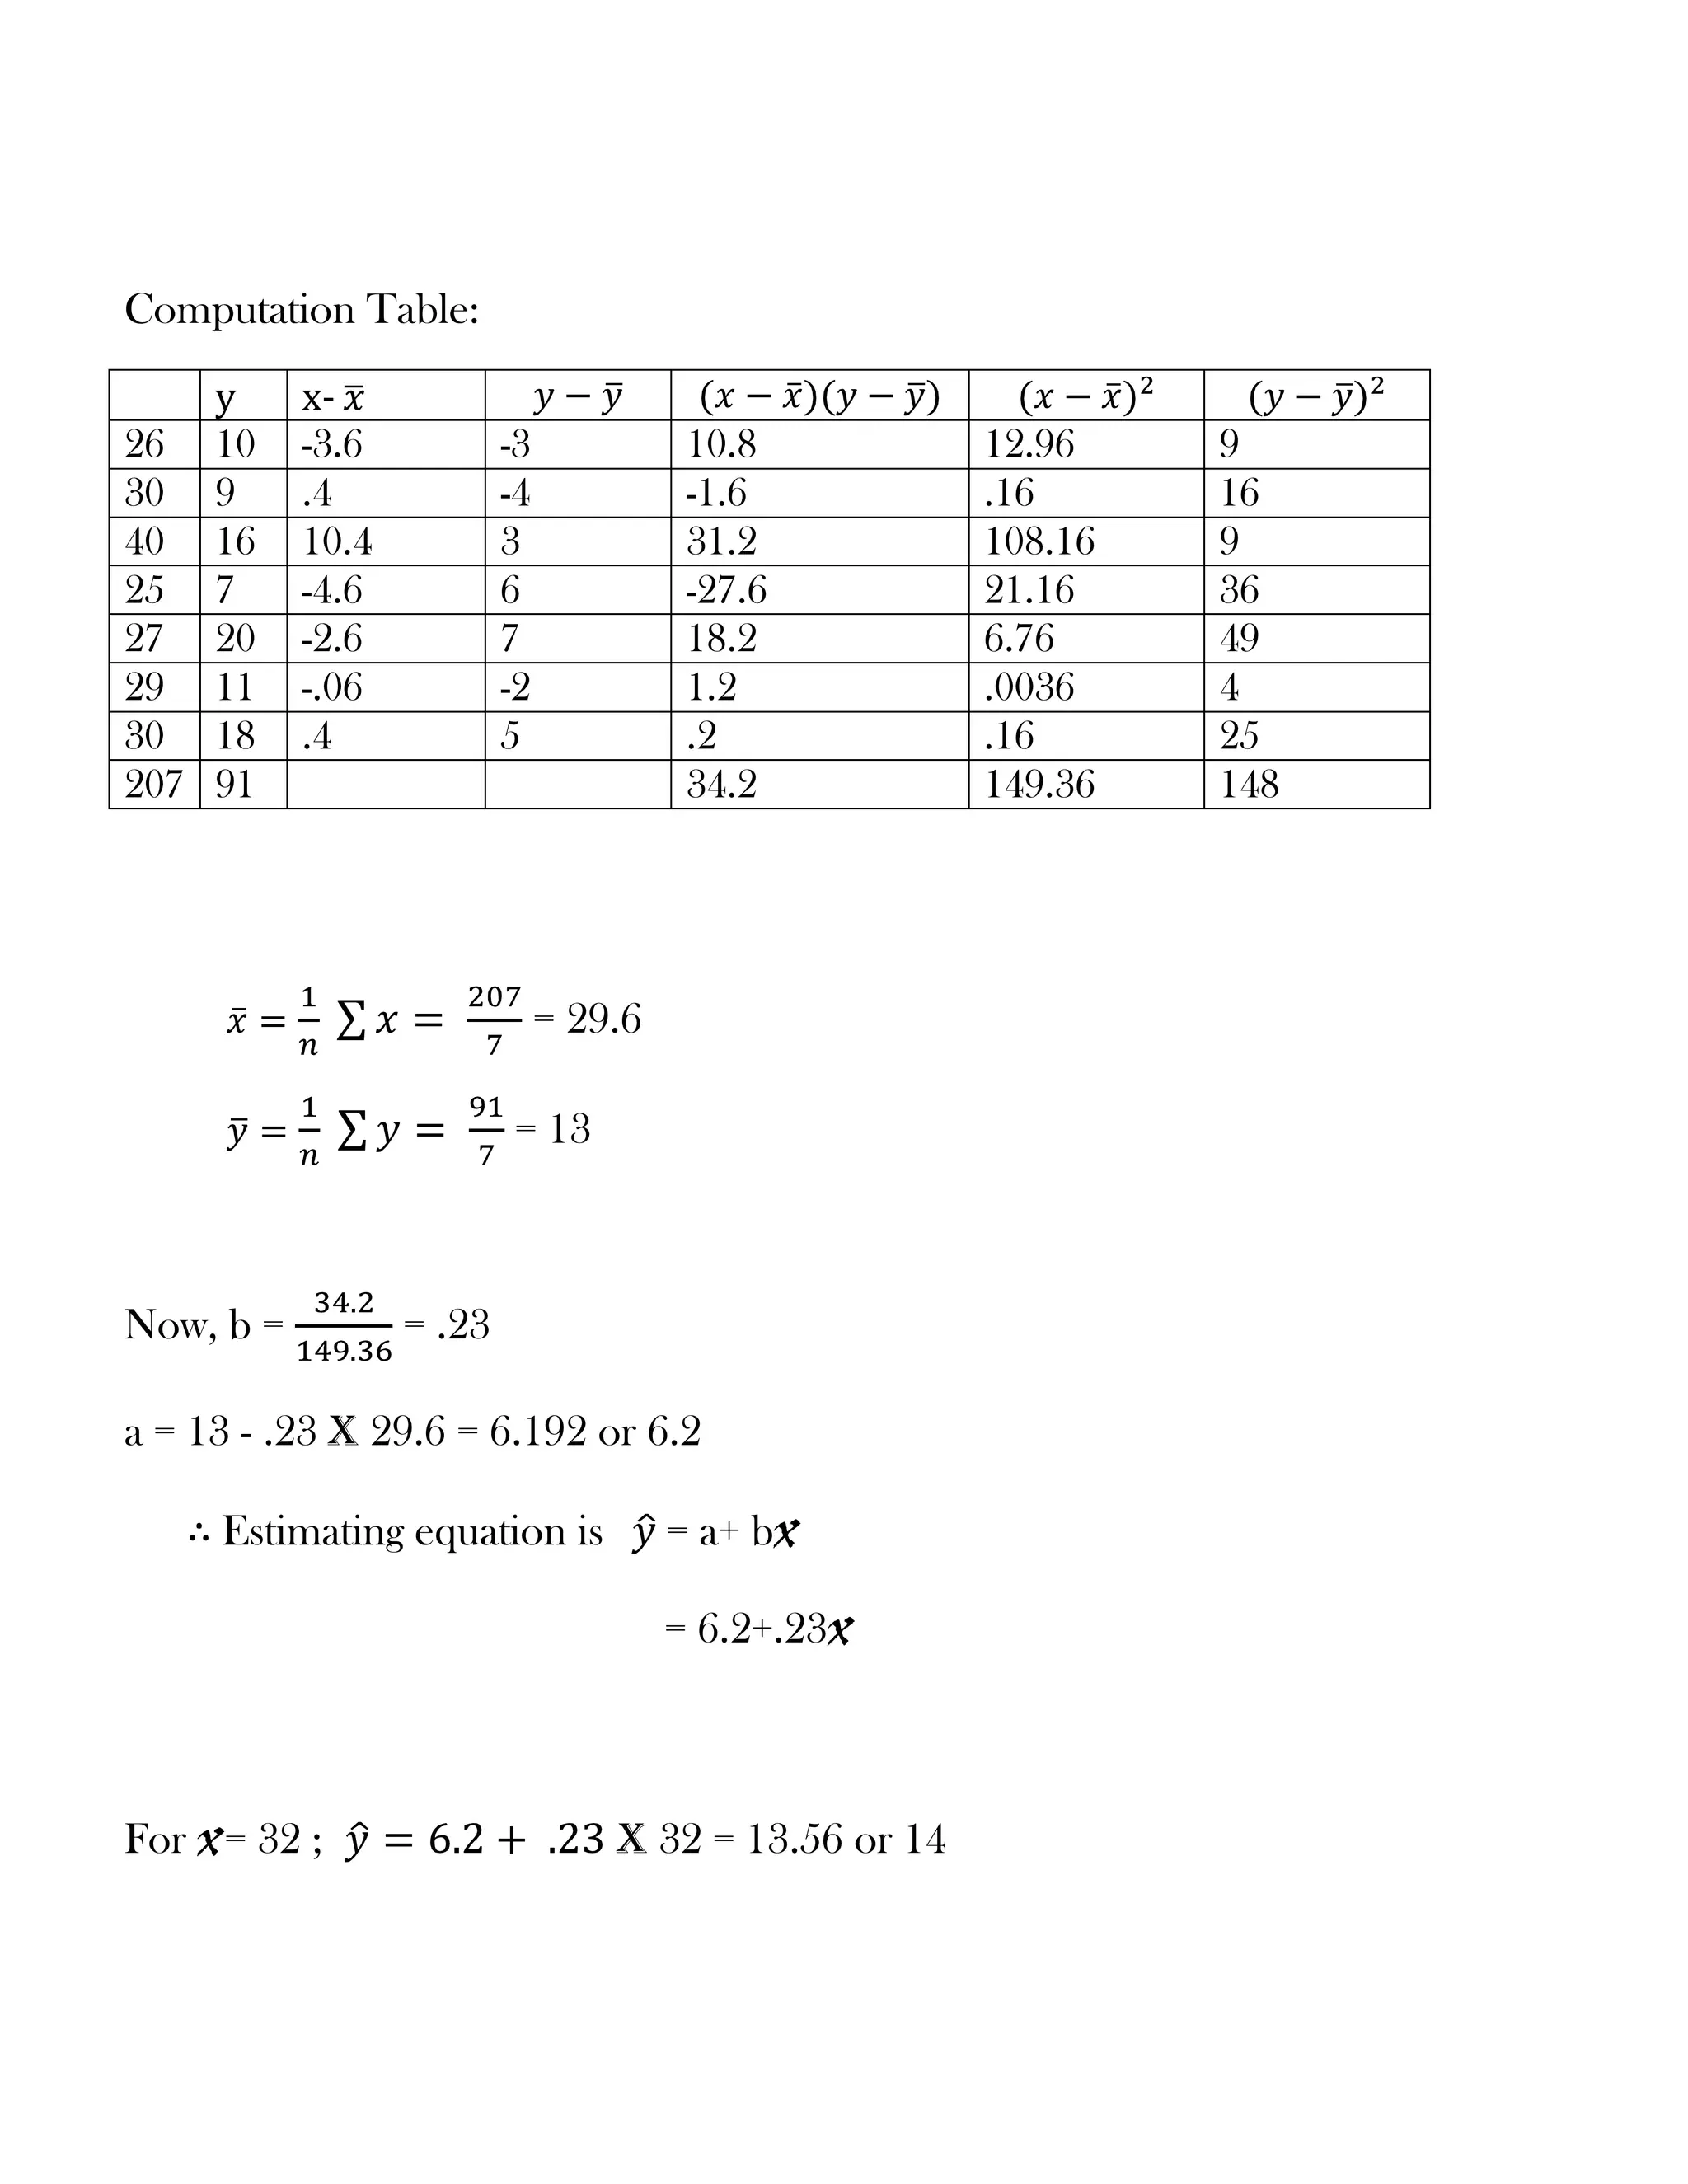
Assignment on Statistics<br />Regression and correlation of coefficient<br />Submitted To<br />Prof. Samad Abedin<br />Professor of Statistics<br />Department of Business Administration<br />International Islamic University Chittagong<br />Submitted By<br />Md. Moshaharul Haque<br />Student of 5th Semester<br />Roll: B091833<br />Batch: 30A1<br />International Islamic University Chittagong<br />Date: July 25, 2011<br />Question: Following data relate to the number of computer uses of several classes students.<br />No of Student: 26304025272930<br />No of Computer:109167201118<br />Identify the dependent (y) and the independent (x) variables.
Apprehend the relationship between x and y.
Obtain estimating equation for y and predict y for x=32, and x=26.
Find correlation coefficient between x and y & coefficient of determination.
Write a report on your findings.Solution: <br />Here, The dependent variable y = No of Computer<br />The independent variable x = No of Students<br />To apprehend relationship between x and y we draw scatter diagram:
From scatter diagram we apprehend that the relationship between x and y is somewhat positive and more or less linear.

Assignment on Corelation Coefficient

  • 1.
    Assignment on Statistics<br/>Regression and correlation of coefficient<br />Submitted To<br />Prof. Samad Abedin<br />Professor of Statistics<br />Department of Business Administration<br />International Islamic University Chittagong<br />Submitted By<br />Md. Moshaharul Haque<br />Student of 5th Semester<br />Roll: B091833<br />Batch: 30A1<br />International Islamic University Chittagong<br />Date: July 25, 2011<br />Question: Following data relate to the number of computer uses of several classes students.<br />No of Student: 26304025272930<br />No of Computer:109167201118<br />Identify the dependent (y) and the independent (x) variables.
  • 2.
  • 3.
    Obtain estimating equationfor y and predict y for x=32, and x=26.
  • 4.
    Find correlation coefficientbetween x and y & coefficient of determination.
  • 5.
    Write a reporton your findings.Solution: <br />Here, The dependent variable y = No of Computer<br />The independent variable x = No of Students<br />To apprehend relationship between x and y we draw scatter diagram:
  • 6.
    From scatter diagramwe apprehend that the relationship between x and y is somewhat positive and more or less linear.
  • 7.
  • 8.
    y =a+ bx
  • 9.
  • 10.
  • 11.
    a = y-bxComputation Table:<br />yx- xy-y(x-x)(y-y)(x-x)2(y-y)22610-3.6-310.812.969309.4-4-1.6.1616401610.4331.2108.169257-4.66-27.621.16362720-2.6718.26.76492911-.06-21.2.003643018.45.2.16252079134.2149.36148<br /> x= 1n x= 2077 = 29.6<br /> y= 1n y= 917 = 13<br />Now, b = 34.2149.36 = .23<br />a = 13 - .23 x 29.6 = 6.192 or 6.2<br />∴ Estimating equation is y = a+ bx
  • 12.
    = 6.2+.23xFor x= 32 ; y=6.2+ .23 x 32 = 13.56 or 14<br />For x= 26 ; y = 6.2 + .23 x 26 = 12.18 or 12<br />The correlation coefficient between x & y is :
  • 13.
  • 14.
    =34.2149.36 X 148
  • 15.
    =34.222105.28
  • 16.
    =34.2148.7
  • 17.
    =.23
  • 18.
    Report: for givendata, we apprehend somewhat positive & linear relation between no of students & no of computers & the relationship is positive but the evidence of linear relationship is strong. This evidence from regression coefficient b = .23 & r = .23. The coefficient of determination r2 = (.23)2 = .053 or 5.3% indicates that only 5.3% of total variation of computer only 5.3%. This explained by no of students.The End<br />