Download to read offline


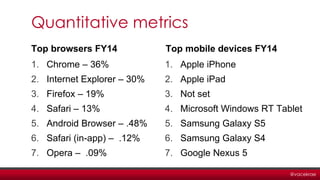
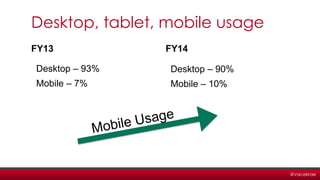
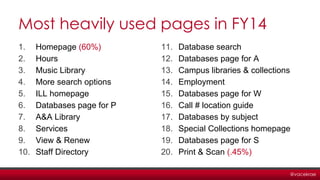


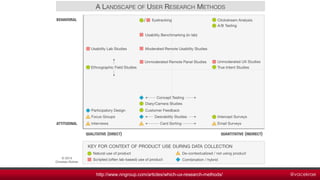


The presentation by Rachel Vacek at the OK-ACRL conference discusses assessing library websites through user research methods, including content audits, usability benchmarks, and analytics. It highlights key metrics from user data, such as browser and device usage, and emphasizes the importance of combining qualitative and quantitative insights for effective website maintenance. Tools for identifying user needs and improving findability and usability are also explored, along with potential benefits for library services.