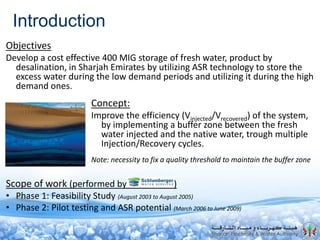
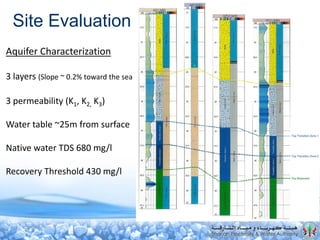
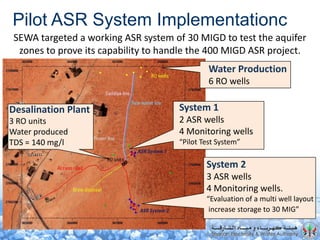
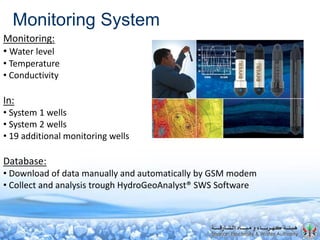
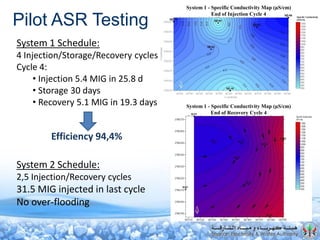
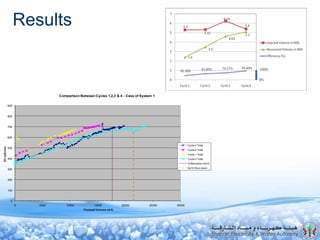
First Operational
Aquifer Storage and Recovery System (ASR)
Nizwa Site
Sharjah Emirates U.A.E.
• Introduction
• General Characterization
– Geology
– Hydrogeology
• Site Evaluation
– Geophysical Survey
– Drilling and Logging Survey
• Pilot ASR System Implementation
– System 1
– System 2
• Monitoring System
• Pilot ASR Testing: Injection/Storage/Recovery
• 3D Modeling
• Conclusions
Summary
Introduction
Objectives
Develop a cost effective 400 MIG storage of fresh water, product by
desalination, in Sharjah Emirates by utilizing ASR technology to store the
excess water during the low demand periods and utilizing it during the high
demand ones.
Scope of work (performed by )
• Phase 1: Feasibility Study (August 2003 to August 2005)
• Phase 2: Pilot testing and ASR potential (March 2006 to June 2009)
Concept:
Improve the efficiency (Vinjected/Vrecovered) of the system,
by implementing a buffer zone between the fresh
water injected and the native water, trough multiple
Injection/Recovery cycles.
Note: necessity to fix a quality threshold to maintain the buffer zone
General Characterization
DUBAI
ABU DHABI
OMAN
SHARJAH
Nizwa
Tawi Bakhit
Tawi Wohoush
Wadi Sadiya
5
Scale (km)
100
Outcrops
Flat areas
Initial field survey tracks
Field survey in Nizwa area
SEWA wells and wellfields
Fujairah pipeline
SEWA pipeline
SWS wells
Sharjah Emirates
– Arid desert climate zone
– Low rainfall
– High temperatures
Regional Stratigraphic Column
Geology
– Eolian deposits (sand dunes)
– Quaternary alluvium
(sand, gravel, interbeds of silt and clay)
– Fars Formation
(consolidated bedrocks)
General Characterization
Hydrogeology
Hydraulic gradient (i)
3 to 4 m/km SE to NW
Regional Water Level (m amsl)
Salinity values (TDS)
From 400 mg/l in the mountains
To 4000 mg/l in the Gulf
Regional TDS Values (mg/l)
Site Evaluation
Site Selection:
3 zones
Nizwa selected
Nizwa
Site Evaluation
Geophysical Survey
3D Resistivity Model
Site Evaluation
Drilling Campaign
Geophysical logging
A
D
B
C
Water Table
Base Zone 1
Base Zone 2
Site Evaluation
Aquifer Characterization
3 layers (Slope ~ 0.2% toward the sea
3 permeability (K1, K2, K3)
Water table ~25m from surface
Native water TDS 680 mg/l
Recovery Threshold 430 mg/l
SEWA targeted a working ASR system of 30 MIGD to test the aquifer
zones to prove its capability to handle the 400 MIGD ASR project.
Pilot ASR System Implementationc
System 1
2 ASR wells
4 Monitoring wells
“Pilot Test System”
System 2
3 ASR wells
4 Monitoring wells.
“Evaluation of a multi well layout
increase storage to 30 MIG”
Water Production
6 RO wells
Desalination Plant
3 RO units
Water produced
TDS = 140 mg/l
Monitoring System
Monitoring:
• Water level
• Temperature
• Conductivity
In:
• System 1 wells
• System 2 wells
• 19 additional monitoring wells
Database:
• Download of data manually and automatically by GSM modem
• Collect and analysis trough HydroGeoAnalyst® SWS Software
Pilot ASR Testing
System 1 Schedule:
4 Injection/Storage/Recovery cycles
Cycle 4:
• Injection 5.4 MIG in 25.8 d
• Storage 30 days
• Recovery 5.1 MIG in 19.3 days
System 2 Schedule:
2,5 Injection/Recovery cycles
31.5 MIG injected in last cycle
No over-flooding
Efficiency 94,4%
System 1 - Specific Conductivity Map (µS/cm)
End of Recovery Cycle 4
System 1 - Specific Conductivity Map (µS/cm)
End of Injection Cycle 4
Interpretation
Fresh Bubble Extent
Simulation
Drawdown - Mound
Scenarios - Predictions
Wellfield Development
3D Modeling Model creation
Calibration
on Monitored Data
Results
0
100
200
300
400
500
600
700
800
900
0 5000 10000 15000 20000 25000 30000
EC(uSi/cm)
Pumped Volume (m3)
Comparison Between Cycles 1,2,3 & 4 - Case of System 1
Cycle 3 Total
Cycle 2 Total
Cycle 1 Total
Cycle 4 Total
Q Reduction Nz10
Nz10 Shut down
Conclusions
The aquifer was found to be capable of storing the injected 30 MIG without
flooding.
Cycling improve the efficiency of the system to reach ~95%.
Geochemical analysis of native and injected waters has found no significant
risks of precipitation.
Based on the results and the numerical modeling Nizwa site was found to be
highly suitable for the development as a full ASR facility to bear 400 million
imperial gallons.
The work being carried out in the Emirate of Sharjah is an example of applying
a successful ASR technology to unconfined aquifer environments.
The water management strategies for SEWA are thus including the ASR as a
complementary source of water.
Thanks
Q/A

ASR_Sharjah_20091214_Presentation

  • 1.
    First Operational Aquifer Storageand Recovery System (ASR) Nizwa Site Sharjah Emirates U.A.E.
  • 2.
    • Introduction • GeneralCharacterization – Geology – Hydrogeology • Site Evaluation – Geophysical Survey – Drilling and Logging Survey • Pilot ASR System Implementation – System 1 – System 2 • Monitoring System • Pilot ASR Testing: Injection/Storage/Recovery • 3D Modeling • Conclusions Summary
  • 3.
    Introduction Objectives Develop a costeffective 400 MIG storage of fresh water, product by desalination, in Sharjah Emirates by utilizing ASR technology to store the excess water during the low demand periods and utilizing it during the high demand ones. Scope of work (performed by ) • Phase 1: Feasibility Study (August 2003 to August 2005) • Phase 2: Pilot testing and ASR potential (March 2006 to June 2009) Concept: Improve the efficiency (Vinjected/Vrecovered) of the system, by implementing a buffer zone between the fresh water injected and the native water, trough multiple Injection/Recovery cycles. Note: necessity to fix a quality threshold to maintain the buffer zone
  • 4.
    General Characterization DUBAI ABU DHABI OMAN SHARJAH Nizwa TawiBakhit Tawi Wohoush Wadi Sadiya 5 Scale (km) 100 Outcrops Flat areas Initial field survey tracks Field survey in Nizwa area SEWA wells and wellfields Fujairah pipeline SEWA pipeline SWS wells Sharjah Emirates – Arid desert climate zone – Low rainfall – High temperatures Regional Stratigraphic Column Geology – Eolian deposits (sand dunes) – Quaternary alluvium (sand, gravel, interbeds of silt and clay) – Fars Formation (consolidated bedrocks)
  • 5.
    General Characterization Hydrogeology Hydraulic gradient(i) 3 to 4 m/km SE to NW Regional Water Level (m amsl) Salinity values (TDS) From 400 mg/l in the mountains To 4000 mg/l in the Gulf Regional TDS Values (mg/l)
  • 6.
    Site Evaluation Site Selection: 3zones Nizwa selected Nizwa
  • 7.
  • 8.
    Site Evaluation Drilling Campaign Geophysicallogging A D B C Water Table Base Zone 1 Base Zone 2
  • 9.
    Site Evaluation Aquifer Characterization 3layers (Slope ~ 0.2% toward the sea 3 permeability (K1, K2, K3) Water table ~25m from surface Native water TDS 680 mg/l Recovery Threshold 430 mg/l
  • 10.
    SEWA targeted aworking ASR system of 30 MIGD to test the aquifer zones to prove its capability to handle the 400 MIGD ASR project. Pilot ASR System Implementationc System 1 2 ASR wells 4 Monitoring wells “Pilot Test System” System 2 3 ASR wells 4 Monitoring wells. “Evaluation of a multi well layout increase storage to 30 MIG” Water Production 6 RO wells Desalination Plant 3 RO units Water produced TDS = 140 mg/l
  • 11.
    Monitoring System Monitoring: • Waterlevel • Temperature • Conductivity In: • System 1 wells • System 2 wells • 19 additional monitoring wells Database: • Download of data manually and automatically by GSM modem • Collect and analysis trough HydroGeoAnalyst® SWS Software
  • 12.
    Pilot ASR Testing System1 Schedule: 4 Injection/Storage/Recovery cycles Cycle 4: • Injection 5.4 MIG in 25.8 d • Storage 30 days • Recovery 5.1 MIG in 19.3 days System 2 Schedule: 2,5 Injection/Recovery cycles 31.5 MIG injected in last cycle No over-flooding Efficiency 94,4% System 1 - Specific Conductivity Map (µS/cm) End of Recovery Cycle 4 System 1 - Specific Conductivity Map (µS/cm) End of Injection Cycle 4
  • 13.
    Interpretation Fresh Bubble Extent Simulation Drawdown- Mound Scenarios - Predictions Wellfield Development 3D Modeling Model creation Calibration on Monitored Data
  • 14.
    Results 0 100 200 300 400 500 600 700 800 900 0 5000 1000015000 20000 25000 30000 EC(uSi/cm) Pumped Volume (m3) Comparison Between Cycles 1,2,3 & 4 - Case of System 1 Cycle 3 Total Cycle 2 Total Cycle 1 Total Cycle 4 Total Q Reduction Nz10 Nz10 Shut down
  • 15.
    Conclusions The aquifer wasfound to be capable of storing the injected 30 MIG without flooding. Cycling improve the efficiency of the system to reach ~95%. Geochemical analysis of native and injected waters has found no significant risks of precipitation. Based on the results and the numerical modeling Nizwa site was found to be highly suitable for the development as a full ASR facility to bear 400 million imperial gallons. The work being carried out in the Emirate of Sharjah is an example of applying a successful ASR technology to unconfined aquifer environments. The water management strategies for SEWA are thus including the ASR as a complementary source of water.
  • 16.