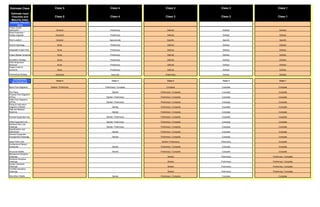
SlideShare a Scribd company logo
1 of 3
Download to read offline
Estimate Class

Class 5

Class 4

Class 3

Class 2

Class 1

LEVEL OF PROJECT
DEFINITION
Expressed as a % of
complete definition

0% to 2%

1% to 15%

10% to 40%

30% to 70%

50% to 100%

END USAGE
Typical
Purpose of Estimate

Concept Screening

Study or Feasibility

Budget Authorization, or Control

Control or Bid / Tender

Check Estimate or Bid / Tender

Capacity Factored, Parametric Models,
Judgment, or Analogy

Equipment Factored or Parametric Models

Semi-Detailed Unit Costs with Assembly Level
Line Items

Detailed Unit Cost with Forced Detailed TakeOff

Detailed Unit Cost with Detailed Take-Off

METHODOLOGY
Typical estimating
method
EXPECTED
ACCURACY RANGE
Typical variation in low
and high ranges [a]
PREPARATION
EFFORT
Typical
degree of effort relative
to least cost index of 1
[b]

L: -20% to -50%

H: +30% to +100%

L: -15% to -30%

H: +20% to +50%

L: -10% to -20%

H: +10% to +30%

L: -5% to -15%

H: +5% to +20%

L: -3% to -10%

H: +3% to +15%

END USAGE DEFINED

ESTIMATING
METHODS USED

EXPECTED
ACCURACY RANGE

2 to 4

3 to 10

4 to 20

5 to 100

Class 5 estimates are generally prepared based on very
limited information, and subsequently have very wide
accuracy ranges. As such, some companies and
organizations have elected to determine that due to the
inherent inaccuracies, such estimates cannot be classified in
a conventional and systematic manner. Class 5 estimates,
due to the requirements of end use, may be prepared within a
very limited amount of time and with very little effort
expended - sometimes requiring less than 1 hour to prepare.
Often, little more than proposed plant type, location, and
capacity are known at the time of estimate preparation.

Class 4 estimates are generally prepared based on very
limited information, and subsequently have very wide
accuracy ranges. They are typically used for project
screening, determination of feasibility, concept evaluation,
and preliminary budget approval. Typically, engineering is
from 1% to 5% complete, and would comprise at a minimum
the following: plant capacity, block schematics, indicated
layout, process flow diagrams (PFDs) for main process
systems and preliminary engineered process and utility
equipment lists. Level of Project Definition Required: 1% to
15% of full project definition.

Class 3 estimates are generally prepared to form the basis
for budget authorization, appropriation, and/or funding. As
such, they typically form the initial control estimate against
which all actual costs and resources will be monitored.
Typically, engineering is from 10% to 40% complete, and
would comprise at a minimum the following: process flow
diagrams, utility flow diagrams, preliminary piping and
instrument diagrams, utility flow diagrams, preliminary piping
and instrument diagrams, plot plan, developed layout
drawings, and essentially complete engineering process and
utility equipment lists. Level Of Project Definition Required:
10% to 40% of full project definition.

Class 2 estimates are generally prepared to form a detailed
control baseline against which all project work is monitored in
terms of cost and progress control. For contractors, this class
of estimate is often used as the "bid" estimate to establish
contract value. Typically, engineering is from 30% to 70%
complete, and would comprise at a minimum the following:
Process flow diagrams, utility flow diagrams, piping and
instrument flow diagrams, heat and material balances, final
plot plan, final layout drawings, complete engineered process
and utility equipment lists, single line diagrams for electrical,
electrical equipment and motor schedules, vendor quotations,
detailed project execution plans, resourcing and work force
plans, etc.

Class 1 estimates are generally prepared for discrete parts or
sections of the total project rather than generating this level of
detail for the entire project. The parts of the project estimated at
this level of detail will typically be used by subcontractors for
bids, or by owners for check estimates. The updated estimate is
often referred to as the current control estimate and becomes
the new baseline for cost/schedule control of the project. Class 1
estimates may be prepared for parts of the project to comprise a
fair price estimate or bid check estimate to compare against a
contractor's bid estimate, or to evaluate/dispute claims.
Typically, engineering is from 50% to 100% complete, and would
comprise virtually all engineering and design documentation of
the project, and complete project execution and commissioning
plans. Level for Project Definition Required: 50% to 100% of full
project definition.

Class 5 estimates are prepared for any number of strategic
business planning purposes, such as but not limited to
market studies, assessment of initial viability, evaluation of
alternate schemes, project screening, project location
studies, evaluation of resource needs and budgeting, longrange capital planning, etc.

Class 4 estimates are prepared for a number of purposes,
such as but not limited to, detailed strategic planning,
business development, project screening at more developed
stages, alternative scheme analysis, confirmation of
economic and/or technical feasibility, and preliminary budget
approval or approval to proceed to next stage.

Class 3 estimates are typically prepared to support full project
funding requests, and become the first of the project phase
"control estimate" against which all actual costs and
resources will be monitored for variations to the budget. They
are used as the project budget until replaced by more
detailed estimates. In many owner organizations, a Class 3
estimate may be the last estimate required and could well
form the only basis for cost/schedule control.

Class 2 estimates are typically prepared as the detailed
control baseline against which all actual costs an resources
will now be monitored for variation to the budget, and form a
part of the change/variation control program.

Class 1 estimates are typically prepared to form a current
control estimate to be used as the final control baseline against
which all actual coasts and resources will now be monitored for
variations to the budget, and form a part of the change/variation
control program. They may be used to evaluate bid checking, to
support vendor/contractor negotiations, or for claim evaluations
and dispute resolution.

Class 5 estimates virtually always use stochastic estimating
methods such as cost/capacity curves and factors, scale of
operations factors, Lang factors, Hand factors, Chilton
factors, Peters-Timmerhaus factors, Guthrie factors, and
other parametric and modeling techniques.

Class 4 estimates virtually always use stochastic estimating
methods such as cost/capacity curves and factors, scale of
operations factors, Lang factors, Hand factors, Chilton
factors, Peters-Timmerhaus factors, Guthrie factors, the
Miller method, gross unit costs/ratios, and other parametric
and modeling techniques.

Class 3 estimates usually involve more deterministic
estimating methods that stochastic methods. They usually
involve a high degree of unit cost line items, although these
may be at an assembly level of detail rather than individual
components. Factoring and other stochastic methods may be
used to estimate less-significant areas of the project.

Class 2 estimates always involve a high degree of
deterministic estimating methods. Class 2 estimates are
prepared in great detail, and often involve tens of thousands
of unit cost line items. For those areas of the project still
undefined, an assumed level of detailed takeoff (forced
detail) may be developed to use as line items in the estimate
instead of relying on factoring methods.

Class 1 estimates involve the highest degree of deterministic
estimating methods, and require a great amount of effort. Class
1 estimates are prepared in great detail, and thus are usually
performed on only the most important or critical areas of the
project. All items in the estimate are usually unit cost line items
based on actual design quantities.

Typical accuracy ranges for Class 5 estimates are -20% to
50% on the low side, and +30% to +100% on the high side,
depending on the technological complexity of the project,
appropriate contingency determination. Ranges could exceed
those shown in unusual circumstances.

Typical accuracy ranges for Class 4 estimates are -15% to
-30% on the low side, and +20% to +50% on the high side,
depending on the technological complexity of the project,
appropriate reference information, and the inclusion of an
appropriate contingency determination. Ranges could exceed
those shown in unusual circumstances.

Typical accuracy ranges for Class 3 estimates are -10% to 20% on the low side, and +10% to +30% on the high side,
depending on the technological complexity of the project,
appropriate reference information, and the inclusion of an
appropriate contingency determination. Ranges could exceed
those shown in unusual circumstances.

Typical accuracy ranges for Class 2 estimates are -5% to 15% on the low side, and +5% to +20% on the high side,
depending on the technological complexity of the project,
appropriate reference information, and the inclusion of an
appropriate contingency determination. Ranges could exceed
those shown in unusual circumstances.

Typical accuracy ranges for Class 1 estimates are -3% to
10% on the low side, and +3% to +15% on the high side,
depending on the technological complexity of the project,
appropriate reference information, and the inclusion of an
appropriate contingency determination. Ranges could exceed
those shown in unusual circumstances.

As little as 1 hour or less to prepare to perhaps more than
200 hours, depending on the project and the estimating
methodology used.

REFINED CLASS
DEFINITION

1

Typically, as little as 20 hours or less to perhaps more than
300 hours, depending on the project and the estimating
methodology used.

Typically, as little as 150 hours or less to perhaps more than
1500 hours, depending on the project and the estimating
methodology used.

Typically, as little as 300 hours or less to perhaps more than
3000 hours, depending on the project and the estimating
methodology used. Bid Estimates typically require more effort
than estimates used for funding or control purposes

Class 1 estimates require the most effort to create, and as such
are generally developed for only selected areas of the project, or
for bidding purposes. A complete Class 1 estimate may involve
as little as 600 hours or less, to perhaps more than 6,000 hours,
depending on the project and the estimating methodology used.
Bid estimate typically require more effort than estimates used for
funding or control purposes.

Order of Magnitude Estimate; Ratio, ballpark, blue sky, seatof-pants, ROM, idea study, prospect estimate, concession
license estimate, guesstimate, rule-of thumb.

Budget Estimate; Screening, top-down, feasibility,
authorization, factored, pre-design, pre-study.

Budget Estimate; Budget, scope, sanction, semi-detailed,
authorization, preliminary control, concept study,
development, basic engineering phase estimate, target
estimate.

Definitive Estimate; Detailed Control, forced detail, execution
phase, master control, engineering, bid, tender, change order
estimate.

Definitive Estimate; Full detail, release, fall-out, tender, firm
price, bottoms-up, final, detailed control, forced detail, execution
phase, master control, fair price, definitive, change order
estimate.

EFFORT TO PREPARE
(for US$20MM project):

ANSI Standard
Reference Z94.2-1989
name; Alternate
Estimate Names,
Terms, Expressions,
Synonyms:
Estimate Class

Class 5

Class 4

Class 3

Class 2

Class 1

Estimate Input
Checklist and
Maturity Index

Class 5

Class 4

Class 3

Class 2

Class 1

General

Preliminary

Defined

Defined

Defined

Assumed

Preliminary

Defined

Defined

Defined

General

Approximate

Specific

Specific

Specific

Soils & Hydrology

None

Preliminary

Defined

Defined

Defined

Integrated Project Plan

None

Preliminary

Defined

Defined

Defined

Project Master Schedule

None

Preliminary

Defined

Defined

Defined

Escalation Strategy
Work Breakdown
Structure
Project Code of
Accounts

None

Preliminary

Defined

Defined

Defined

None

Preliminary

Defined

Defined

Defined

None

Preliminary

Defined

Defined

Defined

Contracting Strategy

Assumed

Assumed

Preliminary

Defined

Defined

Class 5

Class 4

Class 3

Class 2

Class 1

Started / Preliminary

Preliminary / Complete

Complete

Complete

Complete

Started

Preliminary / Complete

Complete

Complete

Started / Preliminary

Preliminary / Complete

Complete

Complete

Started / Preliminary

Preliminary / Complete

Complete

Complete

Started

Preliminary / Complete

Complete

Complete

Started

Preliminary / Complete

Complete

Complete

Process Equipment List

Started / Preliminary

Preliminary / Complete

Complete

Complete

Utility Equipment List
Electrical One Line
Drawings
Specifications and
Datasheets
General Equipment
Arrangement Drawings

Started / Preliminary

Preliminary / Complete

Complete

Complete

Started / Preliminary

Preliminary / Complete

Complete

Complete

Started

Preliminary / Complete

Complete

Complete

Started

Preliminary / Complete

Complete

Complete

Started / Preliminary

Preliminary

Complete

Started

Preliminary / Complete

Complete

Complete

Structural Details
Mechanical Discipline
Drawings
Electrical Discipline
Drawings
System Discipline
Drawings
Civil/Site Discipline
Drawings

Started

Preliminary / Complete

Complete

Complete

Started

Preliminary

Preliminary / Complete

Started

Preliminary

Preliminary / Complete

Started

Preliminary

Preliminary / Complete

Started

Preliminary

Preliminary / Complete

Demolition Details

Started

Preliminary / Complete

Complete

Complete

GENERAL PROJECT
DATA
Project Scope
Description
Plant Production /
Facility Capacity
Plant Location

ENGINEERING
DELIVERABLES:
Block Flow Diagrams
Plot Plans
Process Flow Diagrams
(PFDs)
Utility Flow Diagrams
(UFDs)
Piping & Instrument
Diagrams (P&IDS)
Heat and Material
Balances

Spare Parts Lists
Architectural Details /
Schedules
Page 3

Estimating Accuracy Curve

0%

Estimate CLASS.XLS

(Source: Derived from AACE Data; 18R-97)

Engineering %

100

Engineering Completion (%)

Page 3

Estimate CLASS.XLS

More Related Content

What's hot

How Traditional Risk Reporting Has Let Us Down
How Traditional Risk Reporting Has Let Us DownHow Traditional Risk Reporting Has Let Us Down
How Traditional Risk Reporting Has Let Us DownAcumen
 
Javier Garcia - Verdugo Sanchez - Six Sigma Training - W1 Risk Analysis
Javier Garcia - Verdugo Sanchez - Six Sigma Training - W1 Risk AnalysisJavier Garcia - Verdugo Sanchez - Six Sigma Training - W1 Risk Analysis
Javier Garcia - Verdugo Sanchez - Six Sigma Training - W1 Risk AnalysisJ. García - Verdugo
 
DRW - Quality Function Deployment.PDF
DRW - Quality Function Deployment.PDFDRW - Quality Function Deployment.PDF
DRW - Quality Function Deployment.PDFDavid Wollover, CISSP
 
Establishing schedule margin using monte carlo simulation
Establishing schedule margin using monte carlo simulation Establishing schedule margin using monte carlo simulation
Establishing schedule margin using monte carlo simulation Glen Alleman
 
Cpm500 d _alleman__tpm lesson 3 (v1)
Cpm500 d _alleman__tpm lesson 3 (v1)Cpm500 d _alleman__tpm lesson 3 (v1)
Cpm500 d _alleman__tpm lesson 3 (v1)Glen Alleman
 
Practical Application Of System Safety For Performance Improvement
Practical Application Of System Safety For Performance ImprovementPractical Application Of System Safety For Performance Improvement
Practical Application Of System Safety For Performance ImprovementAlbert V. Condello III CSP CHMM
 
Risk Analysis PowerPoint Presentation Slides
Risk Analysis PowerPoint Presentation Slides Risk Analysis PowerPoint Presentation Slides
Risk Analysis PowerPoint Presentation Slides SlideTeam
 
م.32 - #تواصل_تطوير-م.حسام قنديل- " رؤية متجددة لتحليل المطالبات
م.32 -  #تواصل_تطوير-م.حسام قنديل- " رؤية متجددة لتحليل المطالباتم.32 -  #تواصل_تطوير-م.حسام قنديل- " رؤية متجددة لتحليل المطالبات
م.32 - #تواصل_تطوير-م.حسام قنديل- " رؤية متجددة لتحليل المطالباتEgyptian Engineers Association
 
Gear up Your Career with ASQ Certified Reliability Engineer (CRE) Certification
Gear up Your Career with ASQ Certified Reliability Engineer (CRE) CertificationGear up Your Career with ASQ Certified Reliability Engineer (CRE) Certification
Gear up Your Career with ASQ Certified Reliability Engineer (CRE) CertificationMeghna Arora
 
How to perform time impact analysis (TIA)
How to perform time impact analysis (TIA)How to perform time impact analysis (TIA)
How to perform time impact analysis (TIA)Amr Morsy
 
Primavera Monte Carlo[1]
Primavera Monte Carlo[1]Primavera Monte Carlo[1]
Primavera Monte Carlo[1]Mihai Buta
 
Acumen Fuse Metrics & Descriptions Guide
Acumen Fuse Metrics & Descriptions GuideAcumen Fuse Metrics & Descriptions Guide
Acumen Fuse Metrics & Descriptions GuideAcumen
 
Adopting the Quadratic Mean Process to Quantify the Qualitative Risk Analysis
Adopting the Quadratic Mean Process to Quantify the Qualitative Risk AnalysisAdopting the Quadratic Mean Process to Quantify the Qualitative Risk Analysis
Adopting the Quadratic Mean Process to Quantify the Qualitative Risk AnalysisRicardo Viana Vargas
 

What's hot (20)

How Traditional Risk Reporting Has Let Us Down
How Traditional Risk Reporting Has Let Us DownHow Traditional Risk Reporting Has Let Us Down
How Traditional Risk Reporting Has Let Us Down
 
Getting it Right
Getting it Right Getting it Right
Getting it Right
 
risk analysis
 risk analysis risk analysis
risk analysis
 
Clt Six Sigma Glossary
Clt Six Sigma GlossaryClt Six Sigma Glossary
Clt Six Sigma Glossary
 
Javier Garcia - Verdugo Sanchez - Six Sigma Training - W1 Risk Analysis
Javier Garcia - Verdugo Sanchez - Six Sigma Training - W1 Risk AnalysisJavier Garcia - Verdugo Sanchez - Six Sigma Training - W1 Risk Analysis
Javier Garcia - Verdugo Sanchez - Six Sigma Training - W1 Risk Analysis
 
DRW - Quality Function Deployment.PDF
DRW - Quality Function Deployment.PDFDRW - Quality Function Deployment.PDF
DRW - Quality Function Deployment.PDF
 
Establishing schedule margin using monte carlo simulation
Establishing schedule margin using monte carlo simulation Establishing schedule margin using monte carlo simulation
Establishing schedule margin using monte carlo simulation
 
Cpm500 d _alleman__tpm lesson 3 (v1)
Cpm500 d _alleman__tpm lesson 3 (v1)Cpm500 d _alleman__tpm lesson 3 (v1)
Cpm500 d _alleman__tpm lesson 3 (v1)
 
Practical Application Of System Safety For Performance Improvement
Practical Application Of System Safety For Performance ImprovementPractical Application Of System Safety For Performance Improvement
Practical Application Of System Safety For Performance Improvement
 
ESTIMATING.pdf
ESTIMATING.pdfESTIMATING.pdf
ESTIMATING.pdf
 
Risk analysis
Risk analysis  Risk analysis
Risk analysis
 
Risk Analysis PowerPoint Presentation Slides
Risk Analysis PowerPoint Presentation Slides Risk Analysis PowerPoint Presentation Slides
Risk Analysis PowerPoint Presentation Slides
 
م.32 - #تواصل_تطوير-م.حسام قنديل- " رؤية متجددة لتحليل المطالبات
م.32 -  #تواصل_تطوير-م.حسام قنديل- " رؤية متجددة لتحليل المطالباتم.32 -  #تواصل_تطوير-م.حسام قنديل- " رؤية متجددة لتحليل المطالبات
م.32 - #تواصل_تطوير-م.حسام قنديل- " رؤية متجددة لتحليل المطالبات
 
Gear up Your Career with ASQ Certified Reliability Engineer (CRE) Certification
Gear up Your Career with ASQ Certified Reliability Engineer (CRE) CertificationGear up Your Career with ASQ Certified Reliability Engineer (CRE) Certification
Gear up Your Career with ASQ Certified Reliability Engineer (CRE) Certification
 
Risk analysis
Risk analysisRisk analysis
Risk analysis
 
How to perform time impact analysis (TIA)
How to perform time impact analysis (TIA)How to perform time impact analysis (TIA)
How to perform time impact analysis (TIA)
 
Primavera Monte Carlo[1]
Primavera Monte Carlo[1]Primavera Monte Carlo[1]
Primavera Monte Carlo[1]
 
Acumen Fuse Metrics & Descriptions Guide
Acumen Fuse Metrics & Descriptions GuideAcumen Fuse Metrics & Descriptions Guide
Acumen Fuse Metrics & Descriptions Guide
 
A Brief Concept of Quality
A Brief Concept of QualityA Brief Concept of Quality
A Brief Concept of Quality
 
Adopting the Quadratic Mean Process to Quantify the Qualitative Risk Analysis
Adopting the Quadratic Mean Process to Quantify the Qualitative Risk AnalysisAdopting the Quadratic Mean Process to Quantify the Qualitative Risk Analysis
Adopting the Quadratic Mean Process to Quantify the Qualitative Risk Analysis
 

Viewers also liked

Epc proposal 3x660 mw with cost analysis
Epc proposal 3x660 mw with cost analysisEpc proposal 3x660 mw with cost analysis
Epc proposal 3x660 mw with cost analysisNikhil Kumar Rai
 
Procurement Contract Types | PMP | iZenBridge - Webinar
Procurement Contract Types | PMP | iZenBridge - Webinar Procurement Contract Types | PMP | iZenBridge - Webinar
Procurement Contract Types | PMP | iZenBridge - Webinar Saket Bansal
 
Analysis of rates for labour and material
Analysis of rates for labour and materialAnalysis of rates for labour and material
Analysis of rates for labour and materialALI HYDER GADHI
 
Estimation and costing
Estimation and costingEstimation and costing
Estimation and costingGanesh Murugan
 
types of Foundations with animated sketches
types of Foundations with animated sketchestypes of Foundations with animated sketches
types of Foundations with animated sketchesGiri Babu S V
 
Estimating and-costing book
Estimating and-costing bookEstimating and-costing book
Estimating and-costing bookThomas Britto
 
CONTRACTS AND ITS TYPES
CONTRACTS AND ITS TYPESCONTRACTS AND ITS TYPES
CONTRACTS AND ITS TYPESPundlik Rathod
 

Viewers also liked (10)

Epc proposal 3x660 mw with cost analysis
Epc proposal 3x660 mw with cost analysisEpc proposal 3x660 mw with cost analysis
Epc proposal 3x660 mw with cost analysis
 
Procurement Contract Types | PMP | iZenBridge - Webinar
Procurement Contract Types | PMP | iZenBridge - Webinar Procurement Contract Types | PMP | iZenBridge - Webinar
Procurement Contract Types | PMP | iZenBridge - Webinar
 
BASIC CIVIL ENGINEERING
BASIC CIVIL ENGINEERINGBASIC CIVIL ENGINEERING
BASIC CIVIL ENGINEERING
 
Analysis of rates for labour and material
Analysis of rates for labour and materialAnalysis of rates for labour and material
Analysis of rates for labour and material
 
Foundation
FoundationFoundation
Foundation
 
Estimation and costing
Estimation and costingEstimation and costing
Estimation and costing
 
TYPES OF FOUNDATION(PPT)
TYPES OF FOUNDATION(PPT)TYPES OF FOUNDATION(PPT)
TYPES OF FOUNDATION(PPT)
 
types of Foundations with animated sketches
types of Foundations with animated sketchestypes of Foundations with animated sketches
types of Foundations with animated sketches
 
Estimating and-costing book
Estimating and-costing bookEstimating and-costing book
Estimating and-costing book
 
CONTRACTS AND ITS TYPES
CONTRACTS AND ITS TYPESCONTRACTS AND ITS TYPES
CONTRACTS AND ITS TYPES
 

Similar to Aspen EPC contracts Estimate classes

EstimatingGuidelines.pdf
EstimatingGuidelines.pdfEstimatingGuidelines.pdf
EstimatingGuidelines.pdfIctsol
 
Capital Expenditure Estimating Cost of Project
Capital Expenditure Estimating Cost of ProjectCapital Expenditure Estimating Cost of Project
Capital Expenditure Estimating Cost of ProjectArvinThamsir1
 
Capital Cost Expenditure Estimating .ppt
Capital Cost Expenditure Estimating .pptCapital Cost Expenditure Estimating .ppt
Capital Cost Expenditure Estimating .pptArvinThamsir1
 
Estimation guidelines and templates
Estimation guidelines and templatesEstimation guidelines and templates
Estimation guidelines and templatesHoa PN Thaycacac
 
Pmbok 5th planning process group part three
Pmbok 5th planning process group part threePmbok 5th planning process group part three
Pmbok 5th planning process group part threeHossam Maghrabi
 
Cost management
Cost managementCost management
Cost managementshkadry
 
Project Estimation Project Estimation Project Estimation
Project Estimation Project Estimation Project EstimationProject Estimation Project Estimation Project Estimation
Project Estimation Project Estimation Project EstimationVandalRay
 
Draft CE-74 v03 for MAIN review
Draft CE-74 v03 for MAIN reviewDraft CE-74 v03 for MAIN review
Draft CE-74 v03 for MAIN reviewNesma
 
46R-11 Skills & Knowledge of Cost Estimators.pdf
46R-11 Skills & Knowledge of Cost Estimators.pdf46R-11 Skills & Knowledge of Cost Estimators.pdf
46R-11 Skills & Knowledge of Cost Estimators.pdfssuserad21d8
 
Quality planning in project management
Quality planning in project managementQuality planning in project management
Quality planning in project managementselinasimpson1001
 
project cost management.pptx
project cost management.pptxproject cost management.pptx
project cost management.pptxInayatSheikh1
 
IRJET- Overview of Forecasting Techniques
IRJET- Overview of Forecasting TechniquesIRJET- Overview of Forecasting Techniques
IRJET- Overview of Forecasting TechniquesIRJET Journal
 
PMP GLOSSARY
PMP GLOSSARYPMP GLOSSARY
PMP GLOSSARYSoumya De
 
advanced project management mod 5
advanced project management mod 5advanced project management mod 5
advanced project management mod 5POOJA UDAYAN
 
Level TwoSupply Chain ManagementStrategic Supply Cha.docx
Level TwoSupply Chain ManagementStrategic Supply Cha.docxLevel TwoSupply Chain ManagementStrategic Supply Cha.docx
Level TwoSupply Chain ManagementStrategic Supply Cha.docxsmile790243
 

Similar to Aspen EPC contracts Estimate classes (20)

EstimatingGuidelines.pdf
EstimatingGuidelines.pdfEstimatingGuidelines.pdf
EstimatingGuidelines.pdf
 
Capital Expenditure Estimating Cost of Project
Capital Expenditure Estimating Cost of ProjectCapital Expenditure Estimating Cost of Project
Capital Expenditure Estimating Cost of Project
 
Capital Cost Expenditure Estimating .ppt
Capital Cost Expenditure Estimating .pptCapital Cost Expenditure Estimating .ppt
Capital Cost Expenditure Estimating .ppt
 
Estimation guidelines and templates
Estimation guidelines and templatesEstimation guidelines and templates
Estimation guidelines and templates
 
Pmbok 5th planning process group part three
Pmbok 5th planning process group part threePmbok 5th planning process group part three
Pmbok 5th planning process group part three
 
Cost management
Cost managementCost management
Cost management
 
Project Estimation Project Estimation Project Estimation
Project Estimation Project Estimation Project EstimationProject Estimation Project Estimation Project Estimation
Project Estimation Project Estimation Project Estimation
 
Draft CE-74 v03 for MAIN review
Draft CE-74 v03 for MAIN reviewDraft CE-74 v03 for MAIN review
Draft CE-74 v03 for MAIN review
 
Project mgt
Project mgtProject mgt
Project mgt
 
46R-11 Skills & Knowledge of Cost Estimators.pdf
46R-11 Skills & Knowledge of Cost Estimators.pdf46R-11 Skills & Knowledge of Cost Estimators.pdf
46R-11 Skills & Knowledge of Cost Estimators.pdf
 
Quality planning in project management
Quality planning in project managementQuality planning in project management
Quality planning in project management
 
Quality management strategy
Quality management strategyQuality management strategy
Quality management strategy
 
project cost management.pptx
project cost management.pptxproject cost management.pptx
project cost management.pptx
 
IRJET- Overview of Forecasting Techniques
IRJET- Overview of Forecasting TechniquesIRJET- Overview of Forecasting Techniques
IRJET- Overview of Forecasting Techniques
 
PMP GLOSSARY
PMP GLOSSARYPMP GLOSSARY
PMP GLOSSARY
 
Presentation on Quality Management
Presentation on Quality ManagementPresentation on Quality Management
Presentation on Quality Management
 
advanced project management mod 5
advanced project management mod 5advanced project management mod 5
advanced project management mod 5
 
Level TwoSupply Chain ManagementStrategic Supply Cha.docx
Level TwoSupply Chain ManagementStrategic Supply Cha.docxLevel TwoSupply Chain ManagementStrategic Supply Cha.docx
Level TwoSupply Chain ManagementStrategic Supply Cha.docx
 
4. project cost management
4. project cost management4. project cost management
4. project cost management
 
Derating value FMS Reliability
Derating value FMS ReliabilityDerating value FMS Reliability
Derating value FMS Reliability
 

Recently uploaded

Sports & Fitness Value Added Course FY..
Sports & Fitness Value Added Course FY..Sports & Fitness Value Added Course FY..
Sports & Fitness Value Added Course FY..Disha Kariya
 
Measures of Dispersion and Variability: Range, QD, AD and SD
Measures of Dispersion and Variability: Range, QD, AD and SDMeasures of Dispersion and Variability: Range, QD, AD and SD
Measures of Dispersion and Variability: Range, QD, AD and SDThiyagu K
 
A Critique of the Proposed National Education Policy Reform
A Critique of the Proposed National Education Policy ReformA Critique of the Proposed National Education Policy Reform
A Critique of the Proposed National Education Policy ReformChameera Dedduwage
 
Software Engineering Methodologies (overview)
Software Engineering Methodologies (overview)Software Engineering Methodologies (overview)
Software Engineering Methodologies (overview)eniolaolutunde
 
social pharmacy d-pharm 1st year by Pragati K. Mahajan
social pharmacy d-pharm 1st year by Pragati K. Mahajansocial pharmacy d-pharm 1st year by Pragati K. Mahajan
social pharmacy d-pharm 1st year by Pragati K. Mahajanpragatimahajan3
 
Nutritional Needs Presentation - HLTH 104
Nutritional Needs Presentation - HLTH 104Nutritional Needs Presentation - HLTH 104
Nutritional Needs Presentation - HLTH 104misteraugie
 
Ecosystem Interactions Class Discussion Presentation in Blue Green Lined Styl...
Ecosystem Interactions Class Discussion Presentation in Blue Green Lined Styl...Ecosystem Interactions Class Discussion Presentation in Blue Green Lined Styl...
Ecosystem Interactions Class Discussion Presentation in Blue Green Lined Styl...fonyou31
 
Q4-W6-Restating Informational Text Grade 3
Q4-W6-Restating Informational Text Grade 3Q4-W6-Restating Informational Text Grade 3
Q4-W6-Restating Informational Text Grade 3JemimahLaneBuaron
 
Measures of Central Tendency: Mean, Median and Mode
Measures of Central Tendency: Mean, Median and ModeMeasures of Central Tendency: Mean, Median and Mode
Measures of Central Tendency: Mean, Median and ModeThiyagu K
 
Web & Social Media Analytics Previous Year Question Paper.pdf
Web & Social Media Analytics Previous Year Question Paper.pdfWeb & Social Media Analytics Previous Year Question Paper.pdf
Web & Social Media Analytics Previous Year Question Paper.pdfJayanti Pande
 
CARE OF CHILD IN INCUBATOR..........pptx
CARE OF CHILD IN INCUBATOR..........pptxCARE OF CHILD IN INCUBATOR..........pptx
CARE OF CHILD IN INCUBATOR..........pptxGaneshChakor2
 
Activity 01 - Artificial Culture (1).pdf
Activity 01 - Artificial Culture (1).pdfActivity 01 - Artificial Culture (1).pdf
Activity 01 - Artificial Culture (1).pdfciinovamais
 
The byproduct of sericulture in different industries.pptx
The byproduct of sericulture in different industries.pptxThe byproduct of sericulture in different industries.pptx
The byproduct of sericulture in different industries.pptxShobhayan Kirtania
 
Z Score,T Score, Percential Rank and Box Plot Graph
Z Score,T Score, Percential Rank and Box Plot GraphZ Score,T Score, Percential Rank and Box Plot Graph
Z Score,T Score, Percential Rank and Box Plot GraphThiyagu K
 
BASLIQ CURRENT LOOKBOOK LOOKBOOK(1) (1).pdf
BASLIQ CURRENT LOOKBOOK  LOOKBOOK(1) (1).pdfBASLIQ CURRENT LOOKBOOK  LOOKBOOK(1) (1).pdf
BASLIQ CURRENT LOOKBOOK LOOKBOOK(1) (1).pdfSoniaTolstoy
 
Grant Readiness 101 TechSoup and Remy Consulting
Grant Readiness 101 TechSoup and Remy ConsultingGrant Readiness 101 TechSoup and Remy Consulting
Grant Readiness 101 TechSoup and Remy ConsultingTechSoup
 
Sanyam Choudhary Chemistry practical.pdf
Sanyam Choudhary Chemistry practical.pdfSanyam Choudhary Chemistry practical.pdf
Sanyam Choudhary Chemistry practical.pdfsanyamsingh5019
 
APM Welcome, APM North West Network Conference, Synergies Across Sectors
APM Welcome, APM North West Network Conference, Synergies Across SectorsAPM Welcome, APM North West Network Conference, Synergies Across Sectors
APM Welcome, APM North West Network Conference, Synergies Across SectorsAssociation for Project Management
 

Recently uploaded (20)

Sports & Fitness Value Added Course FY..
Sports & Fitness Value Added Course FY..Sports & Fitness Value Added Course FY..
Sports & Fitness Value Added Course FY..
 
Measures of Dispersion and Variability: Range, QD, AD and SD
Measures of Dispersion and Variability: Range, QD, AD and SDMeasures of Dispersion and Variability: Range, QD, AD and SD
Measures of Dispersion and Variability: Range, QD, AD and SD
 
A Critique of the Proposed National Education Policy Reform
A Critique of the Proposed National Education Policy ReformA Critique of the Proposed National Education Policy Reform
A Critique of the Proposed National Education Policy Reform
 
Software Engineering Methodologies (overview)
Software Engineering Methodologies (overview)Software Engineering Methodologies (overview)
Software Engineering Methodologies (overview)
 
social pharmacy d-pharm 1st year by Pragati K. Mahajan
social pharmacy d-pharm 1st year by Pragati K. Mahajansocial pharmacy d-pharm 1st year by Pragati K. Mahajan
social pharmacy d-pharm 1st year by Pragati K. Mahajan
 
Nutritional Needs Presentation - HLTH 104
Nutritional Needs Presentation - HLTH 104Nutritional Needs Presentation - HLTH 104
Nutritional Needs Presentation - HLTH 104
 
Ecosystem Interactions Class Discussion Presentation in Blue Green Lined Styl...
Ecosystem Interactions Class Discussion Presentation in Blue Green Lined Styl...Ecosystem Interactions Class Discussion Presentation in Blue Green Lined Styl...
Ecosystem Interactions Class Discussion Presentation in Blue Green Lined Styl...
 
Q4-W6-Restating Informational Text Grade 3
Q4-W6-Restating Informational Text Grade 3Q4-W6-Restating Informational Text Grade 3
Q4-W6-Restating Informational Text Grade 3
 
Measures of Central Tendency: Mean, Median and Mode
Measures of Central Tendency: Mean, Median and ModeMeasures of Central Tendency: Mean, Median and Mode
Measures of Central Tendency: Mean, Median and Mode
 
Web & Social Media Analytics Previous Year Question Paper.pdf
Web & Social Media Analytics Previous Year Question Paper.pdfWeb & Social Media Analytics Previous Year Question Paper.pdf
Web & Social Media Analytics Previous Year Question Paper.pdf
 
Mattingly "AI & Prompt Design: The Basics of Prompt Design"
Mattingly "AI & Prompt Design: The Basics of Prompt Design"Mattingly "AI & Prompt Design: The Basics of Prompt Design"
Mattingly "AI & Prompt Design: The Basics of Prompt Design"
 
Código Creativo y Arte de Software | Unidad 1
Código Creativo y Arte de Software | Unidad 1Código Creativo y Arte de Software | Unidad 1
Código Creativo y Arte de Software | Unidad 1
 
CARE OF CHILD IN INCUBATOR..........pptx
CARE OF CHILD IN INCUBATOR..........pptxCARE OF CHILD IN INCUBATOR..........pptx
CARE OF CHILD IN INCUBATOR..........pptx
 
Activity 01 - Artificial Culture (1).pdf
Activity 01 - Artificial Culture (1).pdfActivity 01 - Artificial Culture (1).pdf
Activity 01 - Artificial Culture (1).pdf
 
The byproduct of sericulture in different industries.pptx
The byproduct of sericulture in different industries.pptxThe byproduct of sericulture in different industries.pptx
The byproduct of sericulture in different industries.pptx
 
Z Score,T Score, Percential Rank and Box Plot Graph
Z Score,T Score, Percential Rank and Box Plot GraphZ Score,T Score, Percential Rank and Box Plot Graph
Z Score,T Score, Percential Rank and Box Plot Graph
 
BASLIQ CURRENT LOOKBOOK LOOKBOOK(1) (1).pdf
BASLIQ CURRENT LOOKBOOK  LOOKBOOK(1) (1).pdfBASLIQ CURRENT LOOKBOOK  LOOKBOOK(1) (1).pdf
BASLIQ CURRENT LOOKBOOK LOOKBOOK(1) (1).pdf
 
Grant Readiness 101 TechSoup and Remy Consulting
Grant Readiness 101 TechSoup and Remy ConsultingGrant Readiness 101 TechSoup and Remy Consulting
Grant Readiness 101 TechSoup and Remy Consulting
 
Sanyam Choudhary Chemistry practical.pdf
Sanyam Choudhary Chemistry practical.pdfSanyam Choudhary Chemistry practical.pdf
Sanyam Choudhary Chemistry practical.pdf
 
APM Welcome, APM North West Network Conference, Synergies Across Sectors
APM Welcome, APM North West Network Conference, Synergies Across SectorsAPM Welcome, APM North West Network Conference, Synergies Across Sectors
APM Welcome, APM North West Network Conference, Synergies Across Sectors
 

Aspen EPC contracts Estimate classes

  • 1. Estimate Class Class 5 Class 4 Class 3 Class 2 Class 1 LEVEL OF PROJECT DEFINITION Expressed as a % of complete definition 0% to 2% 1% to 15% 10% to 40% 30% to 70% 50% to 100% END USAGE Typical Purpose of Estimate Concept Screening Study or Feasibility Budget Authorization, or Control Control or Bid / Tender Check Estimate or Bid / Tender Capacity Factored, Parametric Models, Judgment, or Analogy Equipment Factored or Parametric Models Semi-Detailed Unit Costs with Assembly Level Line Items Detailed Unit Cost with Forced Detailed TakeOff Detailed Unit Cost with Detailed Take-Off METHODOLOGY Typical estimating method EXPECTED ACCURACY RANGE Typical variation in low and high ranges [a] PREPARATION EFFORT Typical degree of effort relative to least cost index of 1 [b] L: -20% to -50% H: +30% to +100% L: -15% to -30% H: +20% to +50% L: -10% to -20% H: +10% to +30% L: -5% to -15% H: +5% to +20% L: -3% to -10% H: +3% to +15% END USAGE DEFINED ESTIMATING METHODS USED EXPECTED ACCURACY RANGE 2 to 4 3 to 10 4 to 20 5 to 100 Class 5 estimates are generally prepared based on very limited information, and subsequently have very wide accuracy ranges. As such, some companies and organizations have elected to determine that due to the inherent inaccuracies, such estimates cannot be classified in a conventional and systematic manner. Class 5 estimates, due to the requirements of end use, may be prepared within a very limited amount of time and with very little effort expended - sometimes requiring less than 1 hour to prepare. Often, little more than proposed plant type, location, and capacity are known at the time of estimate preparation. Class 4 estimates are generally prepared based on very limited information, and subsequently have very wide accuracy ranges. They are typically used for project screening, determination of feasibility, concept evaluation, and preliminary budget approval. Typically, engineering is from 1% to 5% complete, and would comprise at a minimum the following: plant capacity, block schematics, indicated layout, process flow diagrams (PFDs) for main process systems and preliminary engineered process and utility equipment lists. Level of Project Definition Required: 1% to 15% of full project definition. Class 3 estimates are generally prepared to form the basis for budget authorization, appropriation, and/or funding. As such, they typically form the initial control estimate against which all actual costs and resources will be monitored. Typically, engineering is from 10% to 40% complete, and would comprise at a minimum the following: process flow diagrams, utility flow diagrams, preliminary piping and instrument diagrams, utility flow diagrams, preliminary piping and instrument diagrams, plot plan, developed layout drawings, and essentially complete engineering process and utility equipment lists. Level Of Project Definition Required: 10% to 40% of full project definition. Class 2 estimates are generally prepared to form a detailed control baseline against which all project work is monitored in terms of cost and progress control. For contractors, this class of estimate is often used as the "bid" estimate to establish contract value. Typically, engineering is from 30% to 70% complete, and would comprise at a minimum the following: Process flow diagrams, utility flow diagrams, piping and instrument flow diagrams, heat and material balances, final plot plan, final layout drawings, complete engineered process and utility equipment lists, single line diagrams for electrical, electrical equipment and motor schedules, vendor quotations, detailed project execution plans, resourcing and work force plans, etc. Class 1 estimates are generally prepared for discrete parts or sections of the total project rather than generating this level of detail for the entire project. The parts of the project estimated at this level of detail will typically be used by subcontractors for bids, or by owners for check estimates. The updated estimate is often referred to as the current control estimate and becomes the new baseline for cost/schedule control of the project. Class 1 estimates may be prepared for parts of the project to comprise a fair price estimate or bid check estimate to compare against a contractor's bid estimate, or to evaluate/dispute claims. Typically, engineering is from 50% to 100% complete, and would comprise virtually all engineering and design documentation of the project, and complete project execution and commissioning plans. Level for Project Definition Required: 50% to 100% of full project definition. Class 5 estimates are prepared for any number of strategic business planning purposes, such as but not limited to market studies, assessment of initial viability, evaluation of alternate schemes, project screening, project location studies, evaluation of resource needs and budgeting, longrange capital planning, etc. Class 4 estimates are prepared for a number of purposes, such as but not limited to, detailed strategic planning, business development, project screening at more developed stages, alternative scheme analysis, confirmation of economic and/or technical feasibility, and preliminary budget approval or approval to proceed to next stage. Class 3 estimates are typically prepared to support full project funding requests, and become the first of the project phase "control estimate" against which all actual costs and resources will be monitored for variations to the budget. They are used as the project budget until replaced by more detailed estimates. In many owner organizations, a Class 3 estimate may be the last estimate required and could well form the only basis for cost/schedule control. Class 2 estimates are typically prepared as the detailed control baseline against which all actual costs an resources will now be monitored for variation to the budget, and form a part of the change/variation control program. Class 1 estimates are typically prepared to form a current control estimate to be used as the final control baseline against which all actual coasts and resources will now be monitored for variations to the budget, and form a part of the change/variation control program. They may be used to evaluate bid checking, to support vendor/contractor negotiations, or for claim evaluations and dispute resolution. Class 5 estimates virtually always use stochastic estimating methods such as cost/capacity curves and factors, scale of operations factors, Lang factors, Hand factors, Chilton factors, Peters-Timmerhaus factors, Guthrie factors, and other parametric and modeling techniques. Class 4 estimates virtually always use stochastic estimating methods such as cost/capacity curves and factors, scale of operations factors, Lang factors, Hand factors, Chilton factors, Peters-Timmerhaus factors, Guthrie factors, the Miller method, gross unit costs/ratios, and other parametric and modeling techniques. Class 3 estimates usually involve more deterministic estimating methods that stochastic methods. They usually involve a high degree of unit cost line items, although these may be at an assembly level of detail rather than individual components. Factoring and other stochastic methods may be used to estimate less-significant areas of the project. Class 2 estimates always involve a high degree of deterministic estimating methods. Class 2 estimates are prepared in great detail, and often involve tens of thousands of unit cost line items. For those areas of the project still undefined, an assumed level of detailed takeoff (forced detail) may be developed to use as line items in the estimate instead of relying on factoring methods. Class 1 estimates involve the highest degree of deterministic estimating methods, and require a great amount of effort. Class 1 estimates are prepared in great detail, and thus are usually performed on only the most important or critical areas of the project. All items in the estimate are usually unit cost line items based on actual design quantities. Typical accuracy ranges for Class 5 estimates are -20% to 50% on the low side, and +30% to +100% on the high side, depending on the technological complexity of the project, appropriate contingency determination. Ranges could exceed those shown in unusual circumstances. Typical accuracy ranges for Class 4 estimates are -15% to -30% on the low side, and +20% to +50% on the high side, depending on the technological complexity of the project, appropriate reference information, and the inclusion of an appropriate contingency determination. Ranges could exceed those shown in unusual circumstances. Typical accuracy ranges for Class 3 estimates are -10% to 20% on the low side, and +10% to +30% on the high side, depending on the technological complexity of the project, appropriate reference information, and the inclusion of an appropriate contingency determination. Ranges could exceed those shown in unusual circumstances. Typical accuracy ranges for Class 2 estimates are -5% to 15% on the low side, and +5% to +20% on the high side, depending on the technological complexity of the project, appropriate reference information, and the inclusion of an appropriate contingency determination. Ranges could exceed those shown in unusual circumstances. Typical accuracy ranges for Class 1 estimates are -3% to 10% on the low side, and +3% to +15% on the high side, depending on the technological complexity of the project, appropriate reference information, and the inclusion of an appropriate contingency determination. Ranges could exceed those shown in unusual circumstances. As little as 1 hour or less to prepare to perhaps more than 200 hours, depending on the project and the estimating methodology used. REFINED CLASS DEFINITION 1 Typically, as little as 20 hours or less to perhaps more than 300 hours, depending on the project and the estimating methodology used. Typically, as little as 150 hours or less to perhaps more than 1500 hours, depending on the project and the estimating methodology used. Typically, as little as 300 hours or less to perhaps more than 3000 hours, depending on the project and the estimating methodology used. Bid Estimates typically require more effort than estimates used for funding or control purposes Class 1 estimates require the most effort to create, and as such are generally developed for only selected areas of the project, or for bidding purposes. A complete Class 1 estimate may involve as little as 600 hours or less, to perhaps more than 6,000 hours, depending on the project and the estimating methodology used. Bid estimate typically require more effort than estimates used for funding or control purposes. Order of Magnitude Estimate; Ratio, ballpark, blue sky, seatof-pants, ROM, idea study, prospect estimate, concession license estimate, guesstimate, rule-of thumb. Budget Estimate; Screening, top-down, feasibility, authorization, factored, pre-design, pre-study. Budget Estimate; Budget, scope, sanction, semi-detailed, authorization, preliminary control, concept study, development, basic engineering phase estimate, target estimate. Definitive Estimate; Detailed Control, forced detail, execution phase, master control, engineering, bid, tender, change order estimate. Definitive Estimate; Full detail, release, fall-out, tender, firm price, bottoms-up, final, detailed control, forced detail, execution phase, master control, fair price, definitive, change order estimate. EFFORT TO PREPARE (for US$20MM project): ANSI Standard Reference Z94.2-1989 name; Alternate Estimate Names, Terms, Expressions, Synonyms:
  • 2. Estimate Class Class 5 Class 4 Class 3 Class 2 Class 1 Estimate Input Checklist and Maturity Index Class 5 Class 4 Class 3 Class 2 Class 1 General Preliminary Defined Defined Defined Assumed Preliminary Defined Defined Defined General Approximate Specific Specific Specific Soils & Hydrology None Preliminary Defined Defined Defined Integrated Project Plan None Preliminary Defined Defined Defined Project Master Schedule None Preliminary Defined Defined Defined Escalation Strategy Work Breakdown Structure Project Code of Accounts None Preliminary Defined Defined Defined None Preliminary Defined Defined Defined None Preliminary Defined Defined Defined Contracting Strategy Assumed Assumed Preliminary Defined Defined Class 5 Class 4 Class 3 Class 2 Class 1 Started / Preliminary Preliminary / Complete Complete Complete Complete Started Preliminary / Complete Complete Complete Started / Preliminary Preliminary / Complete Complete Complete Started / Preliminary Preliminary / Complete Complete Complete Started Preliminary / Complete Complete Complete Started Preliminary / Complete Complete Complete Process Equipment List Started / Preliminary Preliminary / Complete Complete Complete Utility Equipment List Electrical One Line Drawings Specifications and Datasheets General Equipment Arrangement Drawings Started / Preliminary Preliminary / Complete Complete Complete Started / Preliminary Preliminary / Complete Complete Complete Started Preliminary / Complete Complete Complete Started Preliminary / Complete Complete Complete Started / Preliminary Preliminary Complete Started Preliminary / Complete Complete Complete Structural Details Mechanical Discipline Drawings Electrical Discipline Drawings System Discipline Drawings Civil/Site Discipline Drawings Started Preliminary / Complete Complete Complete Started Preliminary Preliminary / Complete Started Preliminary Preliminary / Complete Started Preliminary Preliminary / Complete Started Preliminary Preliminary / Complete Demolition Details Started Preliminary / Complete Complete Complete GENERAL PROJECT DATA Project Scope Description Plant Production / Facility Capacity Plant Location ENGINEERING DELIVERABLES: Block Flow Diagrams Plot Plans Process Flow Diagrams (PFDs) Utility Flow Diagrams (UFDs) Piping & Instrument Diagrams (P&IDS) Heat and Material Balances Spare Parts Lists Architectural Details / Schedules
  • 3. Page 3 Estimating Accuracy Curve 0% Estimate CLASS.XLS (Source: Derived from AACE Data; 18R-97) Engineering % 100 Engineering Completion (%) Page 3 Estimate CLASS.XLS