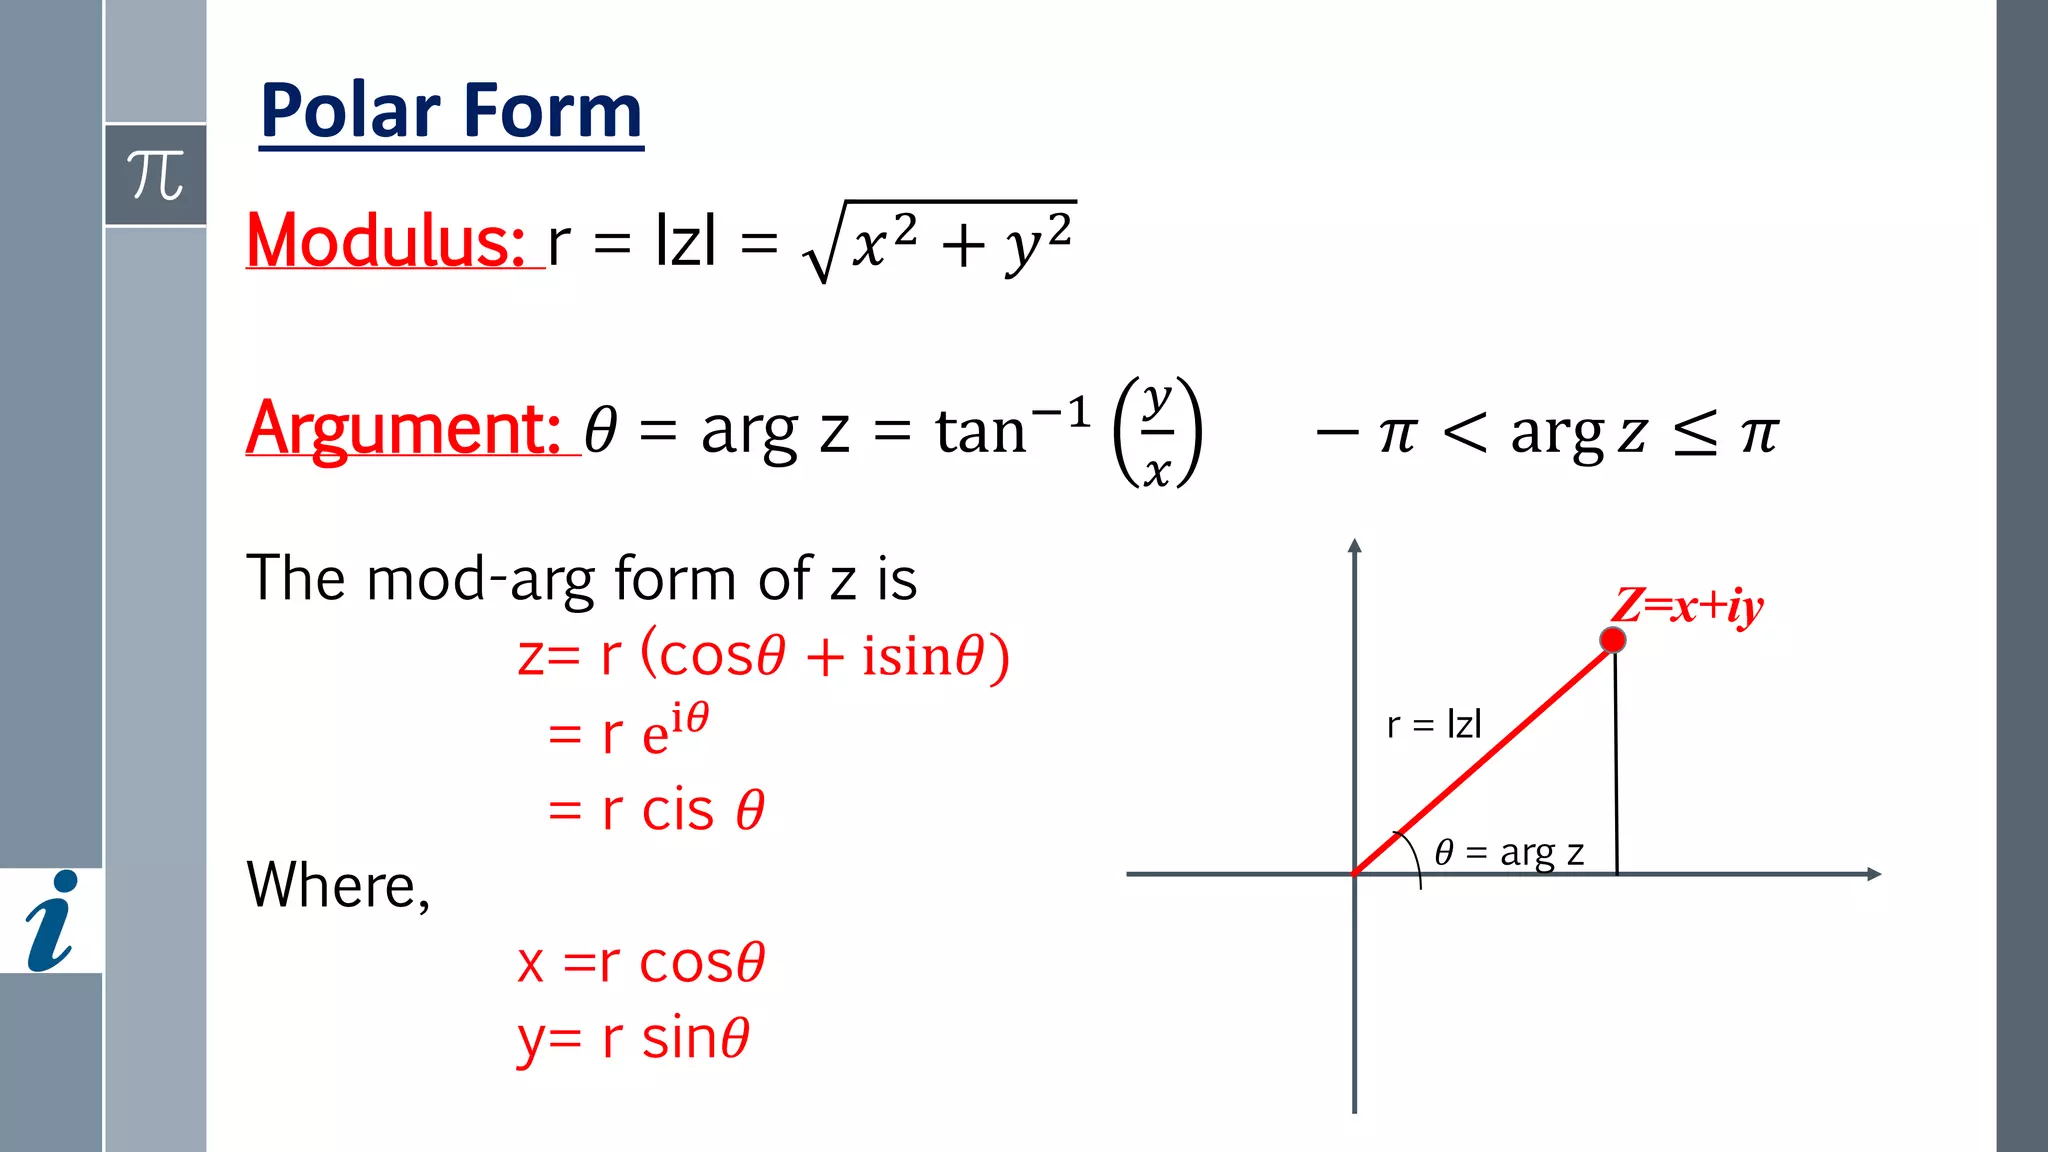
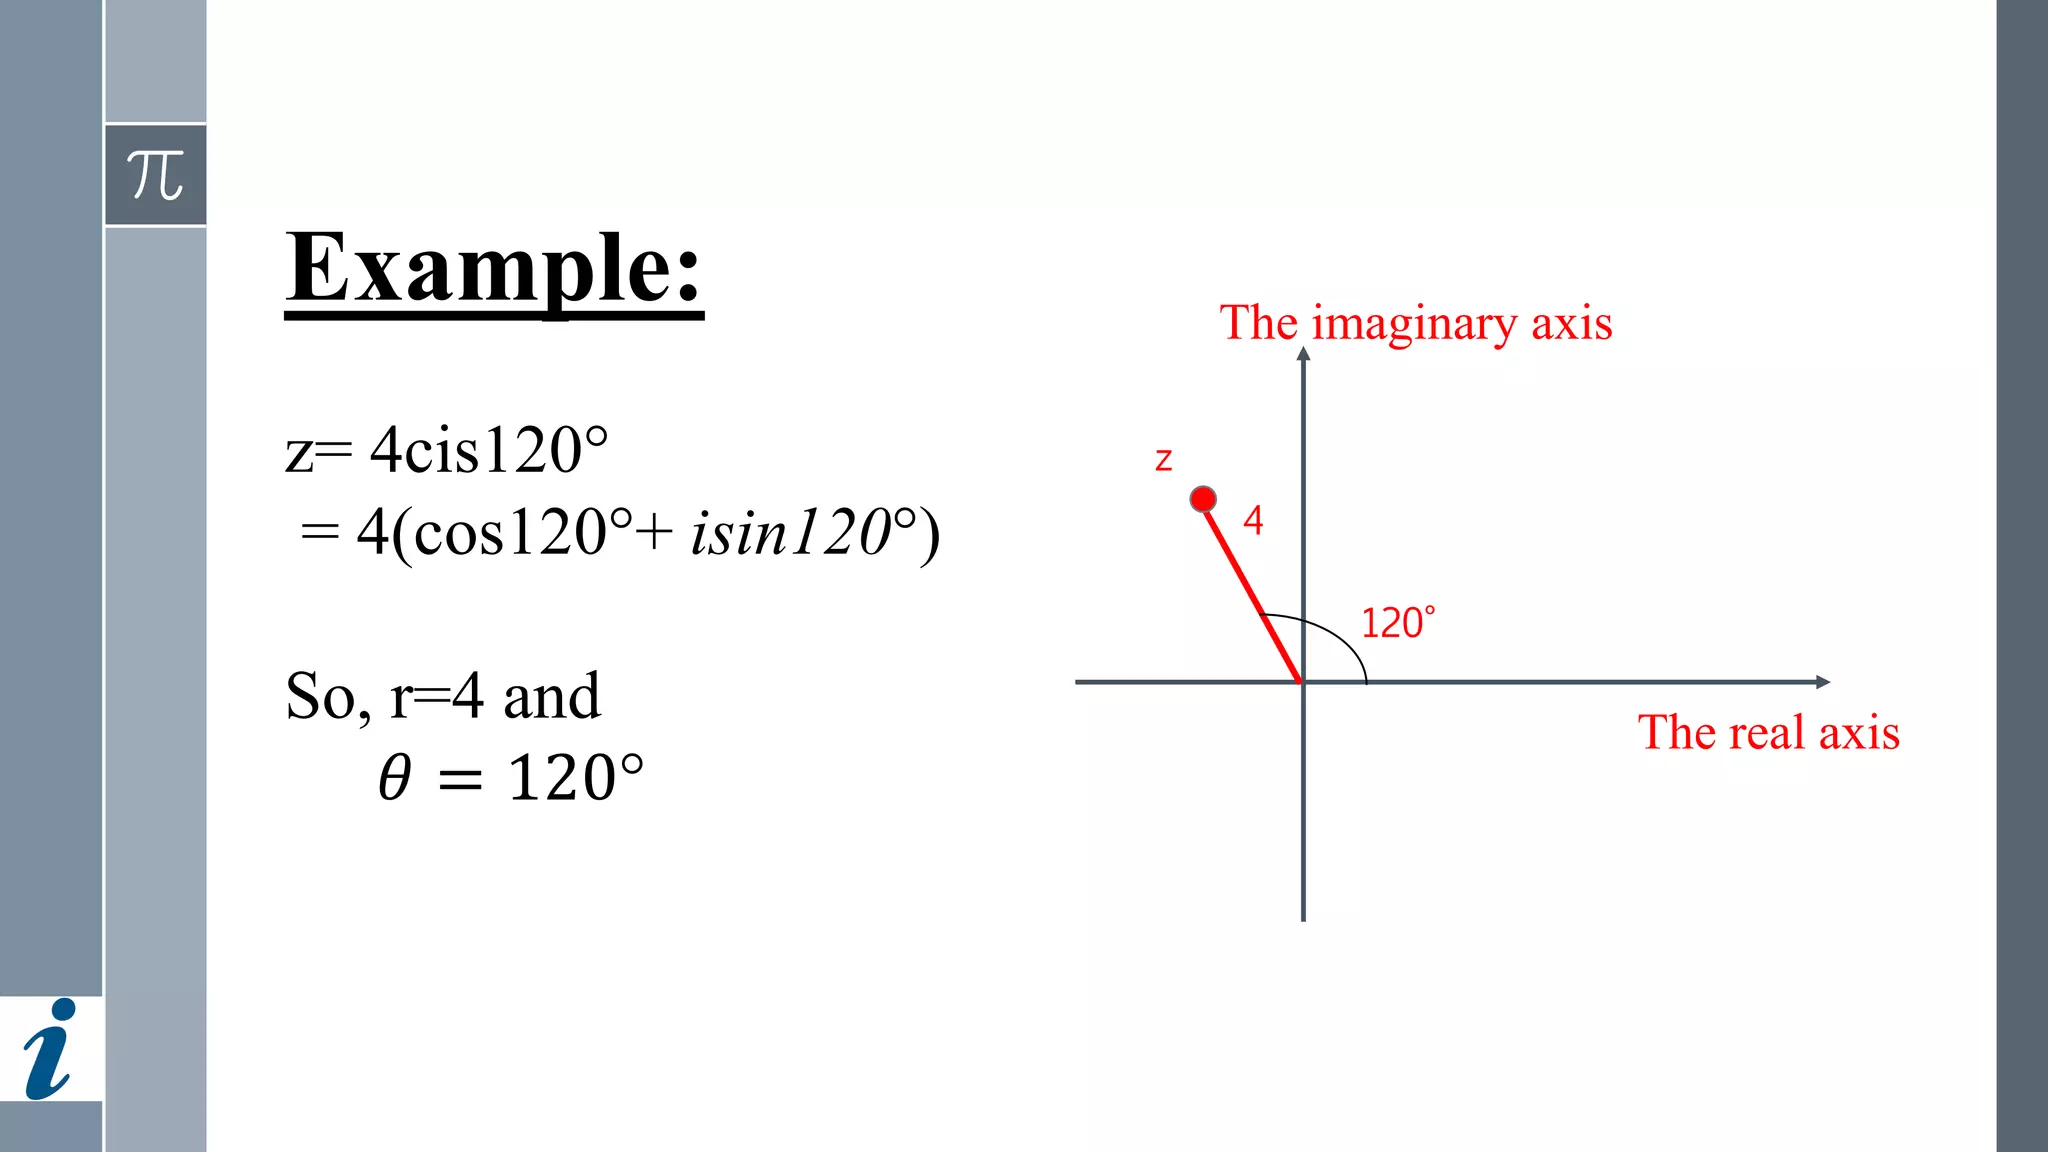
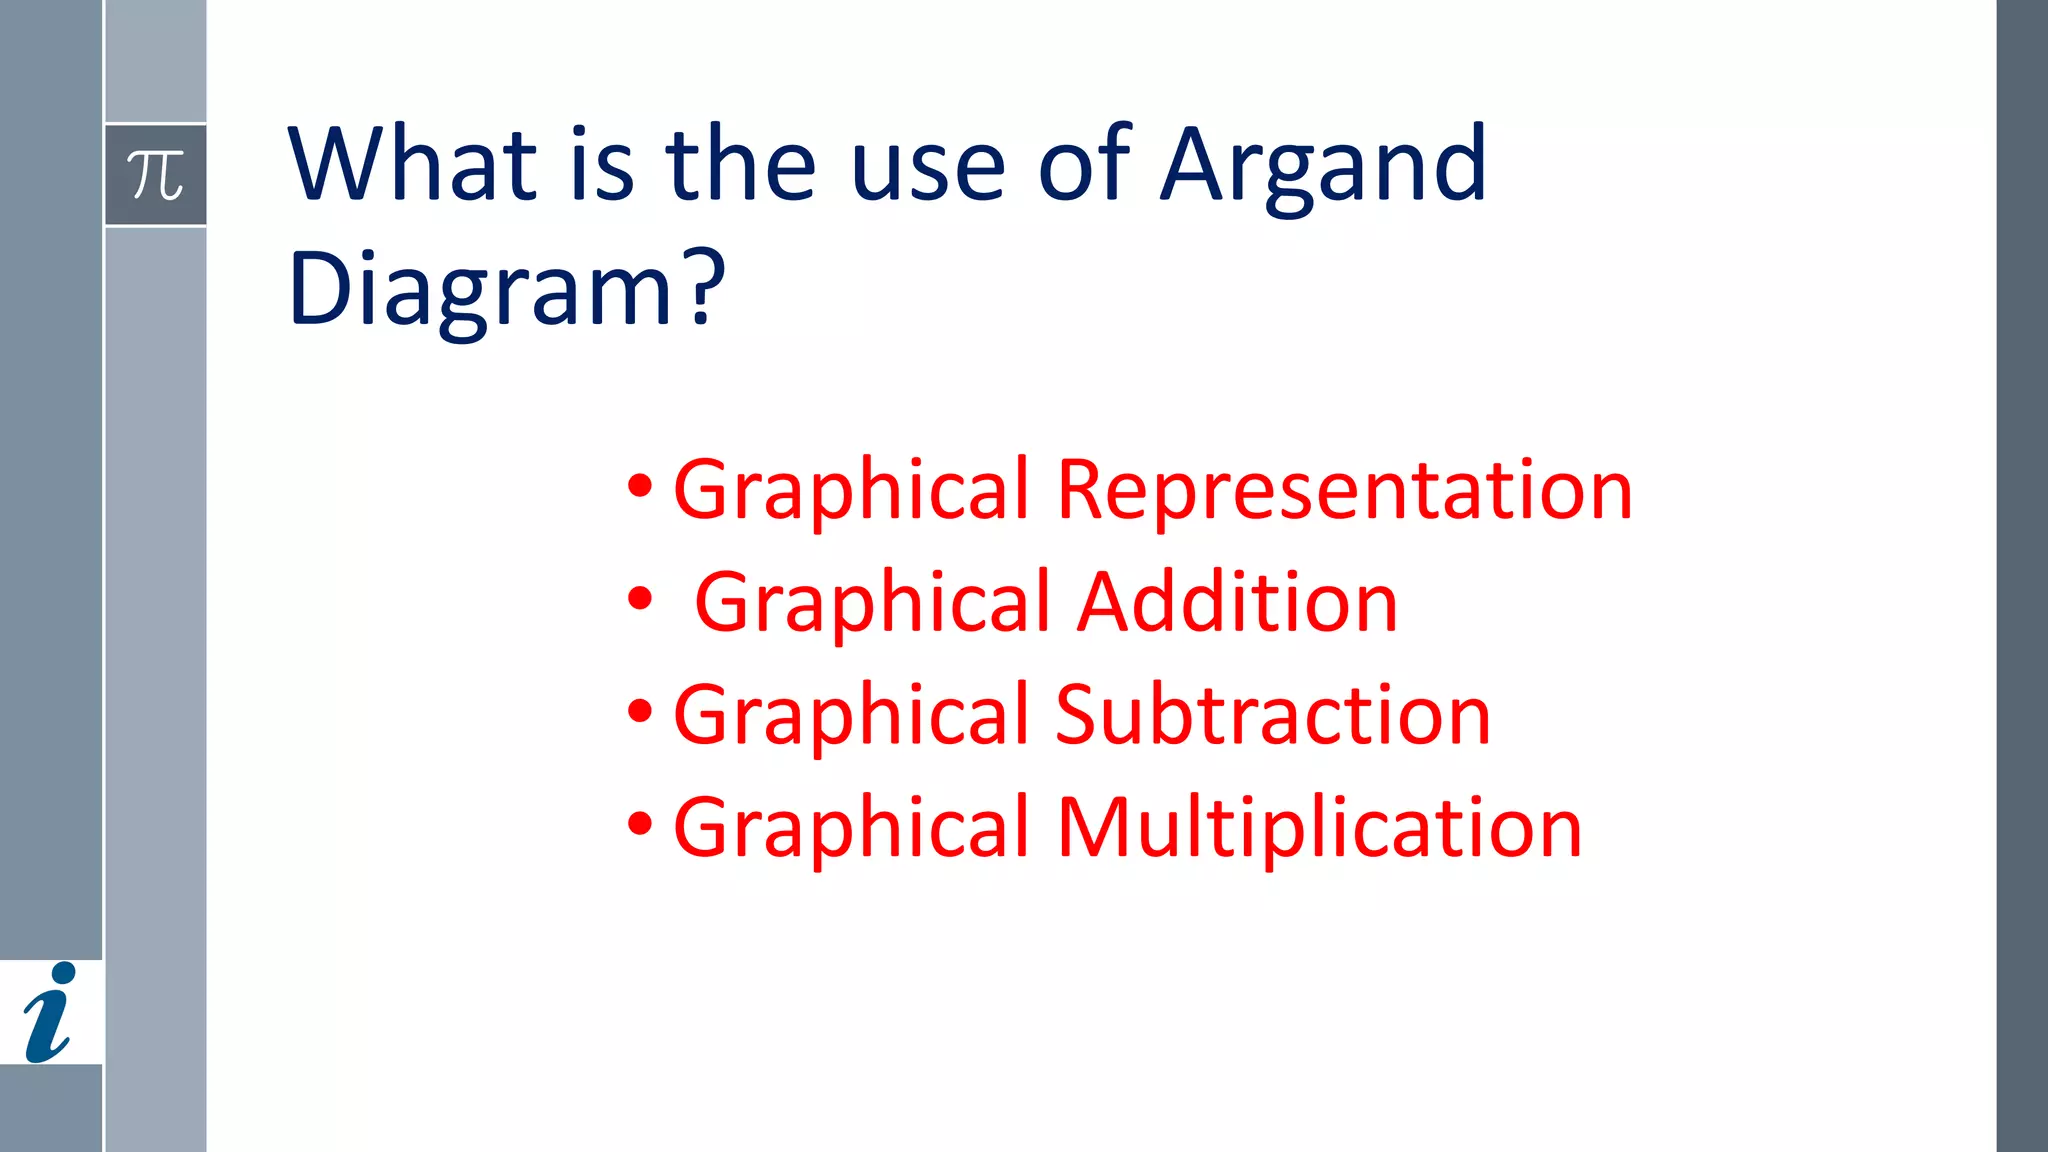
The document is a presentation on the Argand diagram, which is a graphical representation of complex numbers in the Cartesian coordinate system. It covers concepts such as the polar form of complex numbers, modulus, and argument, as well as the uses of the Argand diagram for graphical operations like addition and multiplication. Examples of complex numbers and their representations are also provided.


![PM [B03] Complex Coordinate](https://cdn.slidesharecdn.com/ss_thumbnails/pmb03complexcoordinate-151009051941-lva1-app6891-thumbnail.jpg?width=640&height=640&fit=bounds)


