Download to read offline

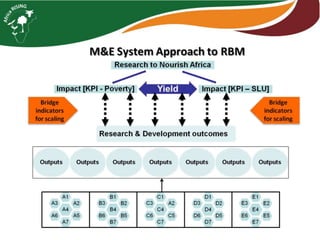
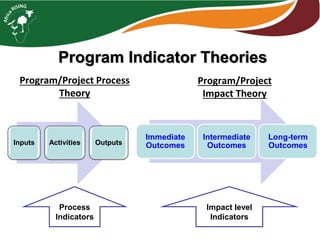


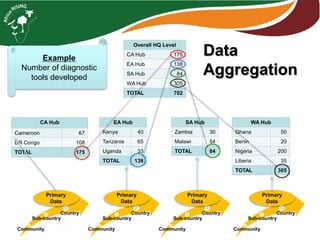

The document outlines the logframe and indicators for the Africa Rising West Africa initiative, detailing program indicators and methodologies for tracking progress from activities to long-term outcomes. It specifies data collection methods, frequency, and the necessity of verifying the feasibility of data collection. The document emphasizes the importance of understanding assumptions that could affect program objectives.


![谷歌留痕技术 [ 𝙩𝙤𝙥 𝟮𝟯𝟯. 𝙘 𝙤𝙢 ]](https://cdn.slidesharecdn.com/ss_thumbnails/top233-260130174328-3833018c-thumbnail.jpg?width=640&height=640&fit=bounds)


