Download to read offline

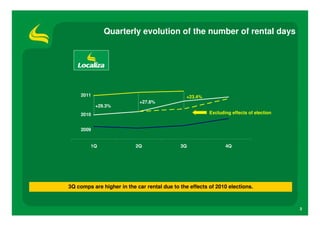
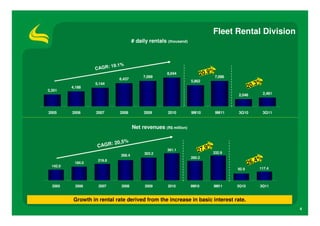


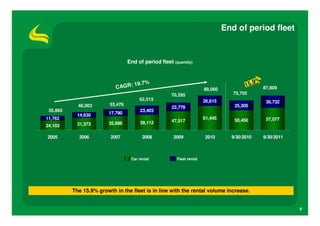
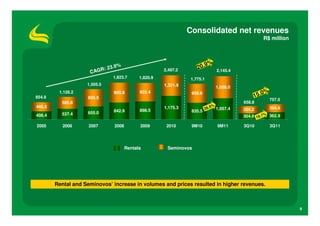
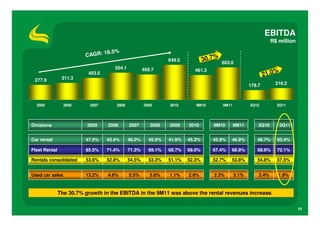

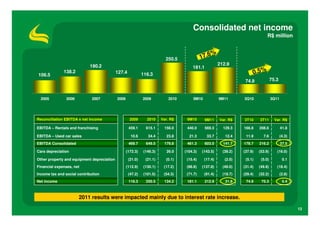


Localiza Rent a Car S.A. reported its results for the third quarter of 2011. Key highlights include: - Daily rentals increased 23.4% compared to the third quarter of 2010, driven by growth in both the car rental and fleet rental divisions. - Net revenues grew 15% compared to the third quarter of 2010, with increases in both rental volumes and average rental rates. - EBITDA grew 30.7% compared to the first nine months of 2010, outpacing the growth in rental revenues. - Net income was relatively flat compared to the third quarter of 2010, as the impact of higher interest rates offset gains in rental revenues and EBITDA.


