Download as PDF, PPTX

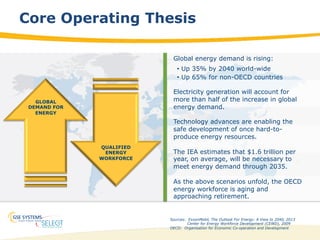


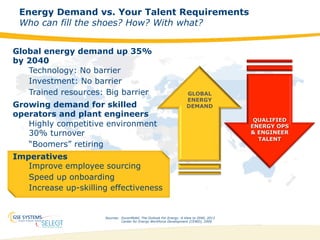


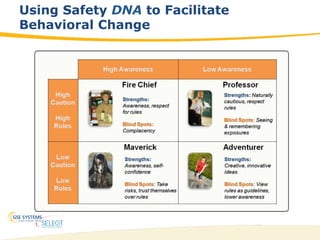


Global energy demand is projected to increase 35% by 2040, straining the supply of qualified energy workforce as many current workers approach retirement. New technologies enable production of harder to access energy resources but developing the trained workforce remains a barrier to meeting rising demand. Safety DNA analytics can enhance workforce processes from recruitment to development by evaluating individuals' propensity for safe behaviors based on cognitive and personality attributes. This helps improve safety culture, performance and outcomes by facilitating behavioral change at both the individual contributor and leadership levels.