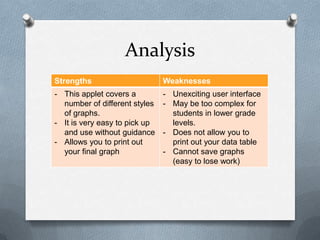
Applet Analysis:
    Data Grapher
Data Grapher
O The data grapher is an applet device that
  allows users to enter data and create four
  different types of graphs:
  O - Bar Graphs
  O - Line Graphs
  O - Pie Graphs
  O - Pictographs


  Link:
  http://illuminations.nctm.org/ActivityDetail.aspx?ID
  =204
How It Works
- Users of this applet will first pick the type of graph
  they wish to work with. Once this has been
  decided, you can enter the data that you want to
  chart in the columns and rows provided. By
  clicking either ‘Add Row’ or ‘Add Column,’ users
  may extend these fields to include all of their data.
- Labeling these graphs is also easy, as at the top of
  the page users are provided with options to give
  the graph a title, and give each the X-Axis and Y-
  Axis a title as well (for bar and line graphs)
- Lastly, click on the preview button to see your final
  masterpiece.
Analysis
Strengths                      Weaknesses
- This applet covers a         - Unexciting user interface
  number of different styles   - May be too complex for
  of graphs.                     students in lower grade
- It is very easy to pick up     levels.
  and use without guidance     - Does not allow you to
- Allows you to print out        print out your data table
  your final graph             - Cannot save graphs
                                 (easy to lose work)
Evaluation
O On the whole, this is quite a useful tool if you are
    looking to create simple graphs from your data
    sets.
O   Students can use this applet independently
    because the webpage includes instructions.
O   The variety of graphing options is a definite plus.
O   Having the ability to print your graphs lets students
    take their work away from the screen.
O   While it works for short term activities, it is not a
    good tool to use in a long term project (because
    you cannot save your work)
A Problem Based Task
O Task: Collect data on class pets. Translate
  this data into a bar graph and a circle
  graph.
O Connection to the standards:
  O 1.MD.4 – Organize, represent, and
    interpret data with up to three categories;
    ask and answer questions about the total
    number of data points, how many in each
    category, and how many more or less are
    in one category than in another.
Questions to Assess and
Advance Student Thinking
O Launch: If we brought all of our pets into
  school on the same day, do you think
  there would there be more cats or dogs?
O Explore: Looking at your graph on the
  applet, was your prediction correct?
O Summarize: What other facts can you see
  by looking at your graph?

Applet Analysis: Data Grapher

  • 1.
    Applet Analysis: Data Grapher
  • 2.
    Data Grapher O Thedata grapher is an applet device that allows users to enter data and create four different types of graphs: O - Bar Graphs O - Line Graphs O - Pie Graphs O - Pictographs Link: http://illuminations.nctm.org/ActivityDetail.aspx?ID =204
  • 3.
    How It Works -Users of this applet will first pick the type of graph they wish to work with. Once this has been decided, you can enter the data that you want to chart in the columns and rows provided. By clicking either ‘Add Row’ or ‘Add Column,’ users may extend these fields to include all of their data. - Labeling these graphs is also easy, as at the top of the page users are provided with options to give the graph a title, and give each the X-Axis and Y- Axis a title as well (for bar and line graphs) - Lastly, click on the preview button to see your final masterpiece.
  • 4.
    Analysis Strengths Weaknesses - This applet covers a - Unexciting user interface number of different styles - May be too complex for of graphs. students in lower grade - It is very easy to pick up levels. and use without guidance - Does not allow you to - Allows you to print out print out your data table your final graph - Cannot save graphs (easy to lose work)
  • 5.
    Evaluation O On thewhole, this is quite a useful tool if you are looking to create simple graphs from your data sets. O Students can use this applet independently because the webpage includes instructions. O The variety of graphing options is a definite plus. O Having the ability to print your graphs lets students take their work away from the screen. O While it works for short term activities, it is not a good tool to use in a long term project (because you cannot save your work)
  • 6.
    A Problem BasedTask O Task: Collect data on class pets. Translate this data into a bar graph and a circle graph. O Connection to the standards: O 1.MD.4 – Organize, represent, and interpret data with up to three categories; ask and answer questions about the total number of data points, how many in each category, and how many more or less are in one category than in another.
  • 7.
    Questions to Assessand Advance Student Thinking O Launch: If we brought all of our pets into school on the same day, do you think there would there be more cats or dogs? O Explore: Looking at your graph on the applet, was your prediction correct? O Summarize: What other facts can you see by looking at your graph?