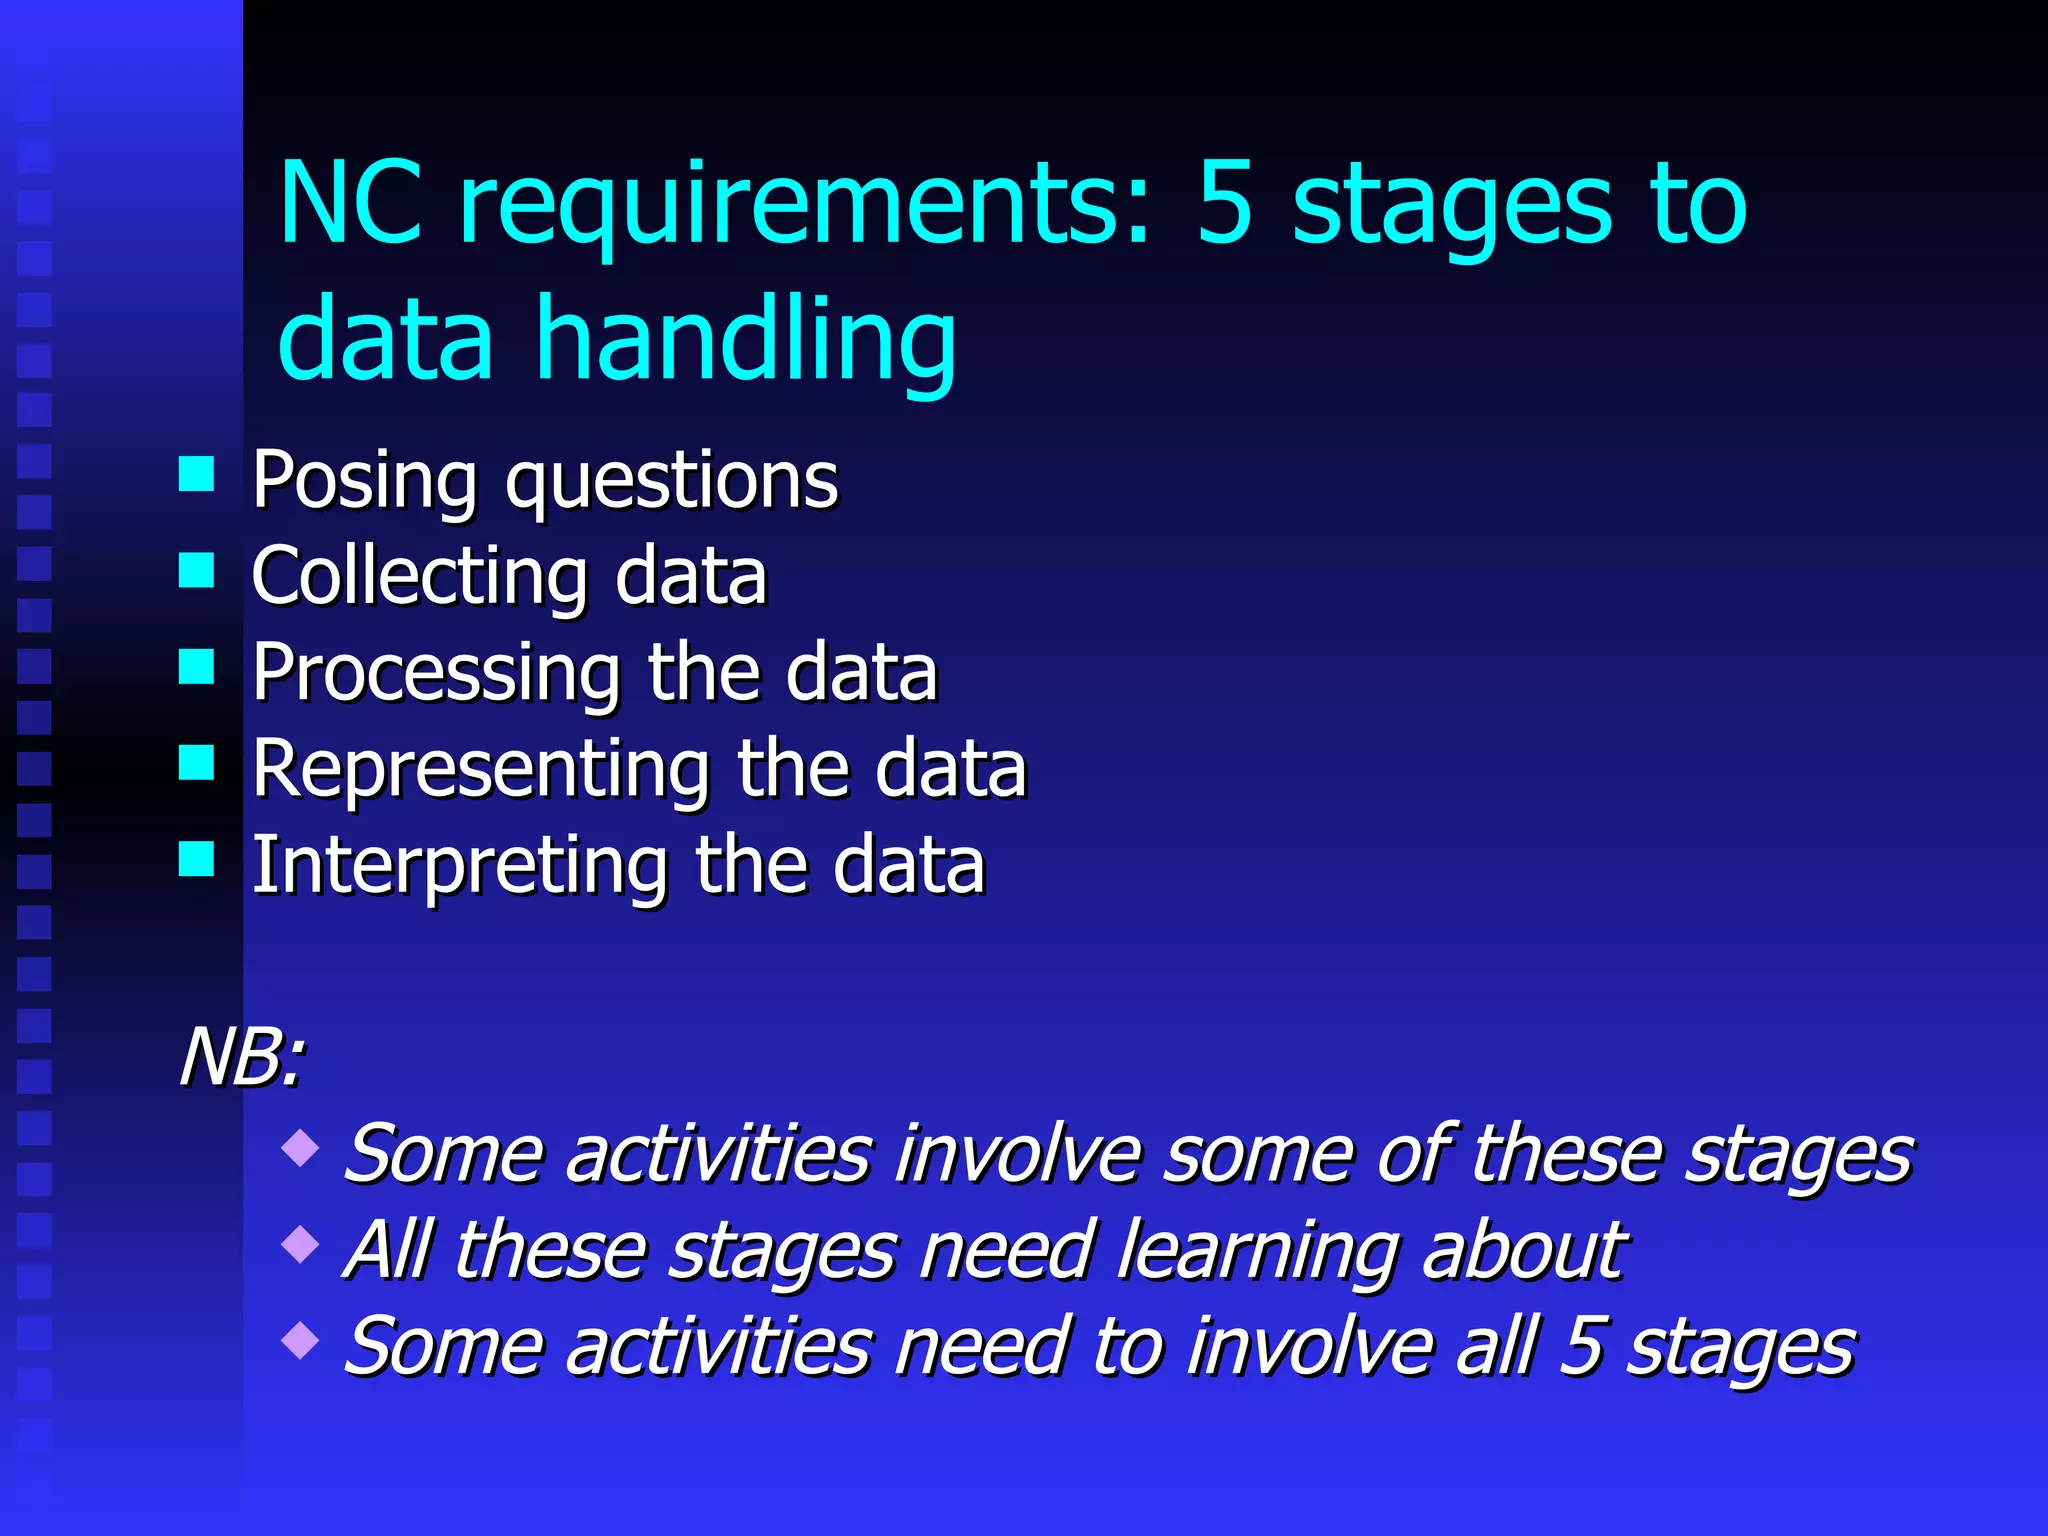
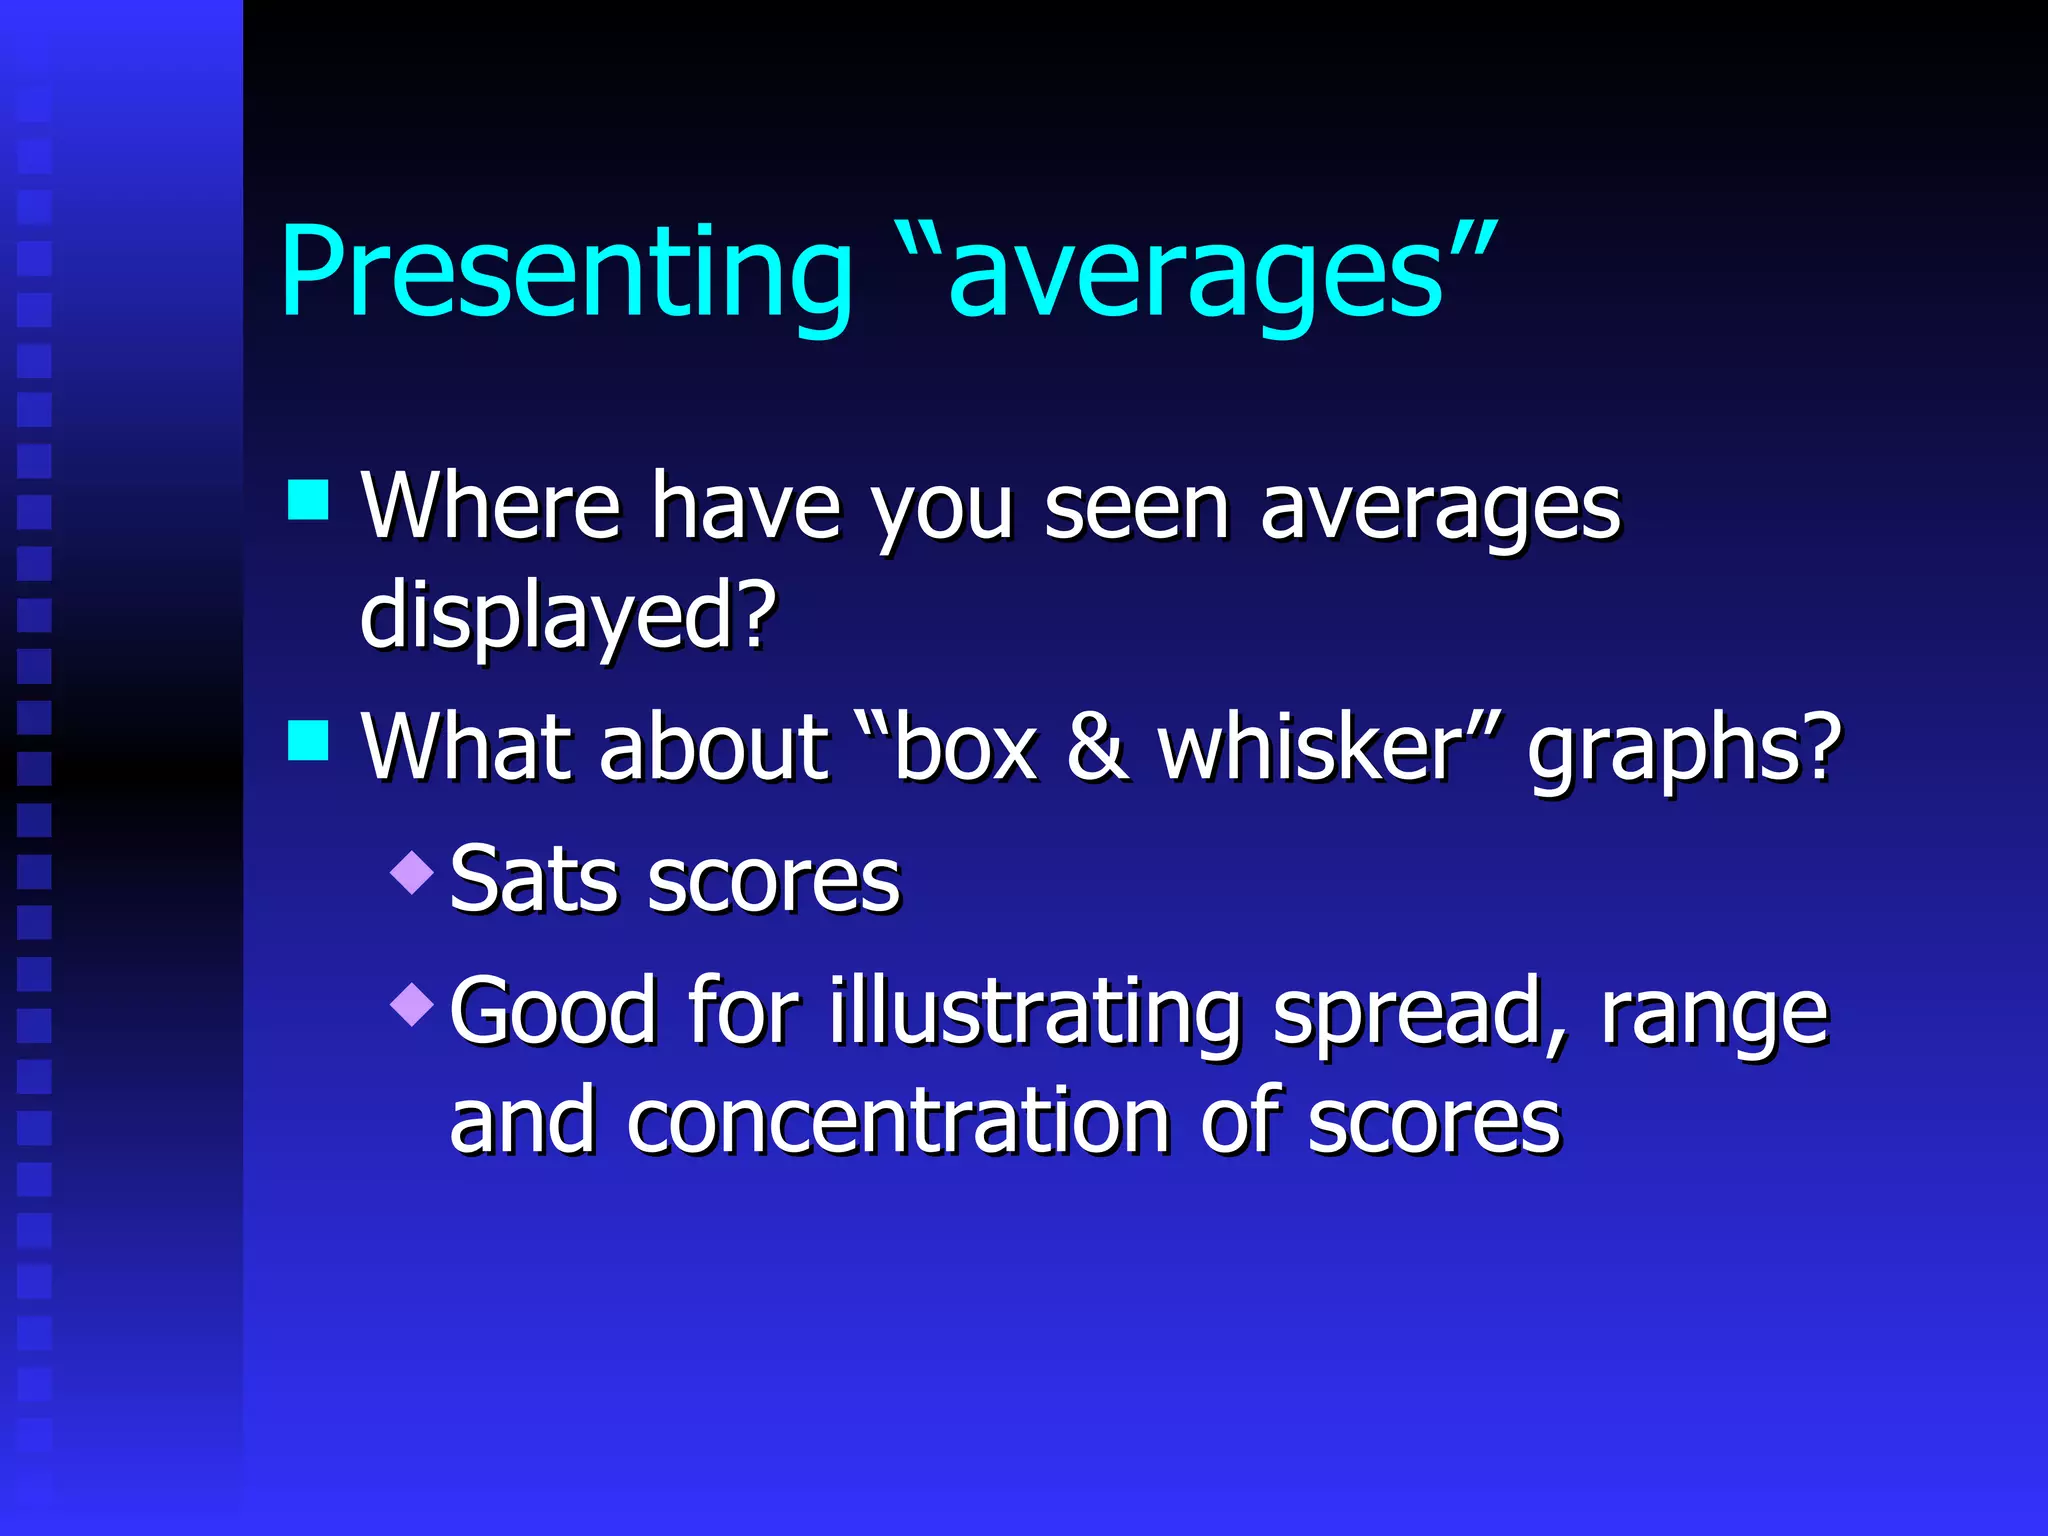
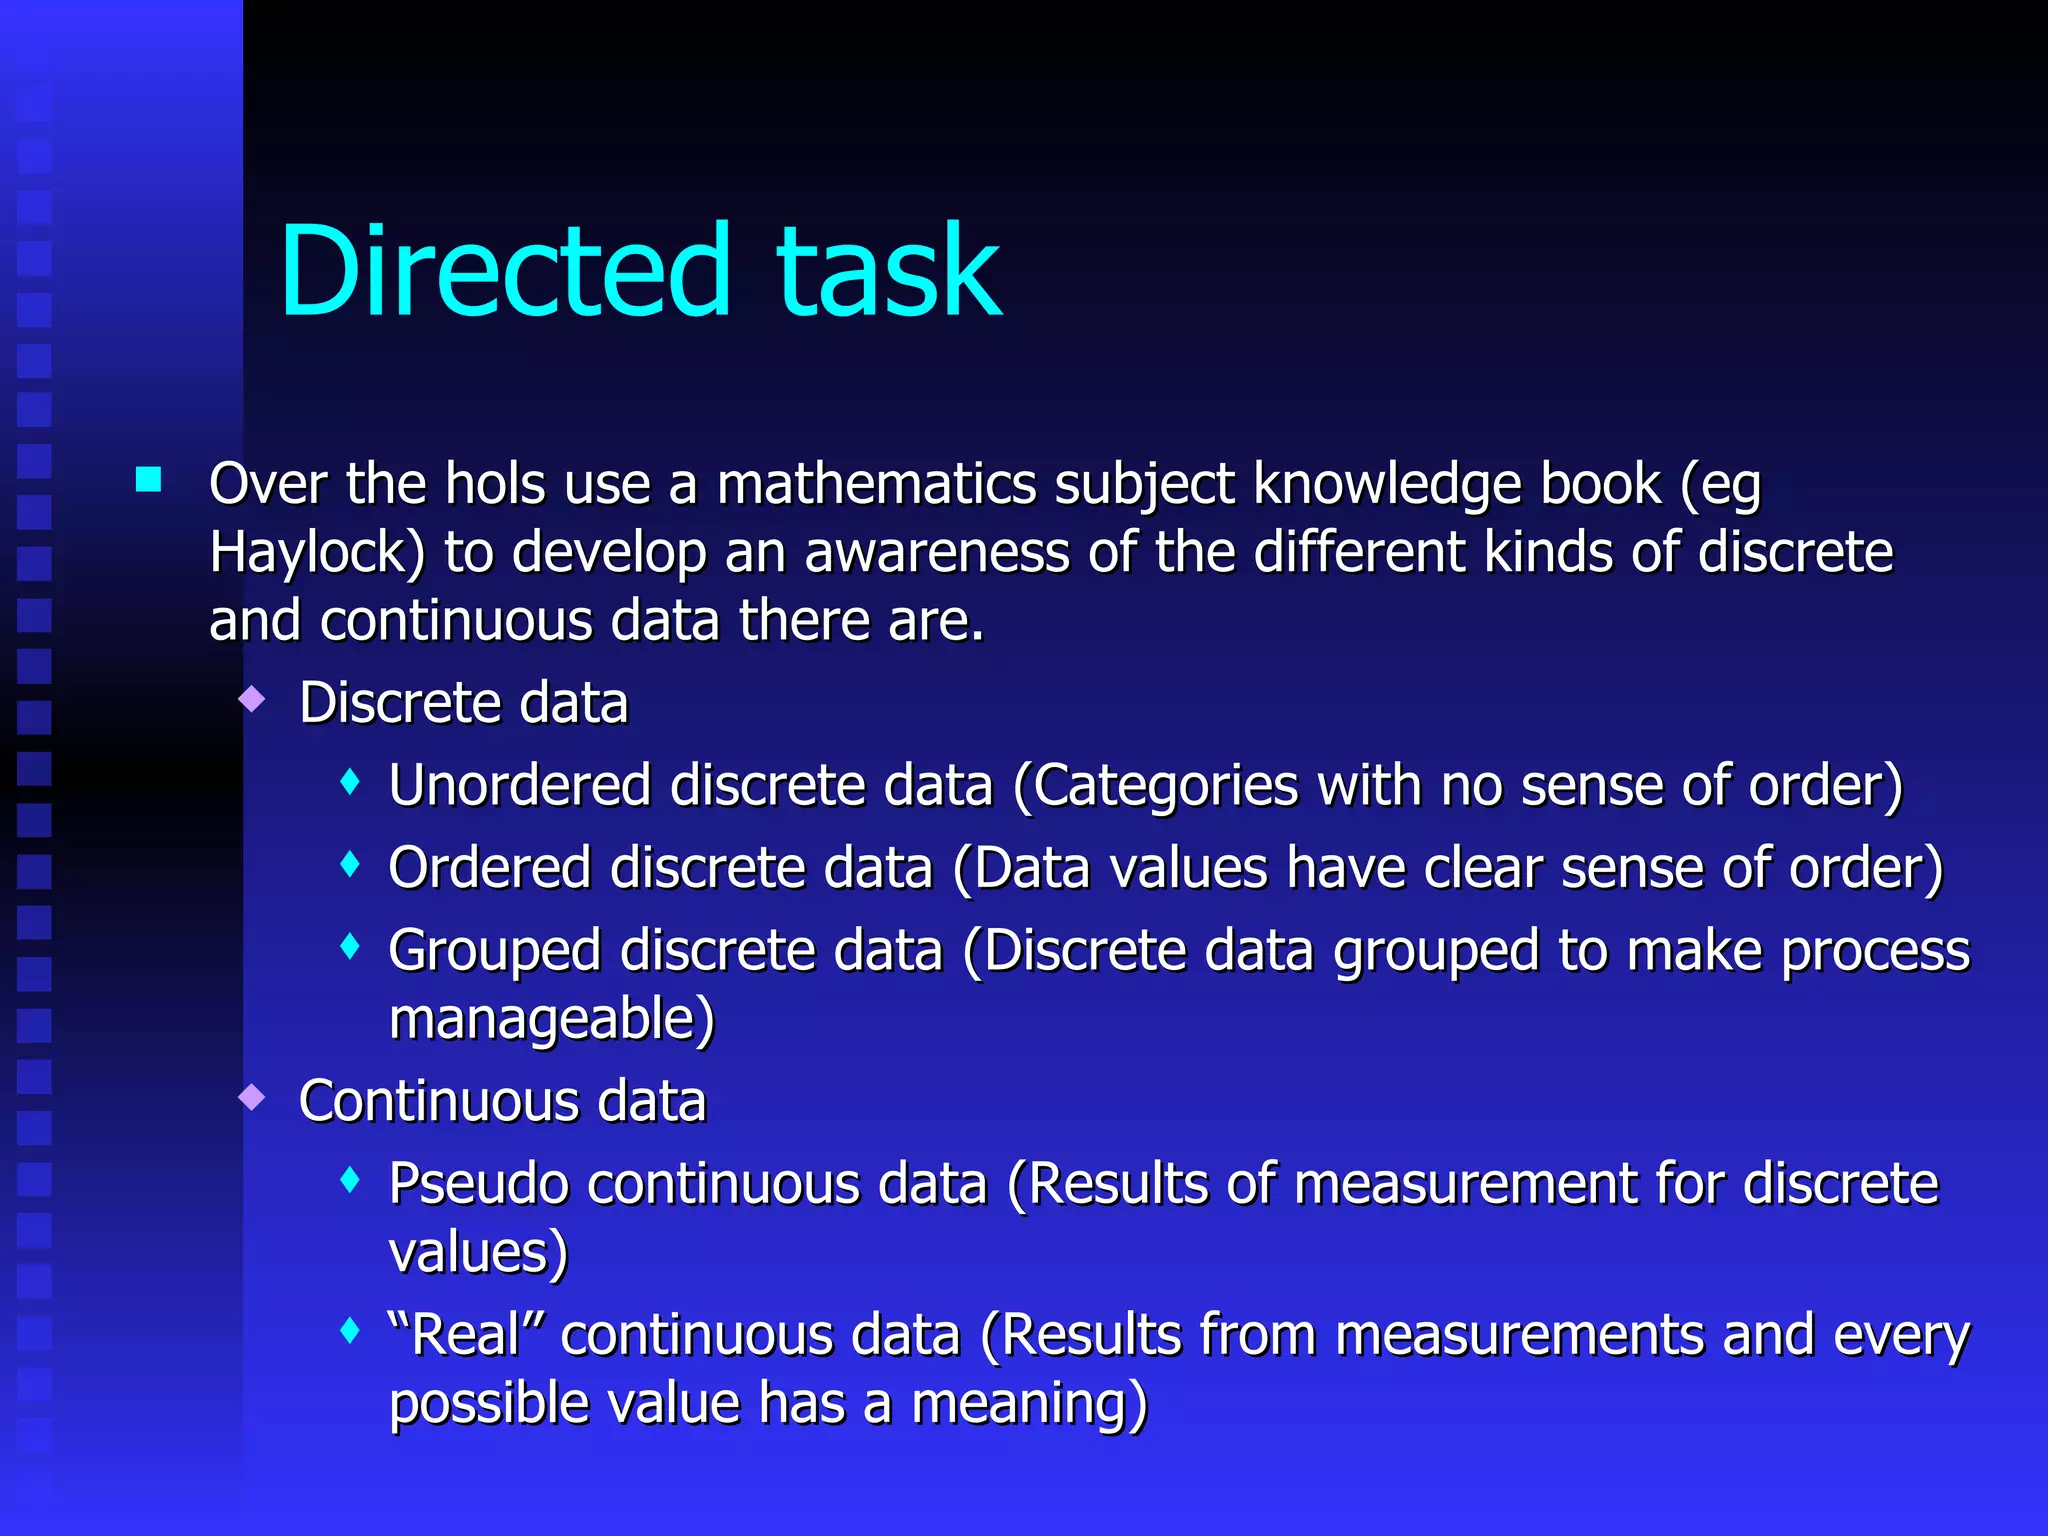
Data handling Liars, damn liars and statisticians!
Objectives   review your own subject knowledge in this area ensuring secure understanding, identifying key facts and using vocabulary accurately. consider children’s learning styles, possible misconceptions, progression and research in children’s learning evaluate teaching styles and strategies, resources and ICT  consider issues relating to Inclusion and Differentiation, progression in learning from the FS to KS3, and Cross curricular links
NC requirements: 5 stages to data handling  Posing questions  Collecting data  Processing the data  Representing the data  Interpreting the data NB:  Some activities involve some of these stages  All these stages need learning about  Some activities need to involve all 5 stages
Progression in sorting Sorting  Positive attribute labels (Sort first, label later) Positive attributes and then negation (Label first then sort - red, not red) Types of sets  Unstructured sets (random eg toy cars) Structured sets (Compare bears – small, medium & large bears in blue, red, yellow & green)
Additional techniques for sorting Venn diagram Carroll diagram Decision tree
Suggested progression   A suggested sequence for progression 3D data (use the shoes!) 3D representation (cubes illustrating 1-1 correspondence) Post it pictograms (moving towards the abstract) Block graphs (Vertical axis and labels) Bar graphs Different to block graph Labelling issues – the line is labelled not the block Pie charts Line graphs (Is this suitable?)
ICT in data handling When can this be useful? What have you seen? ICT dilemma – when exploring software such as Excel children will want to try these out This is not always the best type of chart to use Pie charts Prior knowledge? Some children will have seen this style of representation and wish to emulate it Differences Pie charts use proportional representation, not numerical representation, therefore .. Labelling size of data sample is important
ICT to present data Using ICT opportunities 2Simple software: 2graph Handy graph Data handling Line graph Excel
Asking questions and interpreting data Look at this temperature data  Write a question to develop interpreting data skills for  Simple questions Intermediate questions Difficult questions What sort of questions did you write? Compare questions with notes from previous lecture
Interpretation tools Mathematics needed to augment data handling skills Averages  Mean  Median  Mode
Calculating averages Use temperature readings to calculate the session Mean temp Median temp Mode temp Are there any differences? Why? When would you use each type of “average”? Why?
Presenting “averages” Where have you seen averages displayed? What about “box & whisker” graphs? Sats scores Good for illustrating spread, range and concentration of scores
Directed task Over the hols use a mathematics subject knowledge book (eg Haylock) to develop an awareness of the different kinds of discrete and continuous data there are. Discrete data Unordered discrete data (Categories with no sense of order) Ordered discrete data (Data values have clear sense of order) Grouped discrete data (Discrete data grouped to make process manageable) Continuous data Pseudo continuous data (Results of measurement for discrete values) “ Real” continuous data (Results from measurements and every possible value has a meaning)

Data Handling With Ict For Bb

  • 1.
    Data handling Liars,damn liars and statisticians!
  • 2.
    Objectives review your own subject knowledge in this area ensuring secure understanding, identifying key facts and using vocabulary accurately. consider children’s learning styles, possible misconceptions, progression and research in children’s learning evaluate teaching styles and strategies, resources and ICT consider issues relating to Inclusion and Differentiation, progression in learning from the FS to KS3, and Cross curricular links
  • 3.
    NC requirements: 5stages to data handling Posing questions Collecting data Processing the data Representing the data Interpreting the data NB: Some activities involve some of these stages All these stages need learning about Some activities need to involve all 5 stages
  • 4.
    Progression in sortingSorting Positive attribute labels (Sort first, label later) Positive attributes and then negation (Label first then sort - red, not red) Types of sets Unstructured sets (random eg toy cars) Structured sets (Compare bears – small, medium & large bears in blue, red, yellow & green)
  • 5.
    Additional techniques forsorting Venn diagram Carroll diagram Decision tree
  • 6.
    Suggested progression A suggested sequence for progression 3D data (use the shoes!) 3D representation (cubes illustrating 1-1 correspondence) Post it pictograms (moving towards the abstract) Block graphs (Vertical axis and labels) Bar graphs Different to block graph Labelling issues – the line is labelled not the block Pie charts Line graphs (Is this suitable?)
  • 7.
    ICT in datahandling When can this be useful? What have you seen? ICT dilemma – when exploring software such as Excel children will want to try these out This is not always the best type of chart to use Pie charts Prior knowledge? Some children will have seen this style of representation and wish to emulate it Differences Pie charts use proportional representation, not numerical representation, therefore .. Labelling size of data sample is important
  • 8.
    ICT to presentdata Using ICT opportunities 2Simple software: 2graph Handy graph Data handling Line graph Excel
  • 9.
    Asking questions andinterpreting data Look at this temperature data Write a question to develop interpreting data skills for Simple questions Intermediate questions Difficult questions What sort of questions did you write? Compare questions with notes from previous lecture
  • 10.
    Interpretation tools Mathematicsneeded to augment data handling skills Averages Mean Median Mode
  • 11.
    Calculating averages Usetemperature readings to calculate the session Mean temp Median temp Mode temp Are there any differences? Why? When would you use each type of “average”? Why?
  • 12.
    Presenting “averages” Wherehave you seen averages displayed? What about “box & whisker” graphs? Sats scores Good for illustrating spread, range and concentration of scores
  • 13.
    Directed task Overthe hols use a mathematics subject knowledge book (eg Haylock) to develop an awareness of the different kinds of discrete and continuous data there are. Discrete data Unordered discrete data (Categories with no sense of order) Ordered discrete data (Data values have clear sense of order) Grouped discrete data (Discrete data grouped to make process manageable) Continuous data Pseudo continuous data (Results of measurement for discrete values) “ Real” continuous data (Results from measurements and every possible value has a meaning)