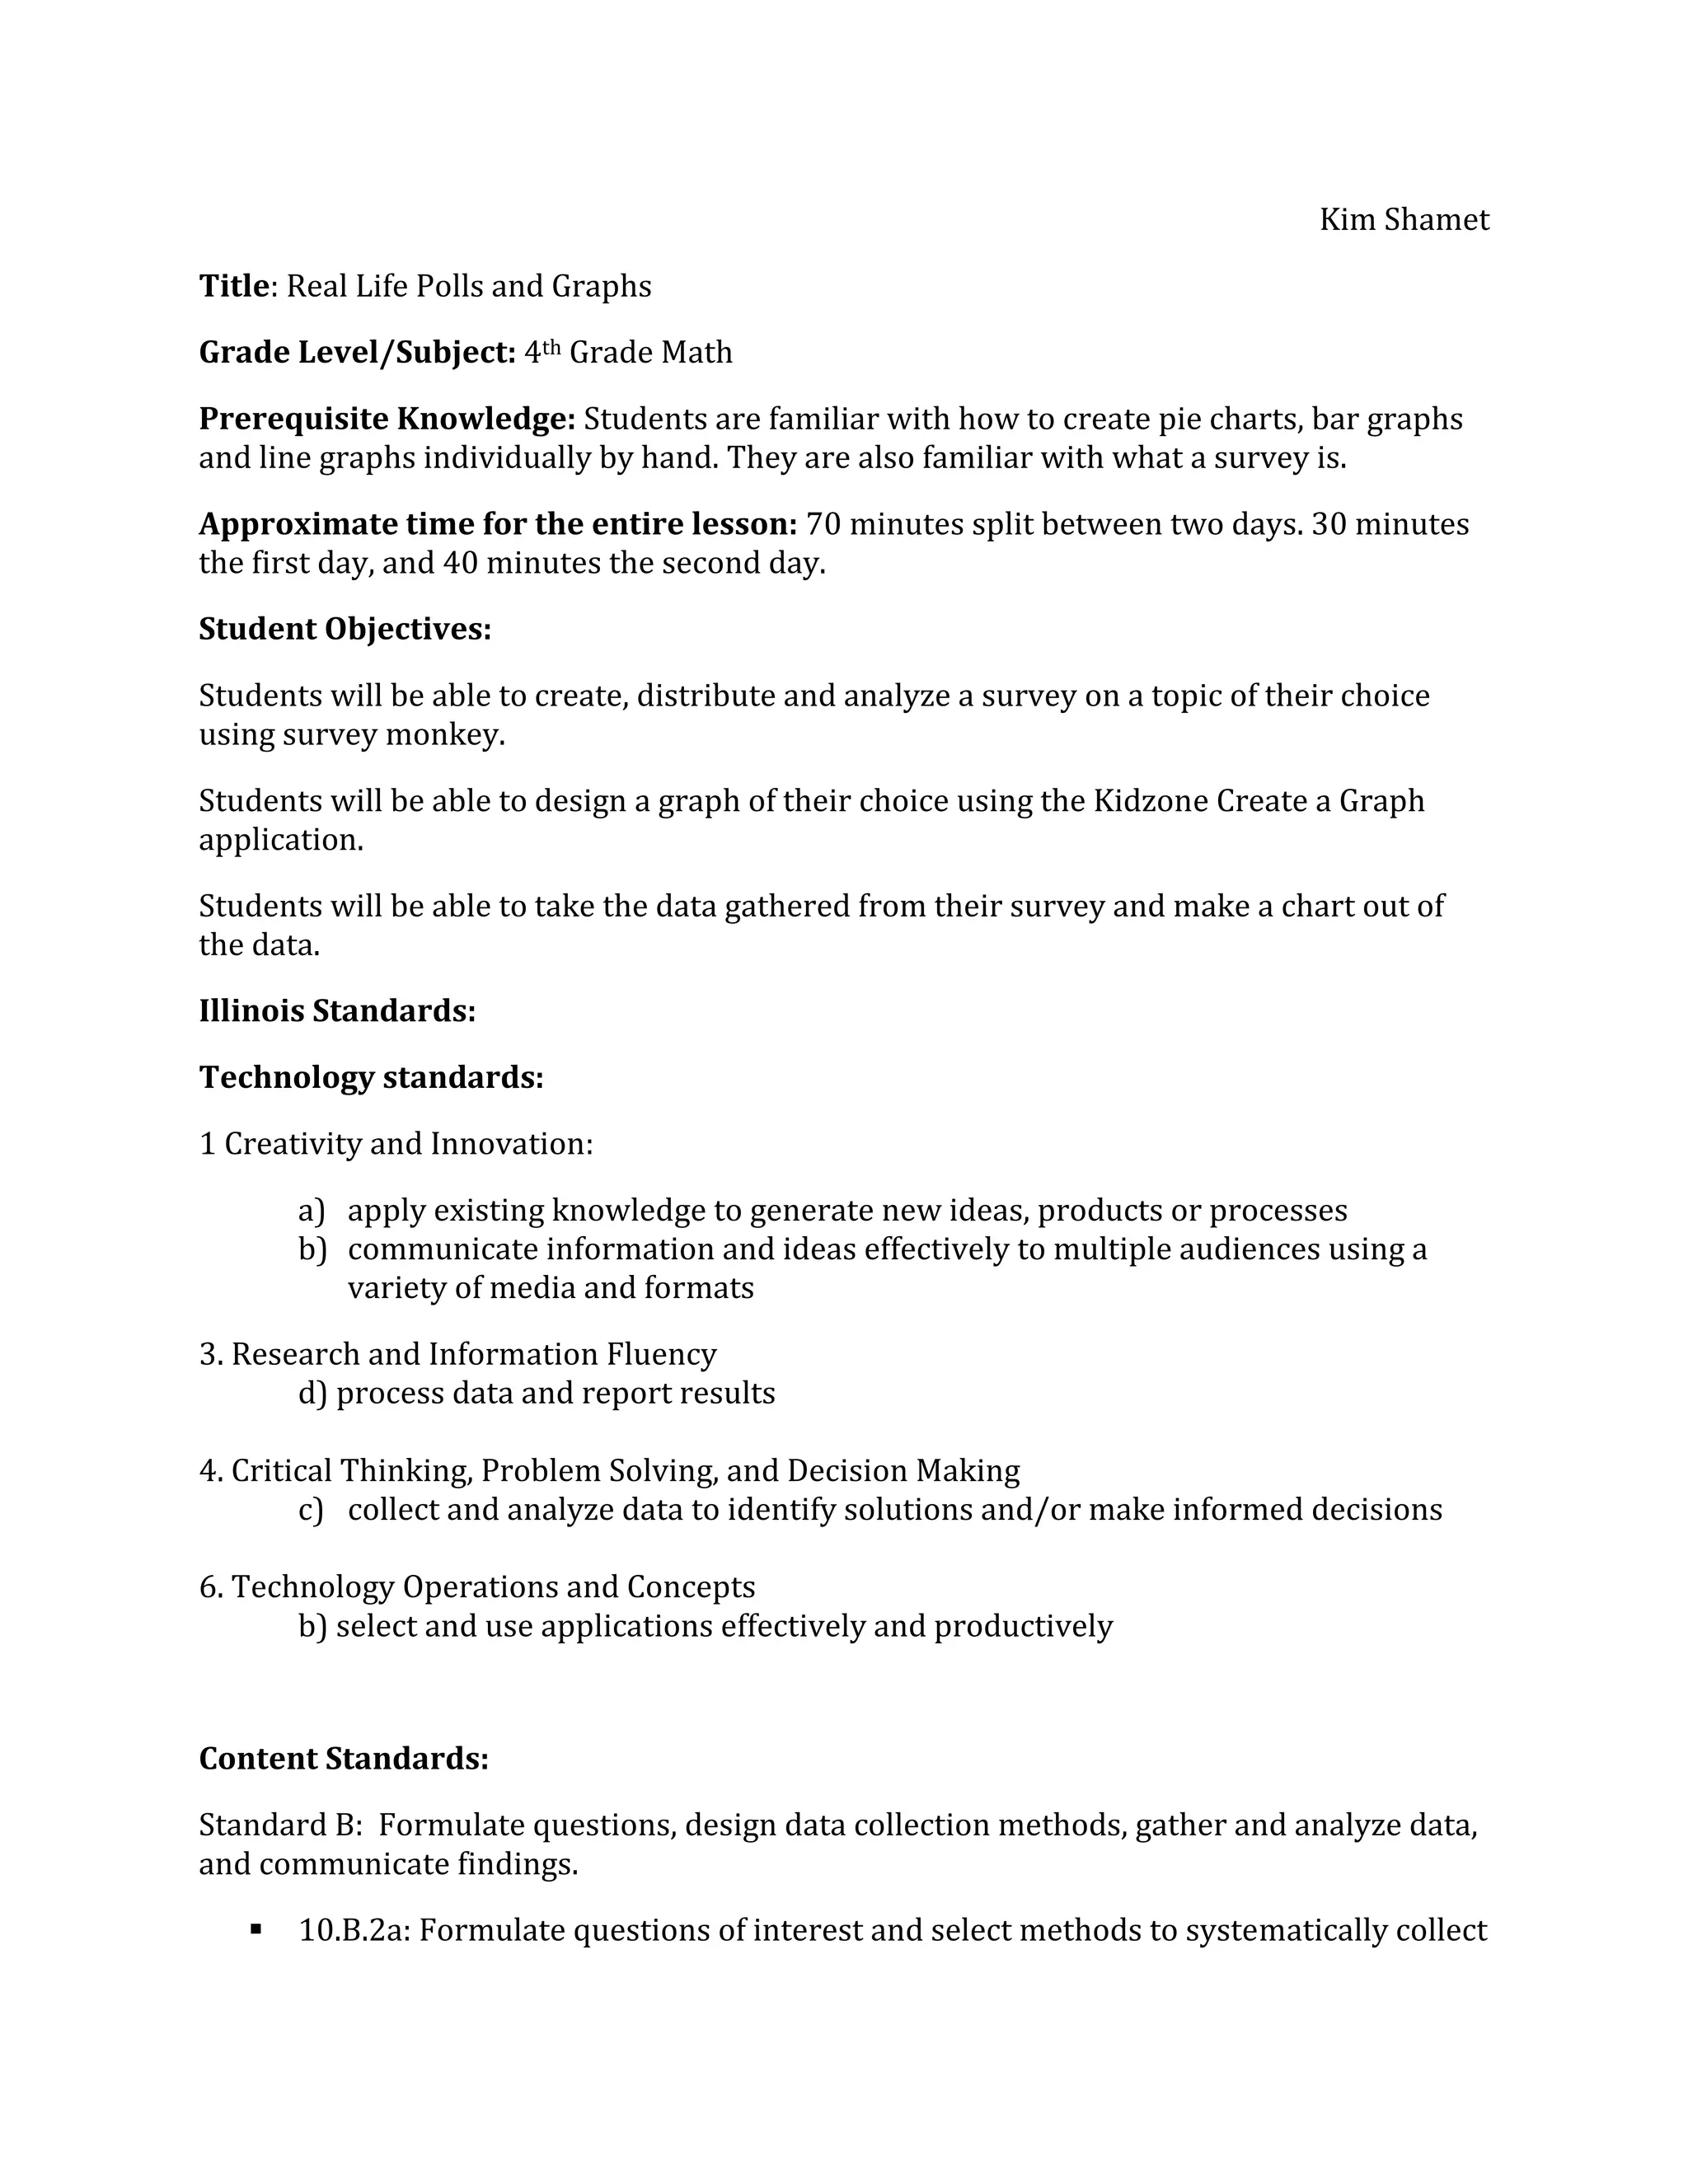
This lesson plan teaches 4th grade students how to create and distribute surveys using Survey Monkey, analyze the survey results, and create graphs of the data using the Kidzone application. Over two days, students will work in pairs to design a survey, distribute it to classmates, analyze the results in a data table and hand-drawn graph, and create an electronic graph using Kidzone. Students' understanding will be assessed using a rubric evaluating their data tables, graph properties, and use of survey and graphing tools. The lesson aligns with Illinois technology and math standards.
![Artifact: Lesson Plan for Web 2.0 Application
Technology Standard 3 - Application of Technology in Instruction: The competent
teacher will apply learning technologies that support instruction in his or her grade
level and subject areas. He or she must plan and deliver instructional units that
integrate a variety of software, applications, and learning tools. Lessons developed
must reflect effective grouping and assessment strategies for diverse populations.
I think this standard relates to understanding how technology can be effectively used in the
classroom. In some cases technology is used as a crutch for teachers and not as an aide in
the lesson. Teachers may just set students down at a computer and have them play a game
in order to teach them a lesson. The competent teacher knows that technology should be
used as support for students in their understanding of the lesson. Technology can also be
used a way to differentiate instruction for students who may not understand the material
as well as their peers. Technology can help that student get back to the level that they need
to be at.
The article that I chose for this was a lesson plan that contained a Web 2.0 application. I
used previous learned knowledge of charts and connected it to a Web 2.0 application that
the students could use to see and make charts in a different way. This lesson plan allowed
me to “understand how to apply learning technologies that support instruction in [my]
grade level and subject areas” because I was able to connect the application to something
that the students previously learned and that was easy for them to figure out how to
operate. Technology applications are only useful if the students understand how to work
them. Before I chose which application I wanted to use in my lesson plan I was able to](https://image.slidesharecdn.com/web2-0lessonplant3-111204132934-phpapp02/75/Web-2-0-lesson-plan-t3-5-2048.jpg)


![Coded Agents – with UiPath SDK + LangGraph [Virtual Hands-on Workshop]](https://cdn.slidesharecdn.com/ss_thumbnails/codedagentsdeck-251215155422-5497c599-thumbnail.jpg?width=640&height=640&fit=bounds)


