Technology has greatly expanded the role of mathematics beyond traditional academic uses. New fields like operations research, control theory, and signal processing now rely on both mathematics and technology. A variety of technologies are commonly used in classrooms today, including computers, online study tools, blogs/wikis, microphones, mobile devices, interactive whiteboards, and digital games. These tools enhance teaching and learning by making lessons more interactive, visual, and engaging for students. Calculators like graphing, scientific, and matrix calculators also provide hands-on experience with mathematical concepts.
Mathematics is essential in technology and industry today, enhancing teaching through tools like computers, online tools, mobile devices, and interactive technologies.
Mathematics is essential in technology and industry today, enhancing teaching through tools like computers, online tools, mobile devices, and interactive technologies.
Mathematics is essential in technology and industry today, enhancing teaching through tools like computers, online tools, mobile devices, and interactive technologies.
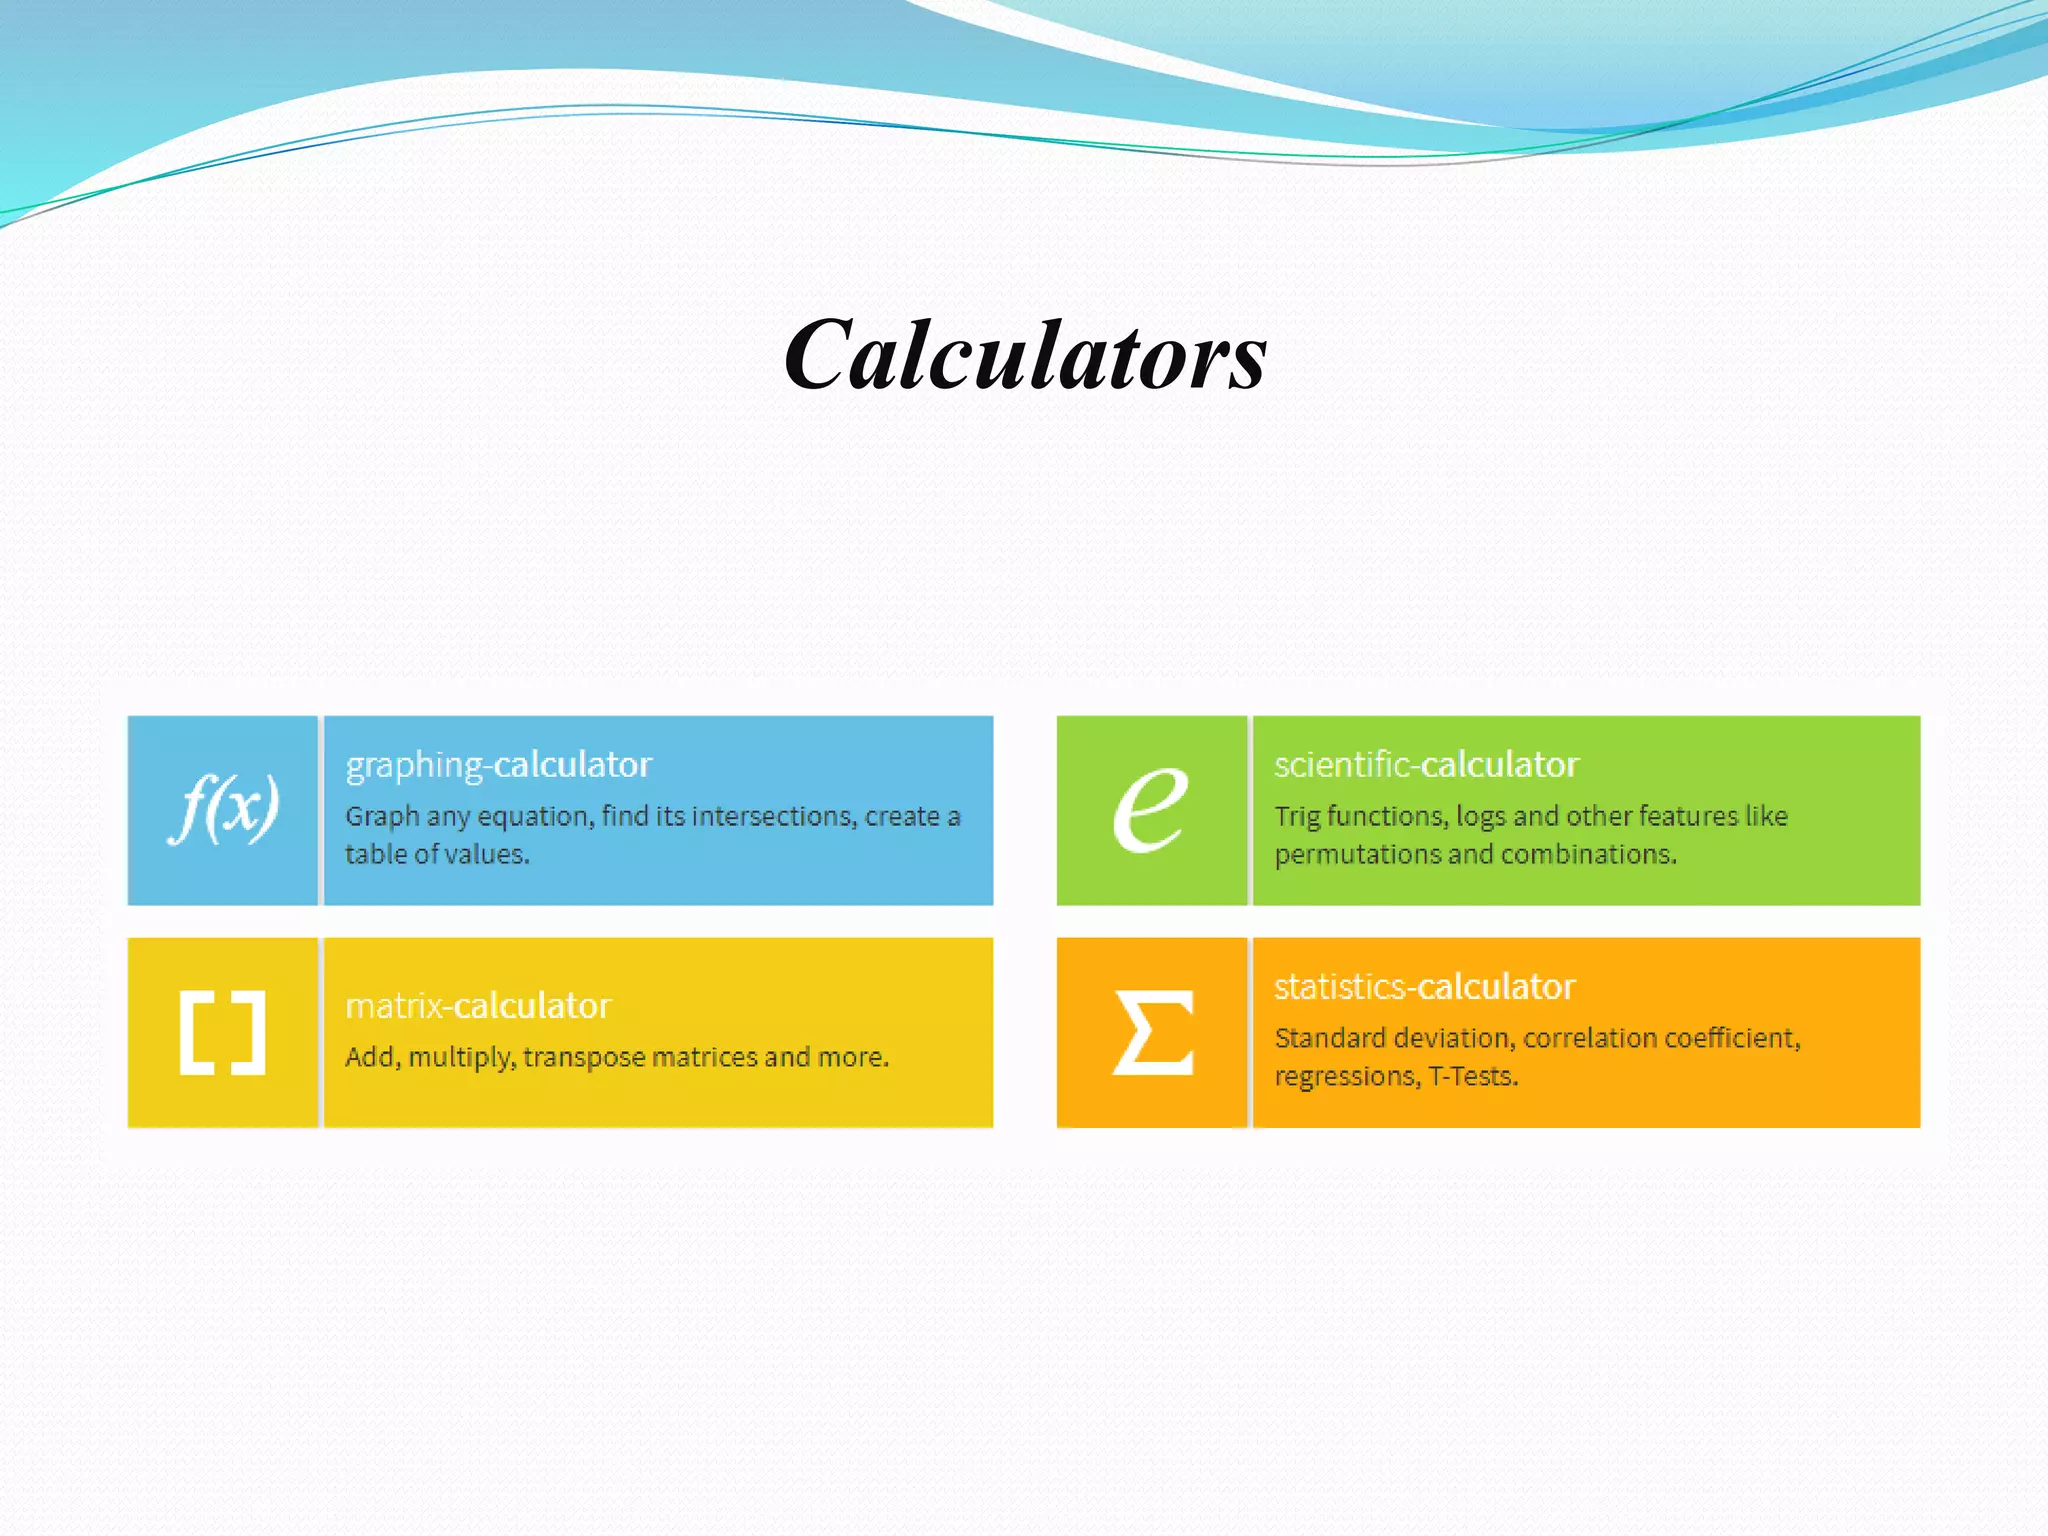
Various calculators (basic, graphing, scientific, statistics) enhance learning by supporting complex computations and functions necessary for advanced mathematics.
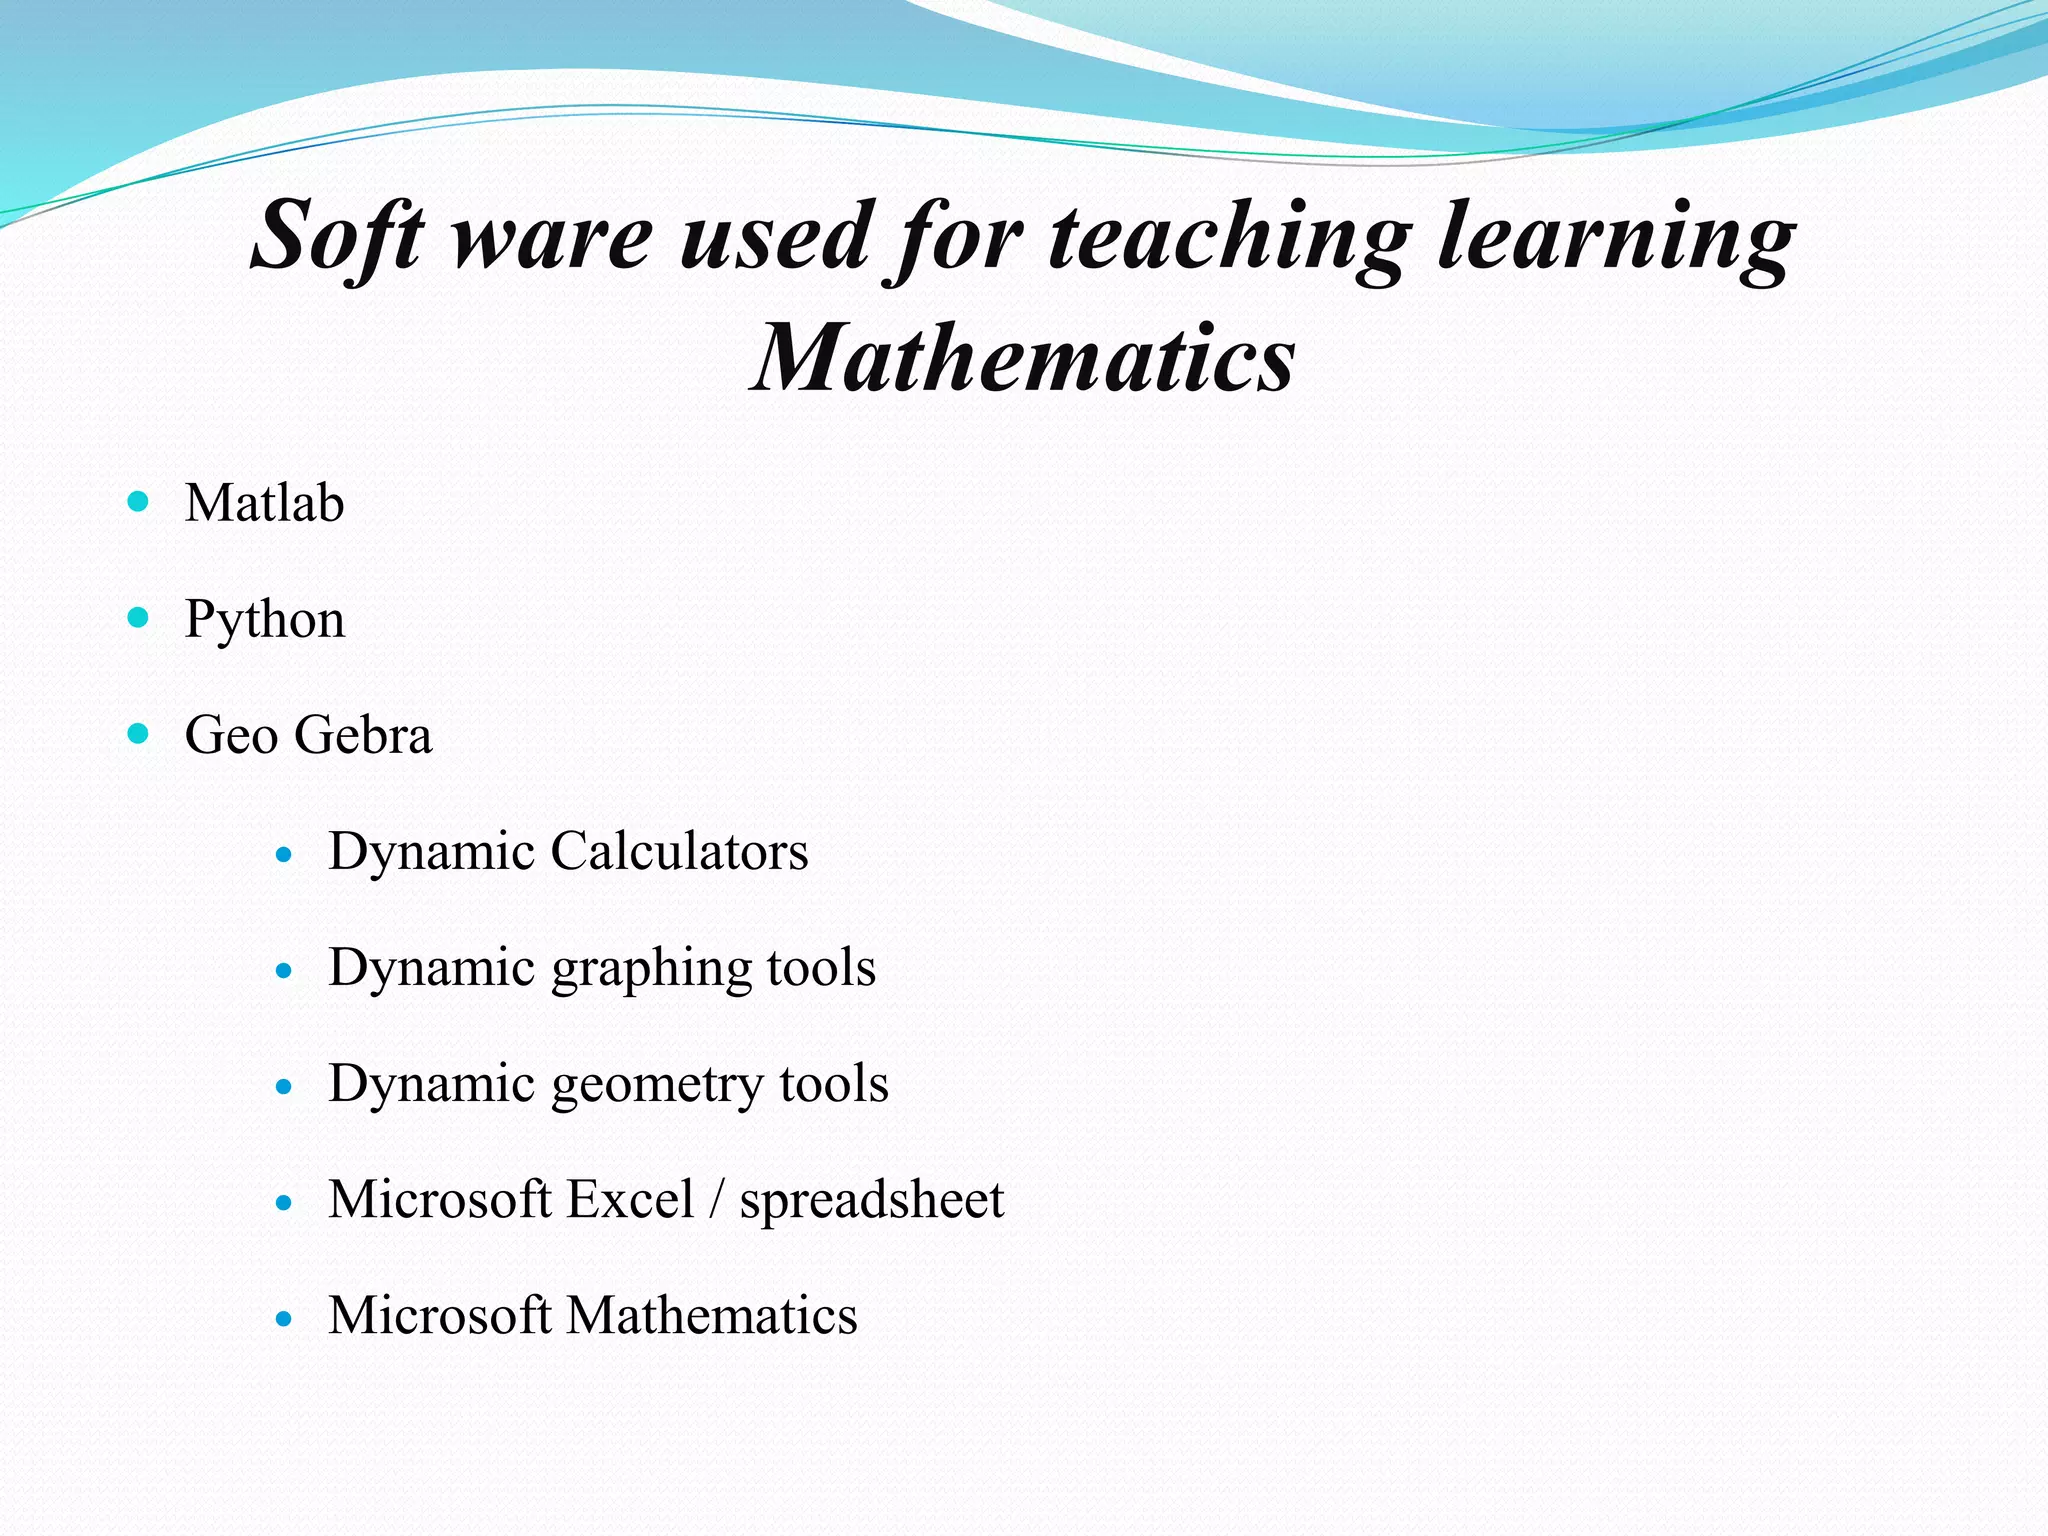
Dynamic graphing tools like amCharts and Flot assist in visualizing complex data, while MATLAB and Python provide essential environments for mathematical modeling.
GeoGebra software offers diverse views for mathematical exploration, facilitating both algebraic and graphical representations for deeper learning.
Key mathematicians contributed foundational technologies: Pascal's adding machine, Babbage's engines, and their impacts on modern computing. Mathematics is foundational for computer science, impacting programming, algorithms, and system operations, with key areas like linear algebra and number theory.
Graphs are crucial for data management in computer science; linear algebra is pivotal in operations like internet search and game development.
Mathematics applies across fields like biology, chemistry, medicine, and engineering, aiding calculations and analyses essential for advancements.
Technology in Mathematics
Mathematics is regarded as the queen of all Sciences. For long, the role of
Mathematics was limited to purely academic domain. Now, the role of
Mathematics is not restricted to purely academic domain.
It has entered the domain of Technology and Industry. New fields in
Mathematics such as Operation Research, Control theory, Signal Processing
and cryptography have been generated which need technology.
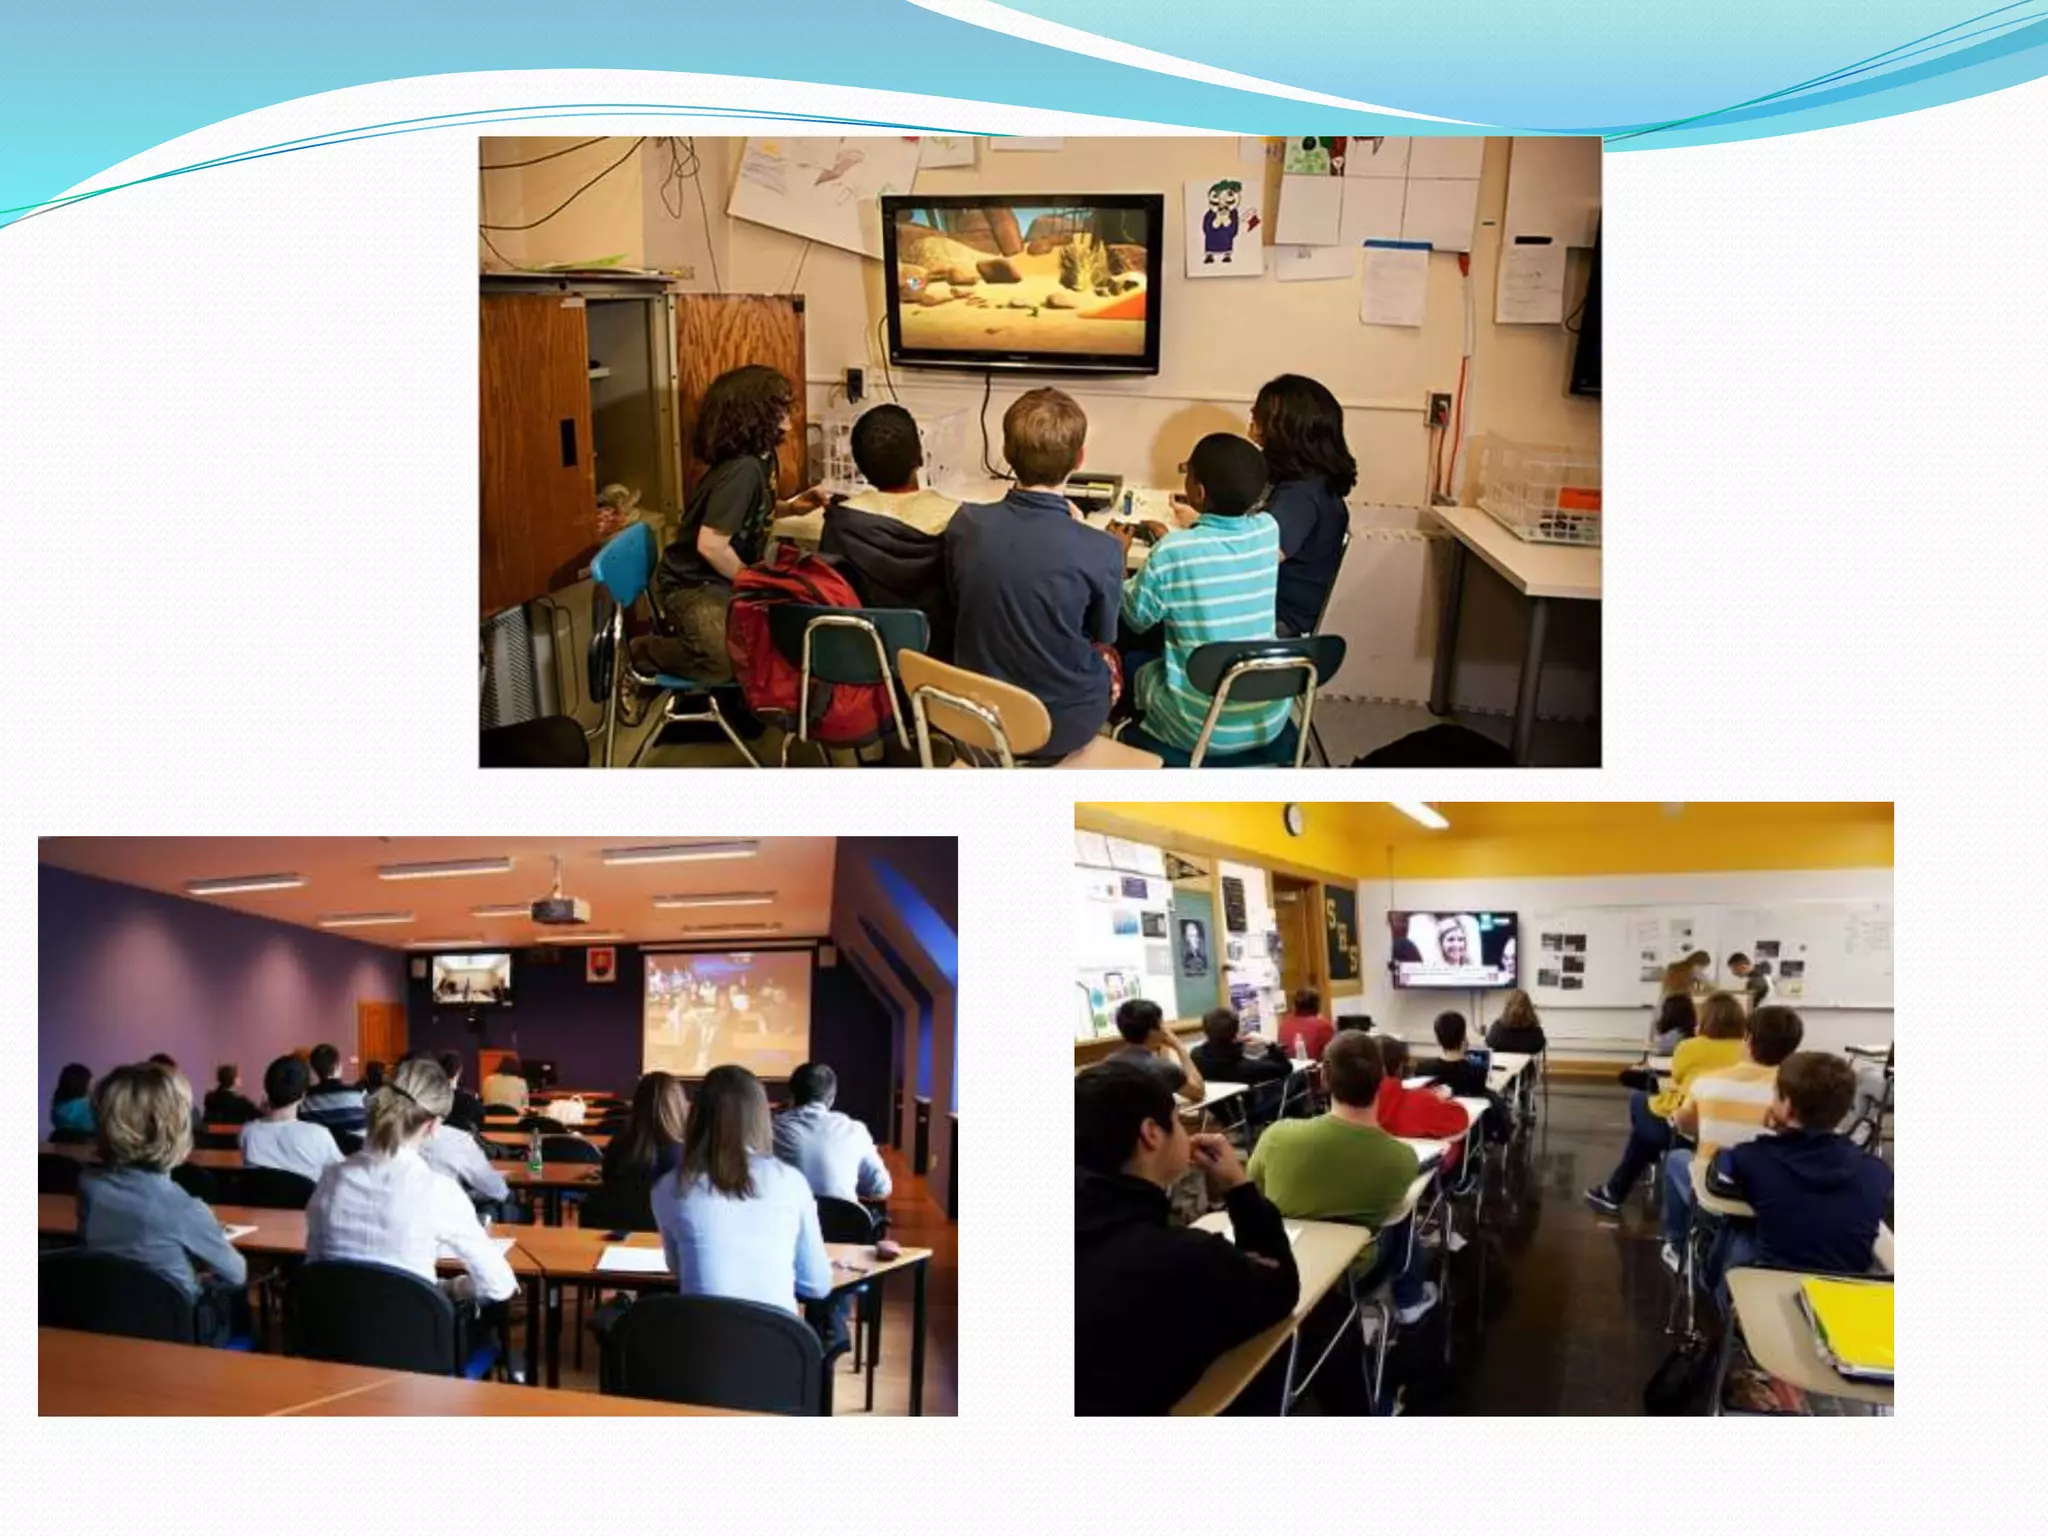
There are various types of technologies currently used in traditional
classrooms. Among these are: Radio, television, audio tape, video tape, slide
projector, overhead projector are of passive learning when interaction of the
learner is less.
5.
How to useTechnology as tools of
Teaching
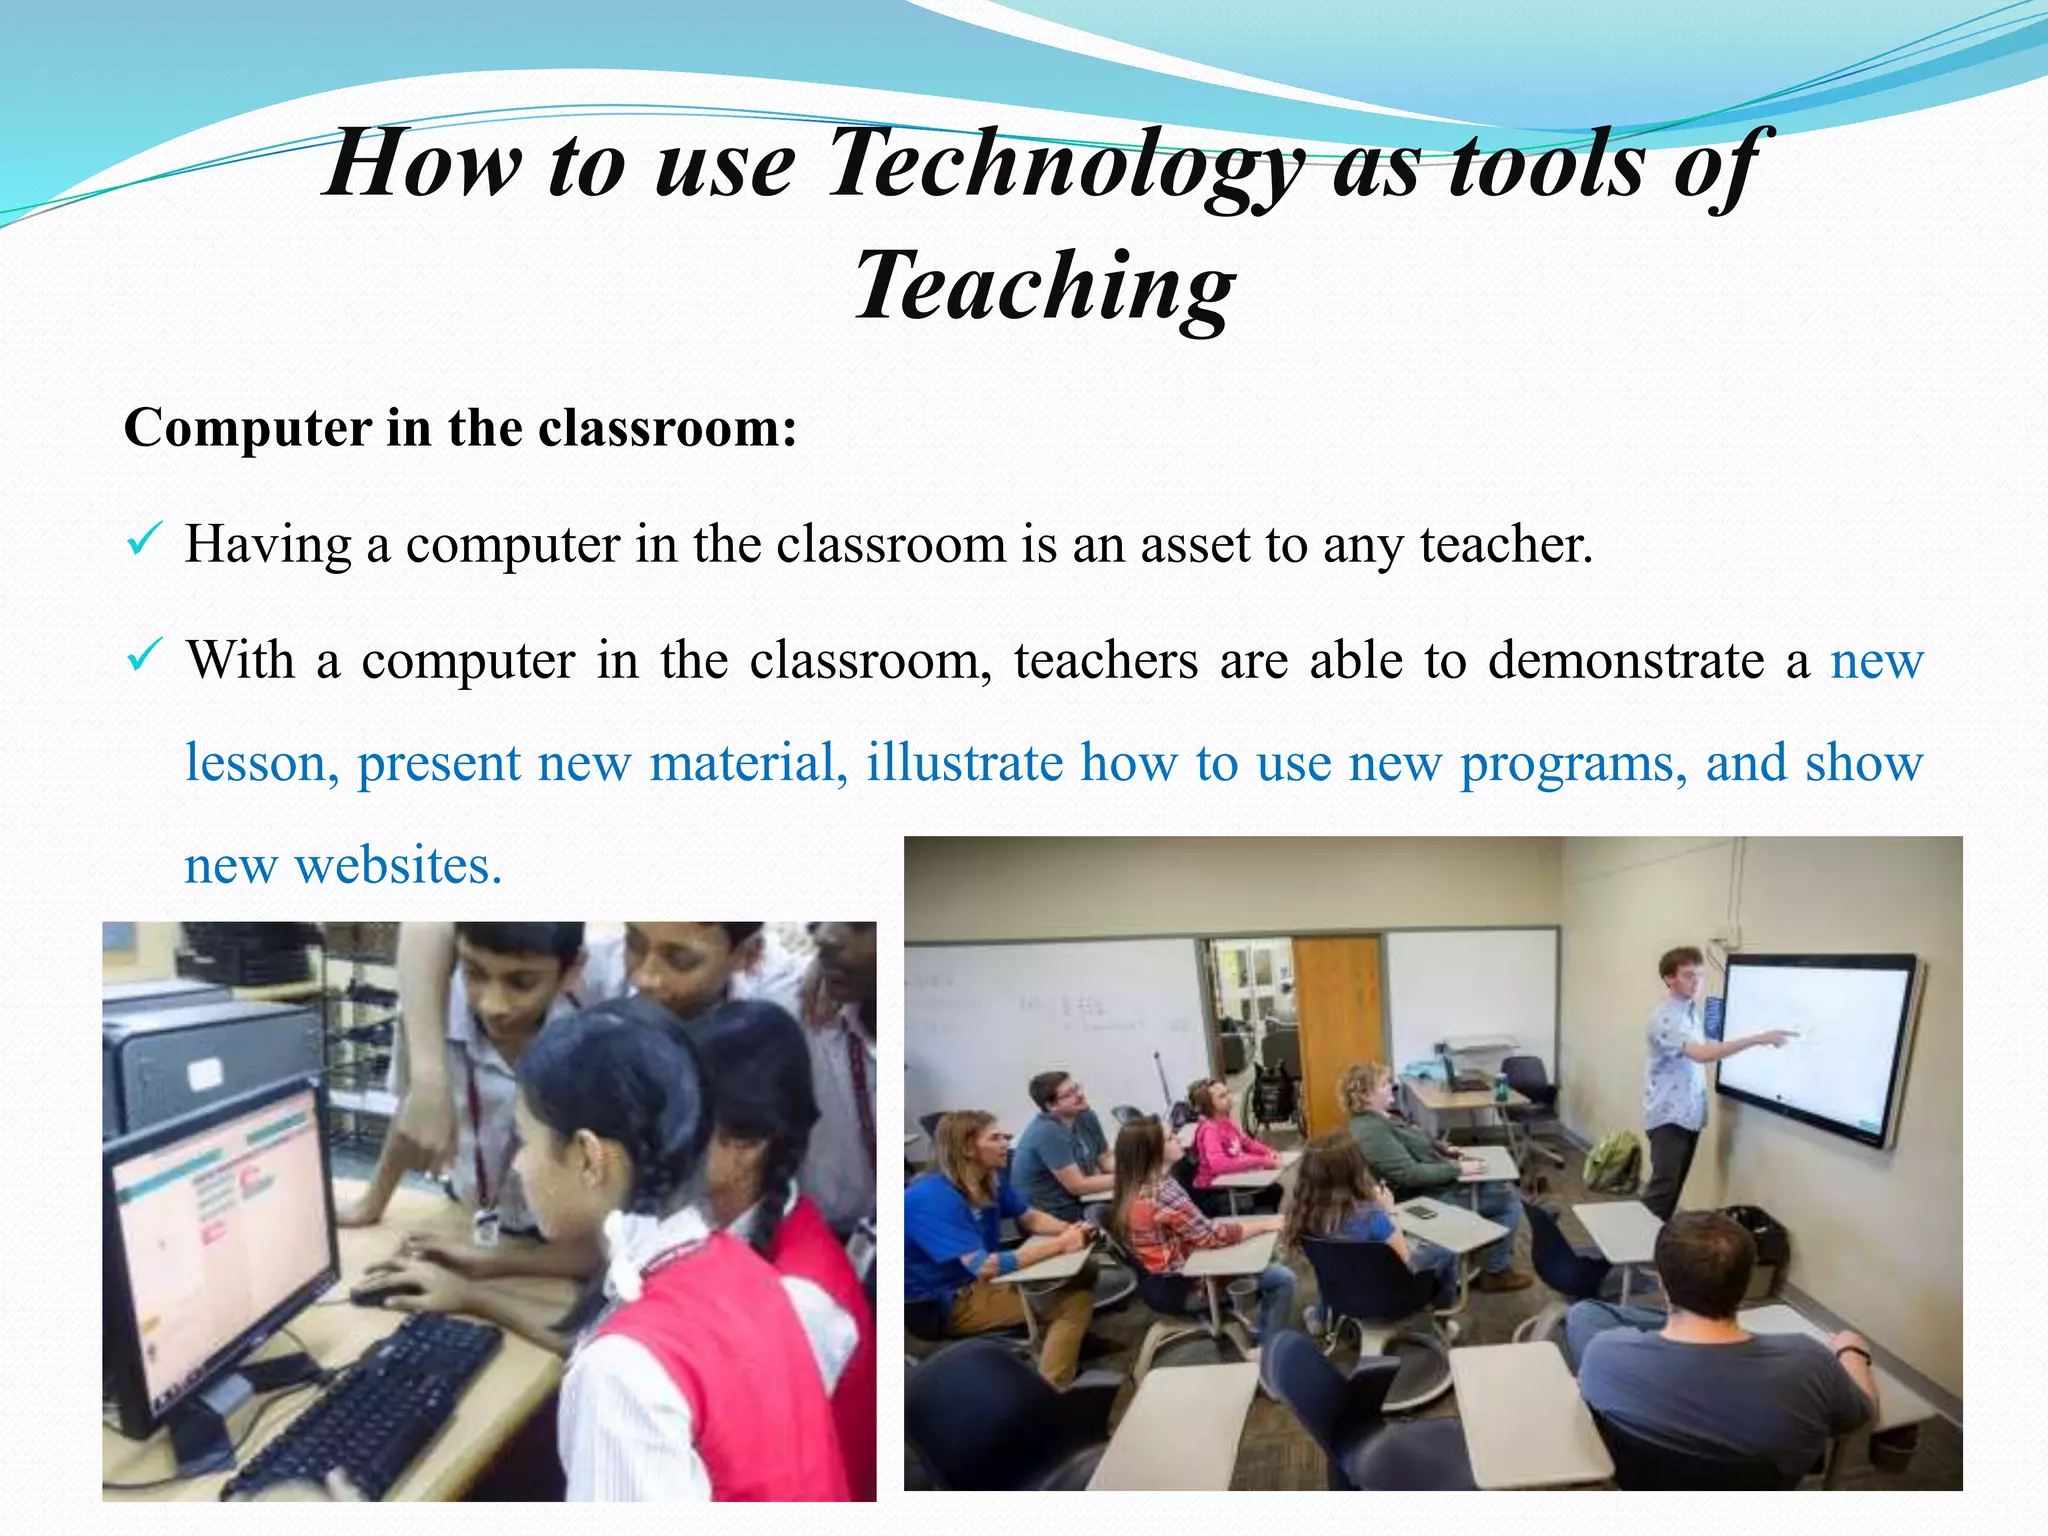
Computer in the classroom:
Having a computer in the classroom is an asset to any teacher.
With a computer in the classroom, teachers are able to demonstrate a new
lesson, present new material, illustrate how to use new programs, and show
new websites.
6.
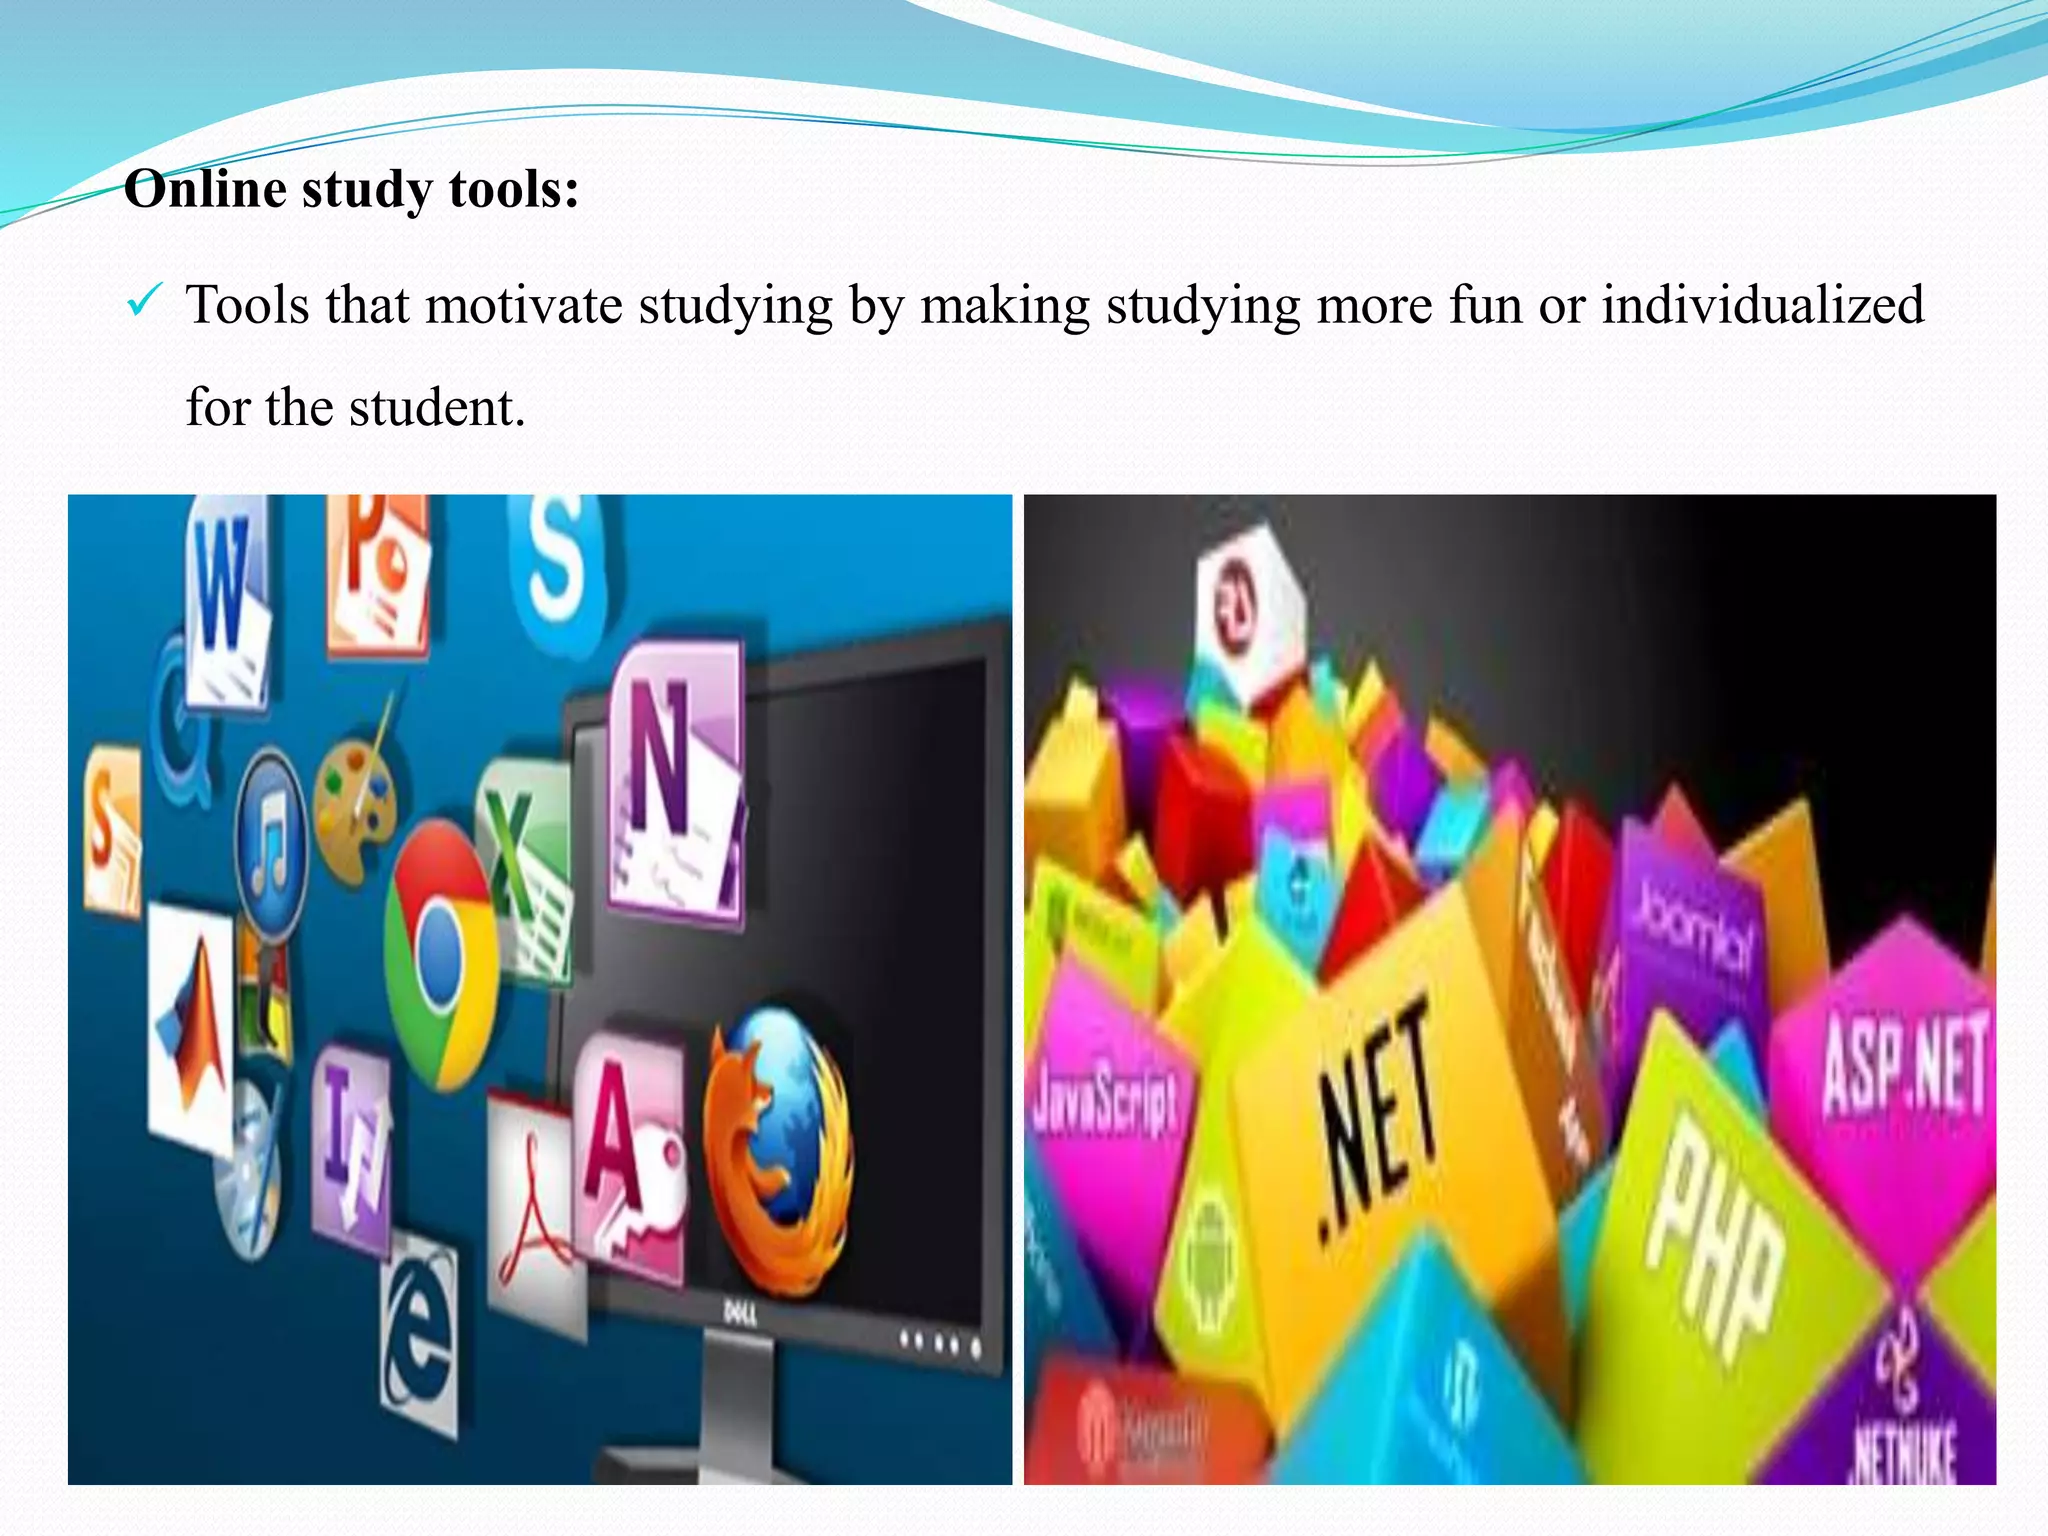
Online study tools:
Tools that motivate studying by making studying more fun or individualized
for the student.
7.
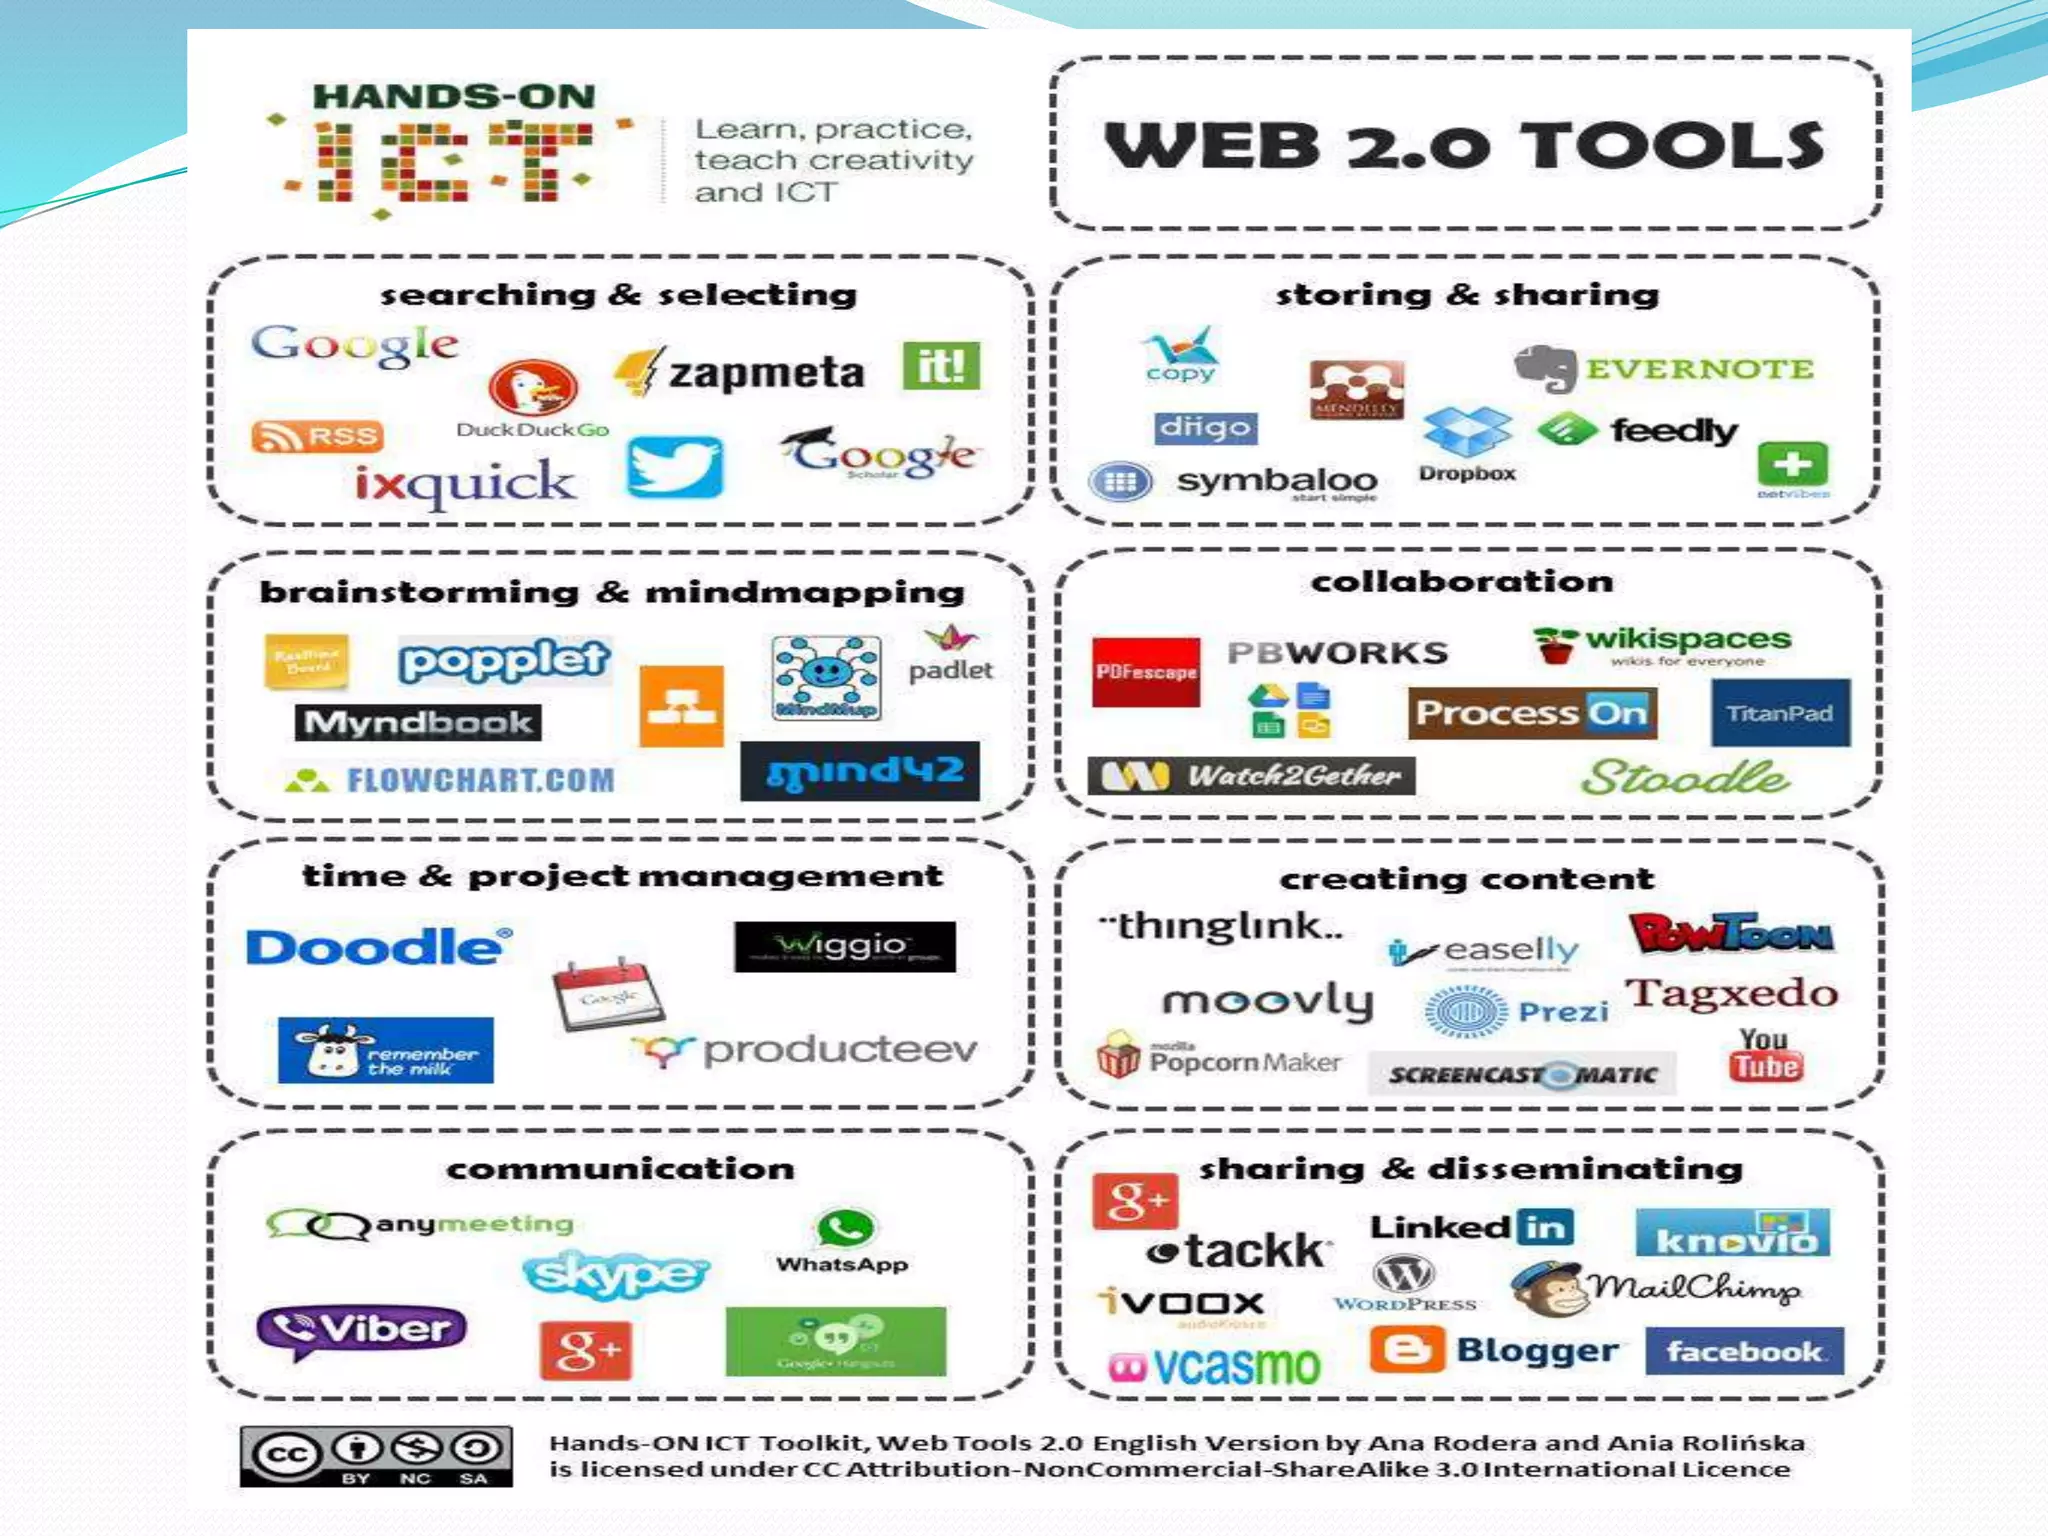
Class blogs andwikis:
There are a variety of Web 2.0 tools that are currently being implemented in
the classroom.
Blogs allow for students to maintain a running dialogue, such as a journal,
thoughts, ideas, and assignments that also provide for student comment and
reflection.
Wikis are more group focused to allow multiple members of the group to
edit a single document and create a truly collaborative and carefully edited
finished product.
9.
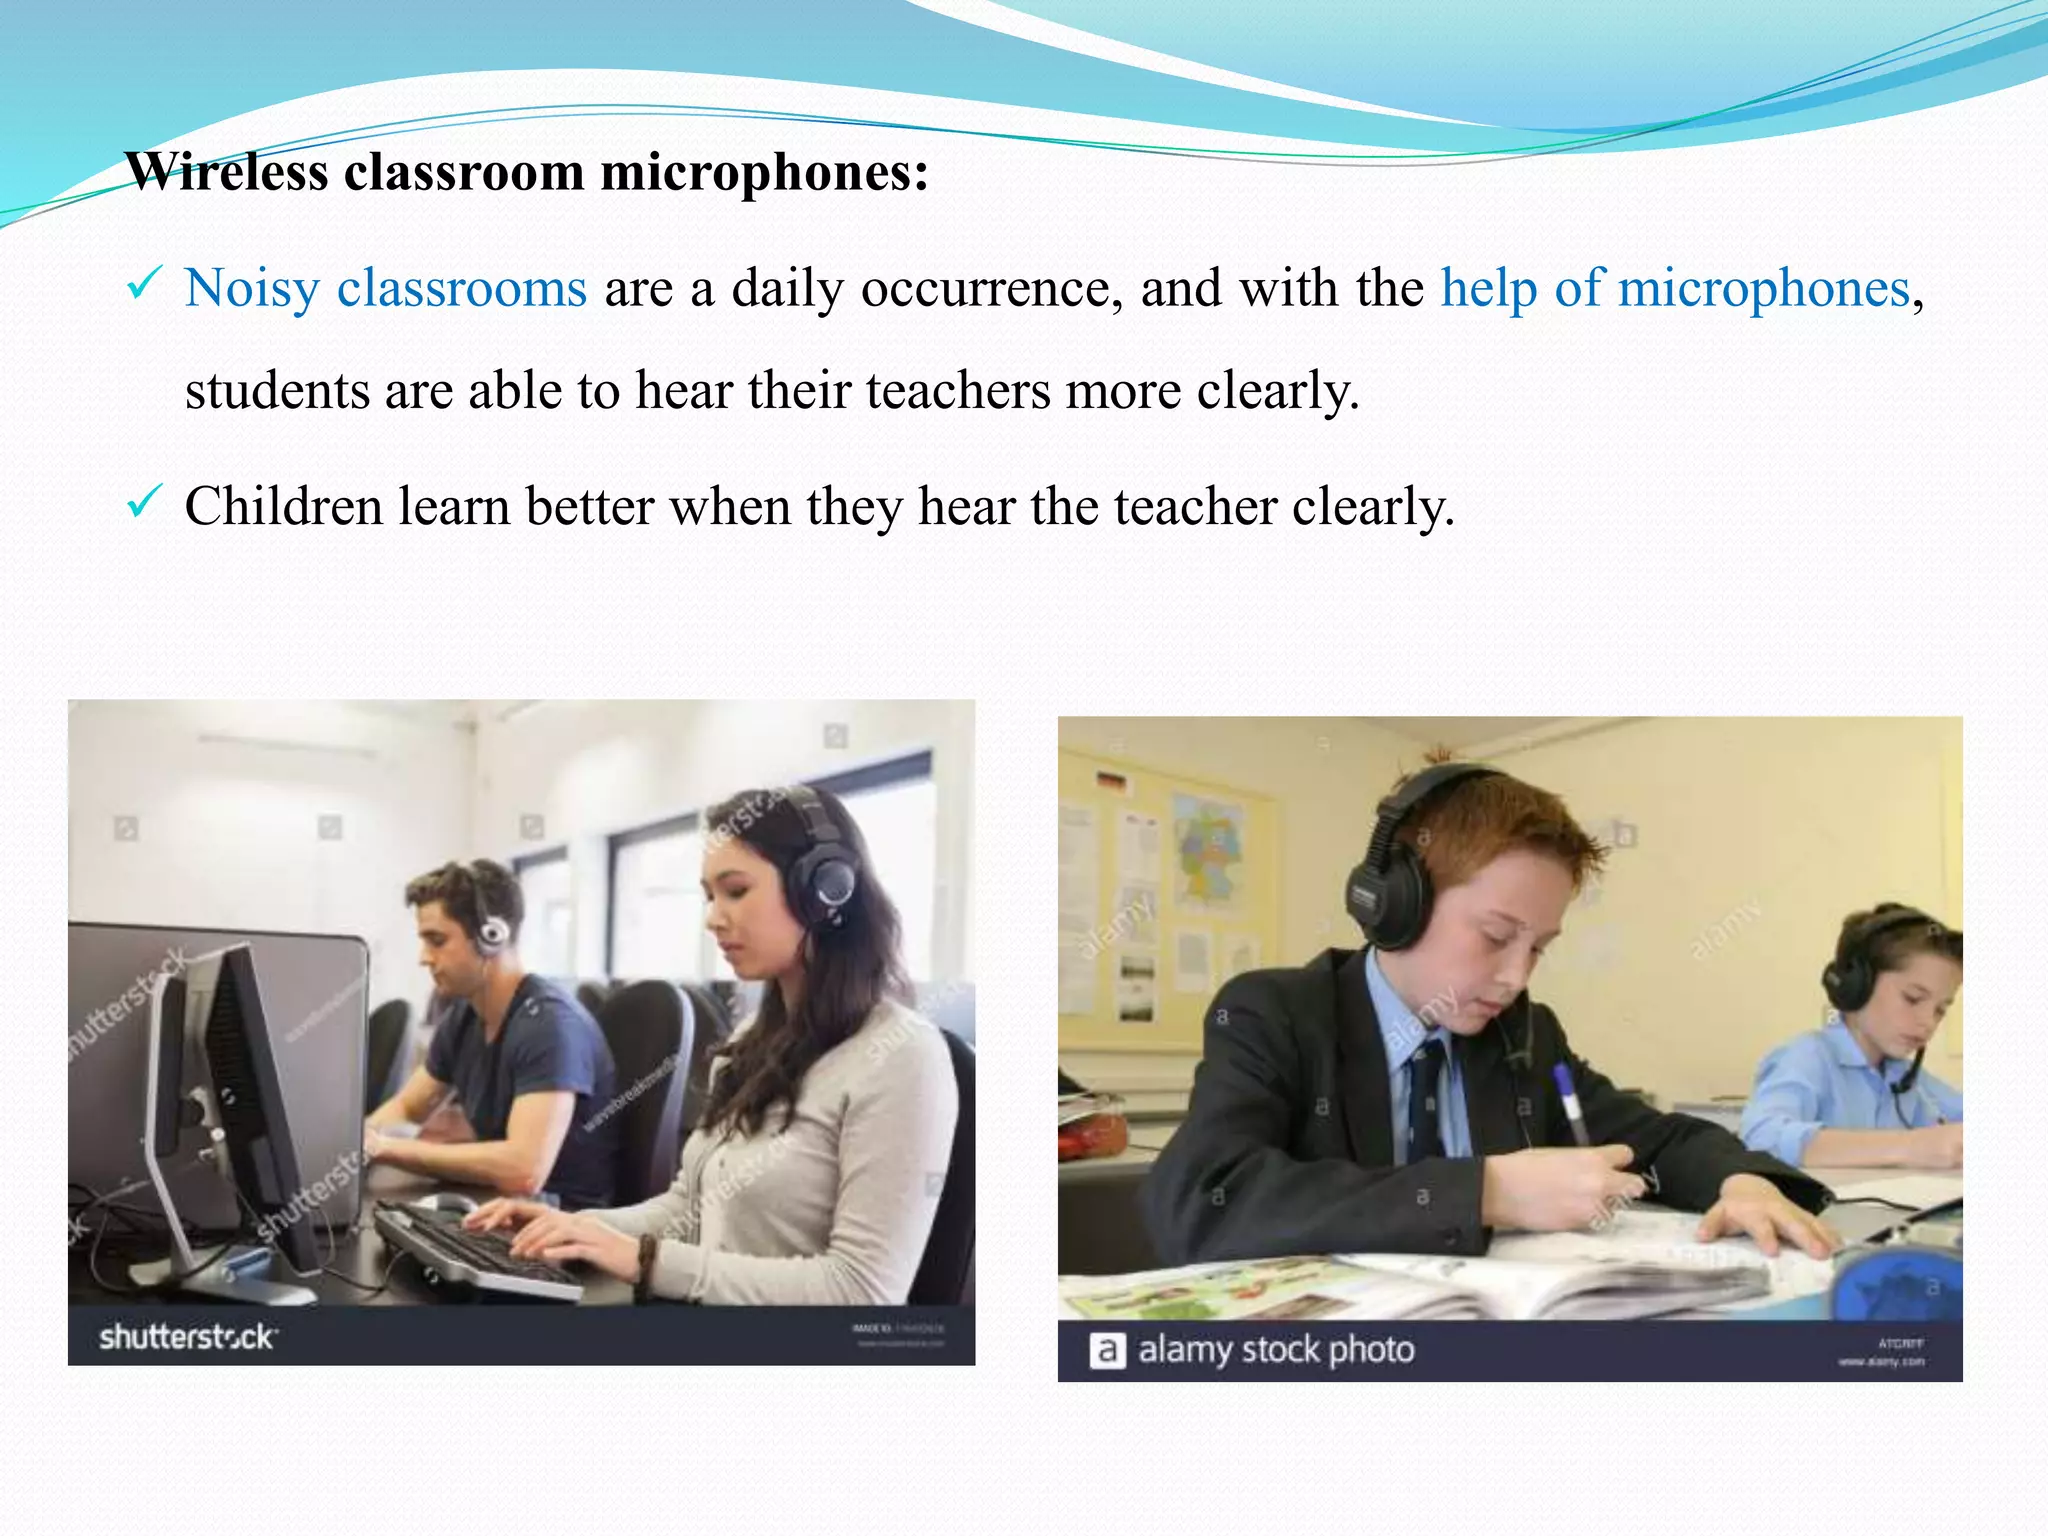
Wireless classroom microphones:
Noisy classrooms are a daily occurrence, and with the help of microphones,
students are able to hear their teachers more clearly.
Children learn better when they hear the teacher clearly.
10.
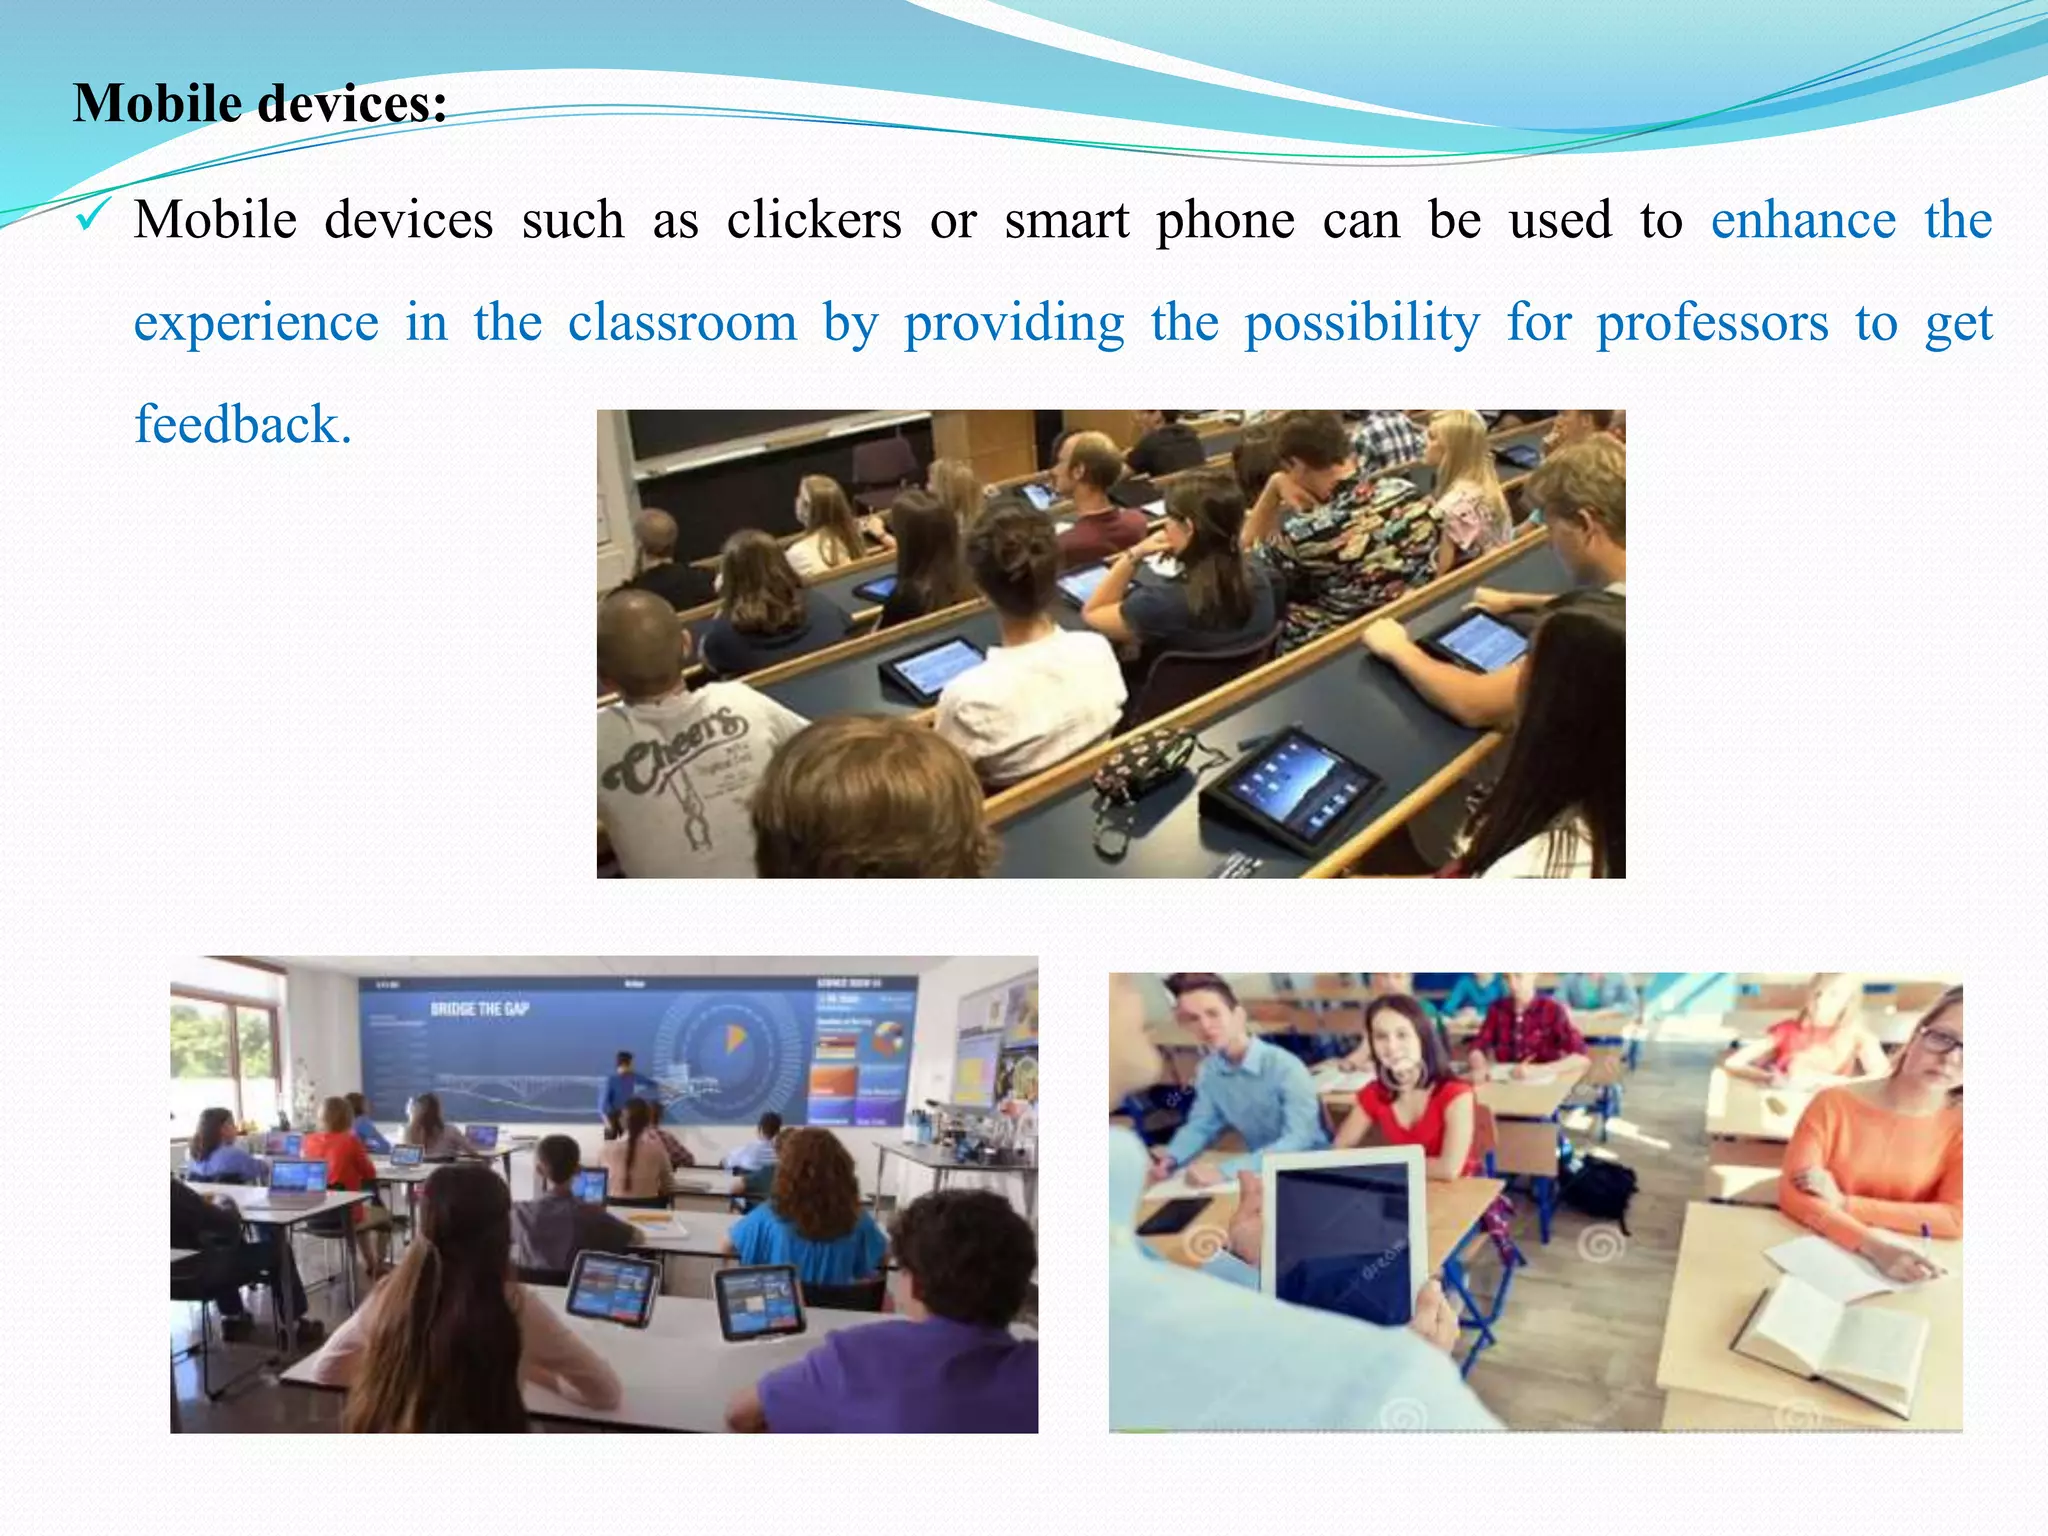
Mobile devices:
Mobiledevices such as clickers or smart phone can be used to enhance the
experience in the classroom by providing the possibility for professors to get
feedback.
11.
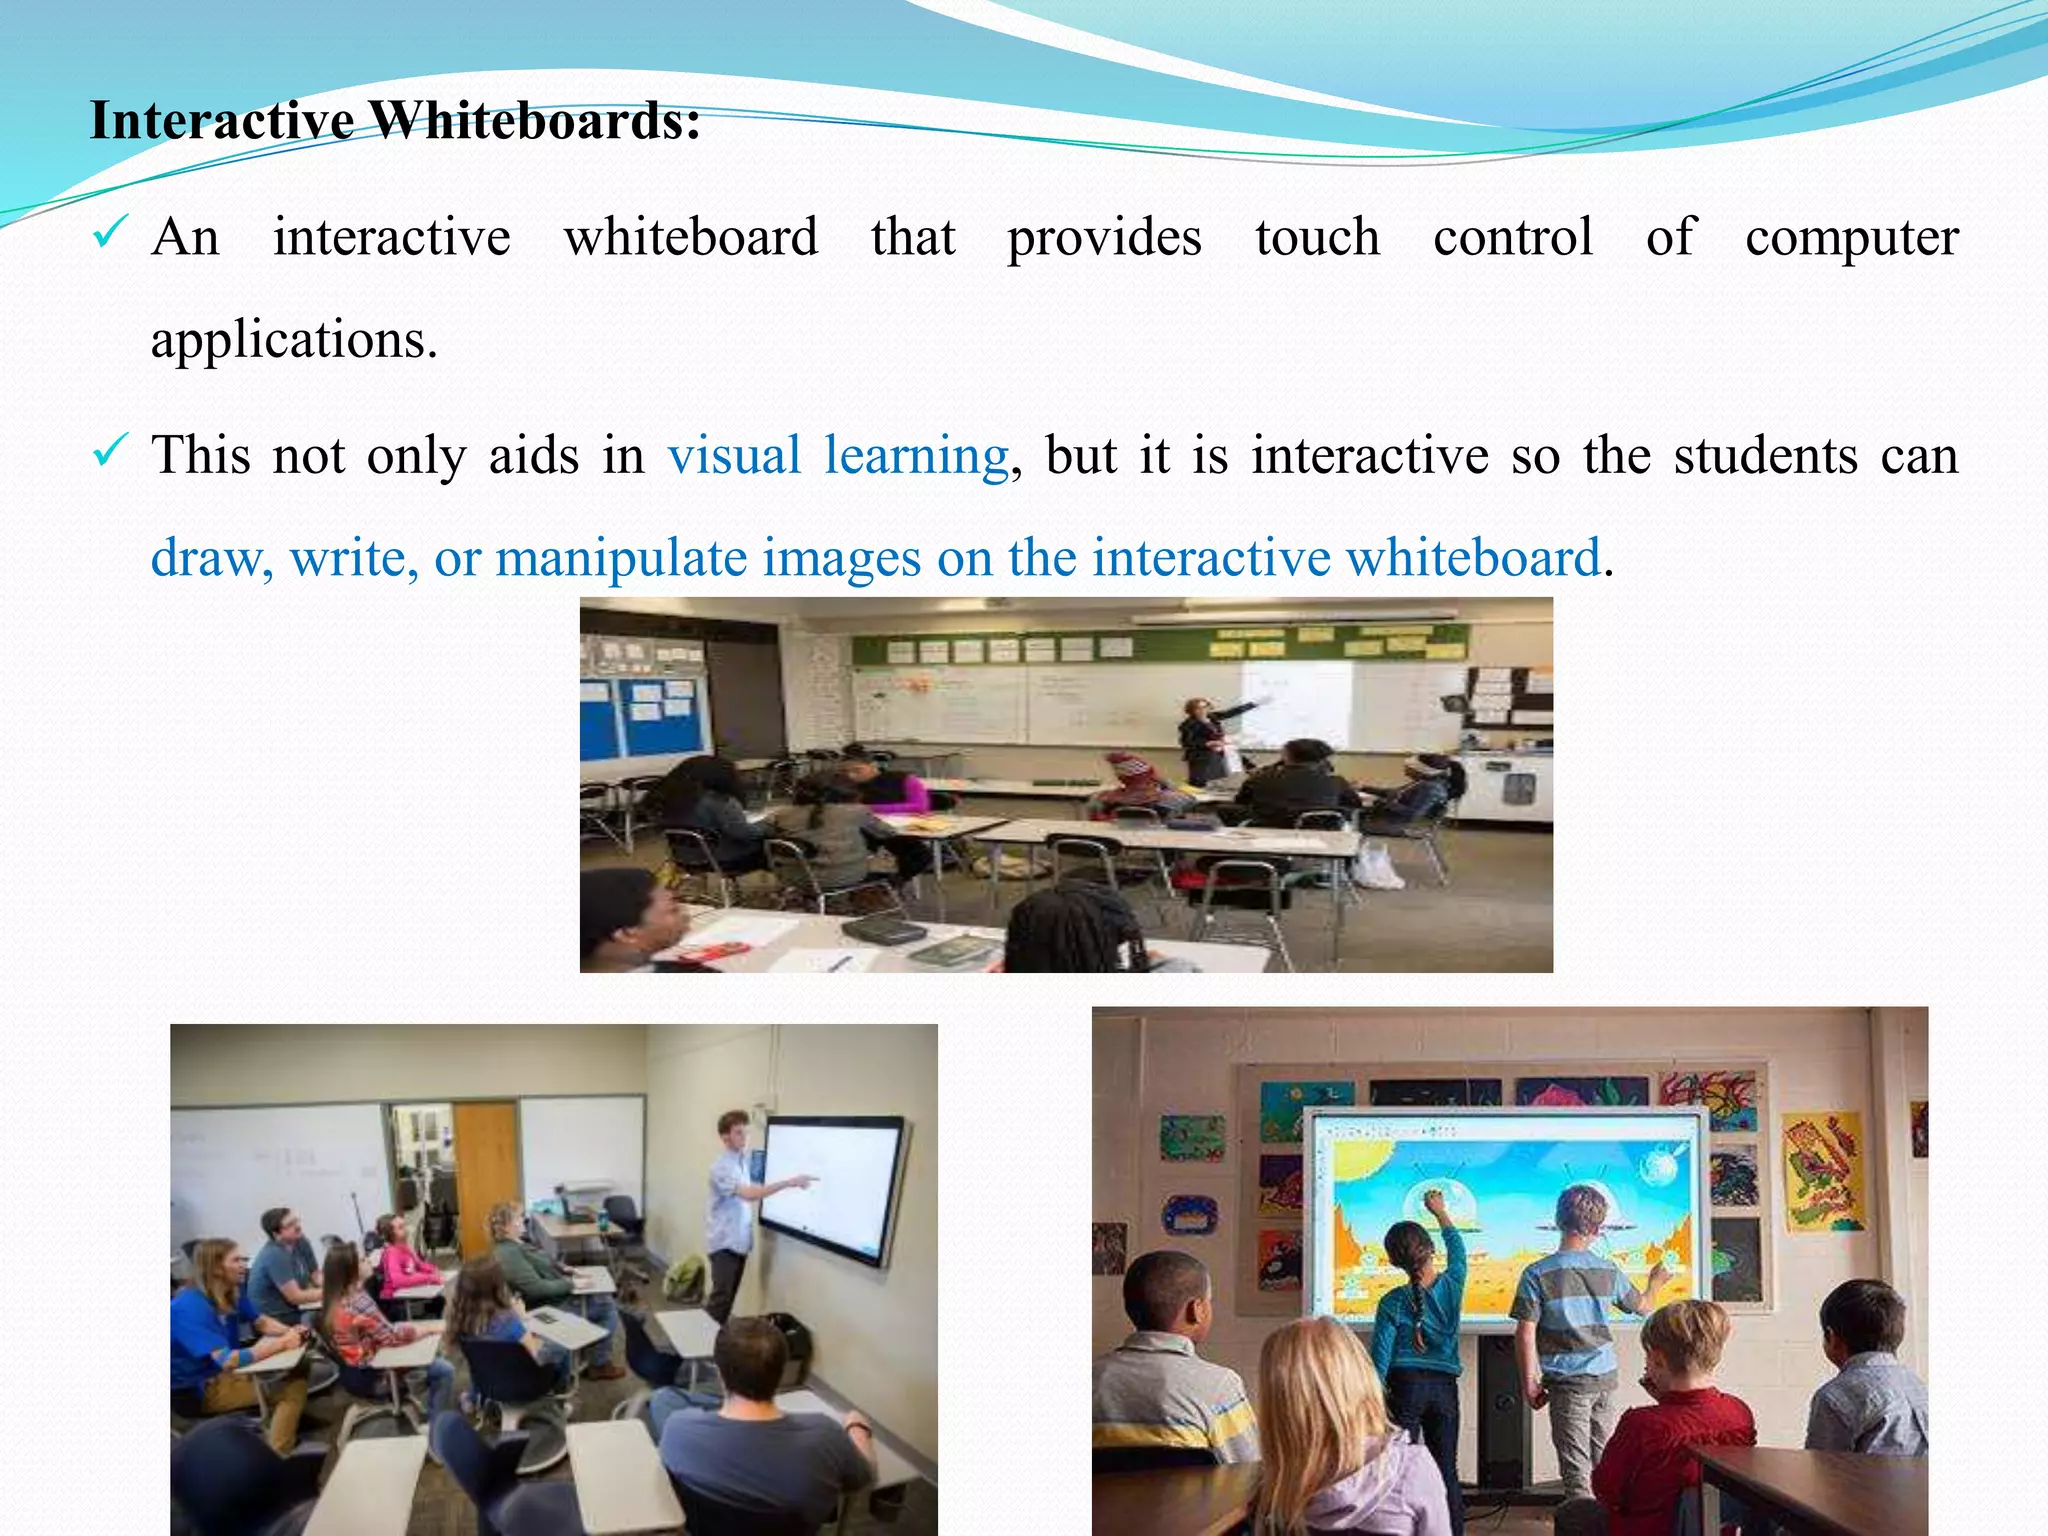
Interactive Whiteboards:
Aninteractive whiteboard that provides touch control of computer
applications.
This not only aids in visual learning, but it is interactive so the students can
draw, write, or manipulate images on the interactive whiteboard.
12.
Digital video-on-demand:
Digitalvideo eliminates the need for in-classroom hardware (players) and
allows teachers and students to access video clips immediately by not utilizing
the public Internet.
Online media:
Streamed video websites can be utilized to enhance a classroom lesson.
14.
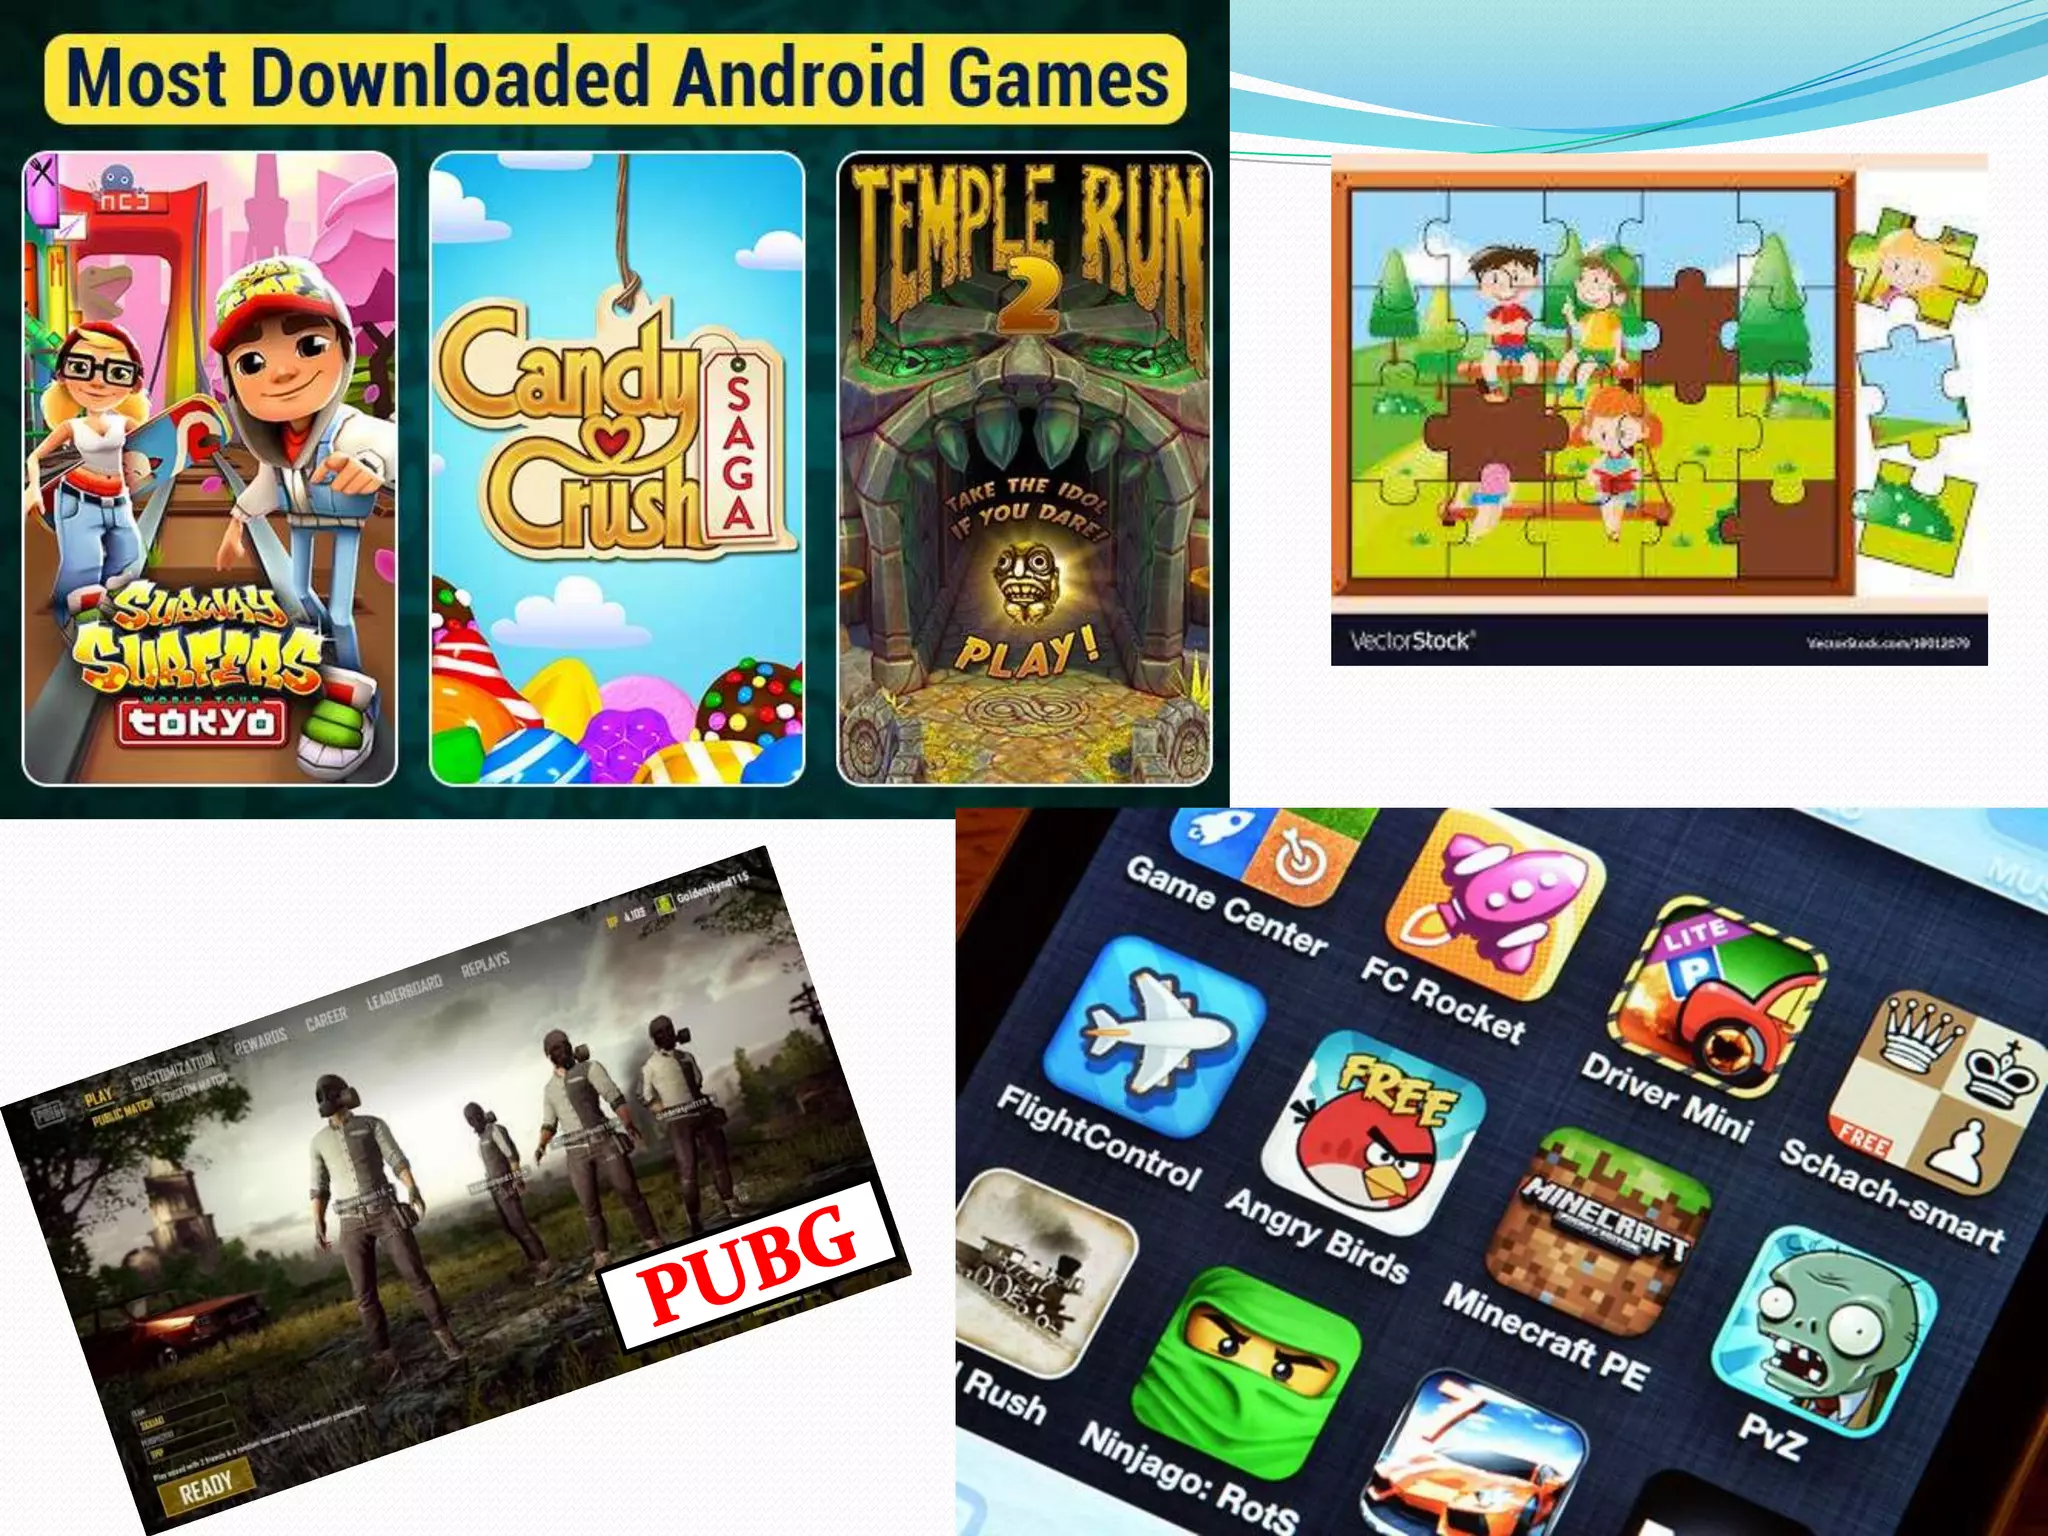
Digital Games:
Thefield of educational games and serious games has been growing
significantly over the last few years.
The digital games are being provided as tools for the classroom and have a
lot of positive feedback including higher motivation for students.
There are many other tools being utilized depending on the local school
board and funds available.
These may include: digital cameras, video cameras, interactive whiteboard
tools, document cameras, or LCD projectors.
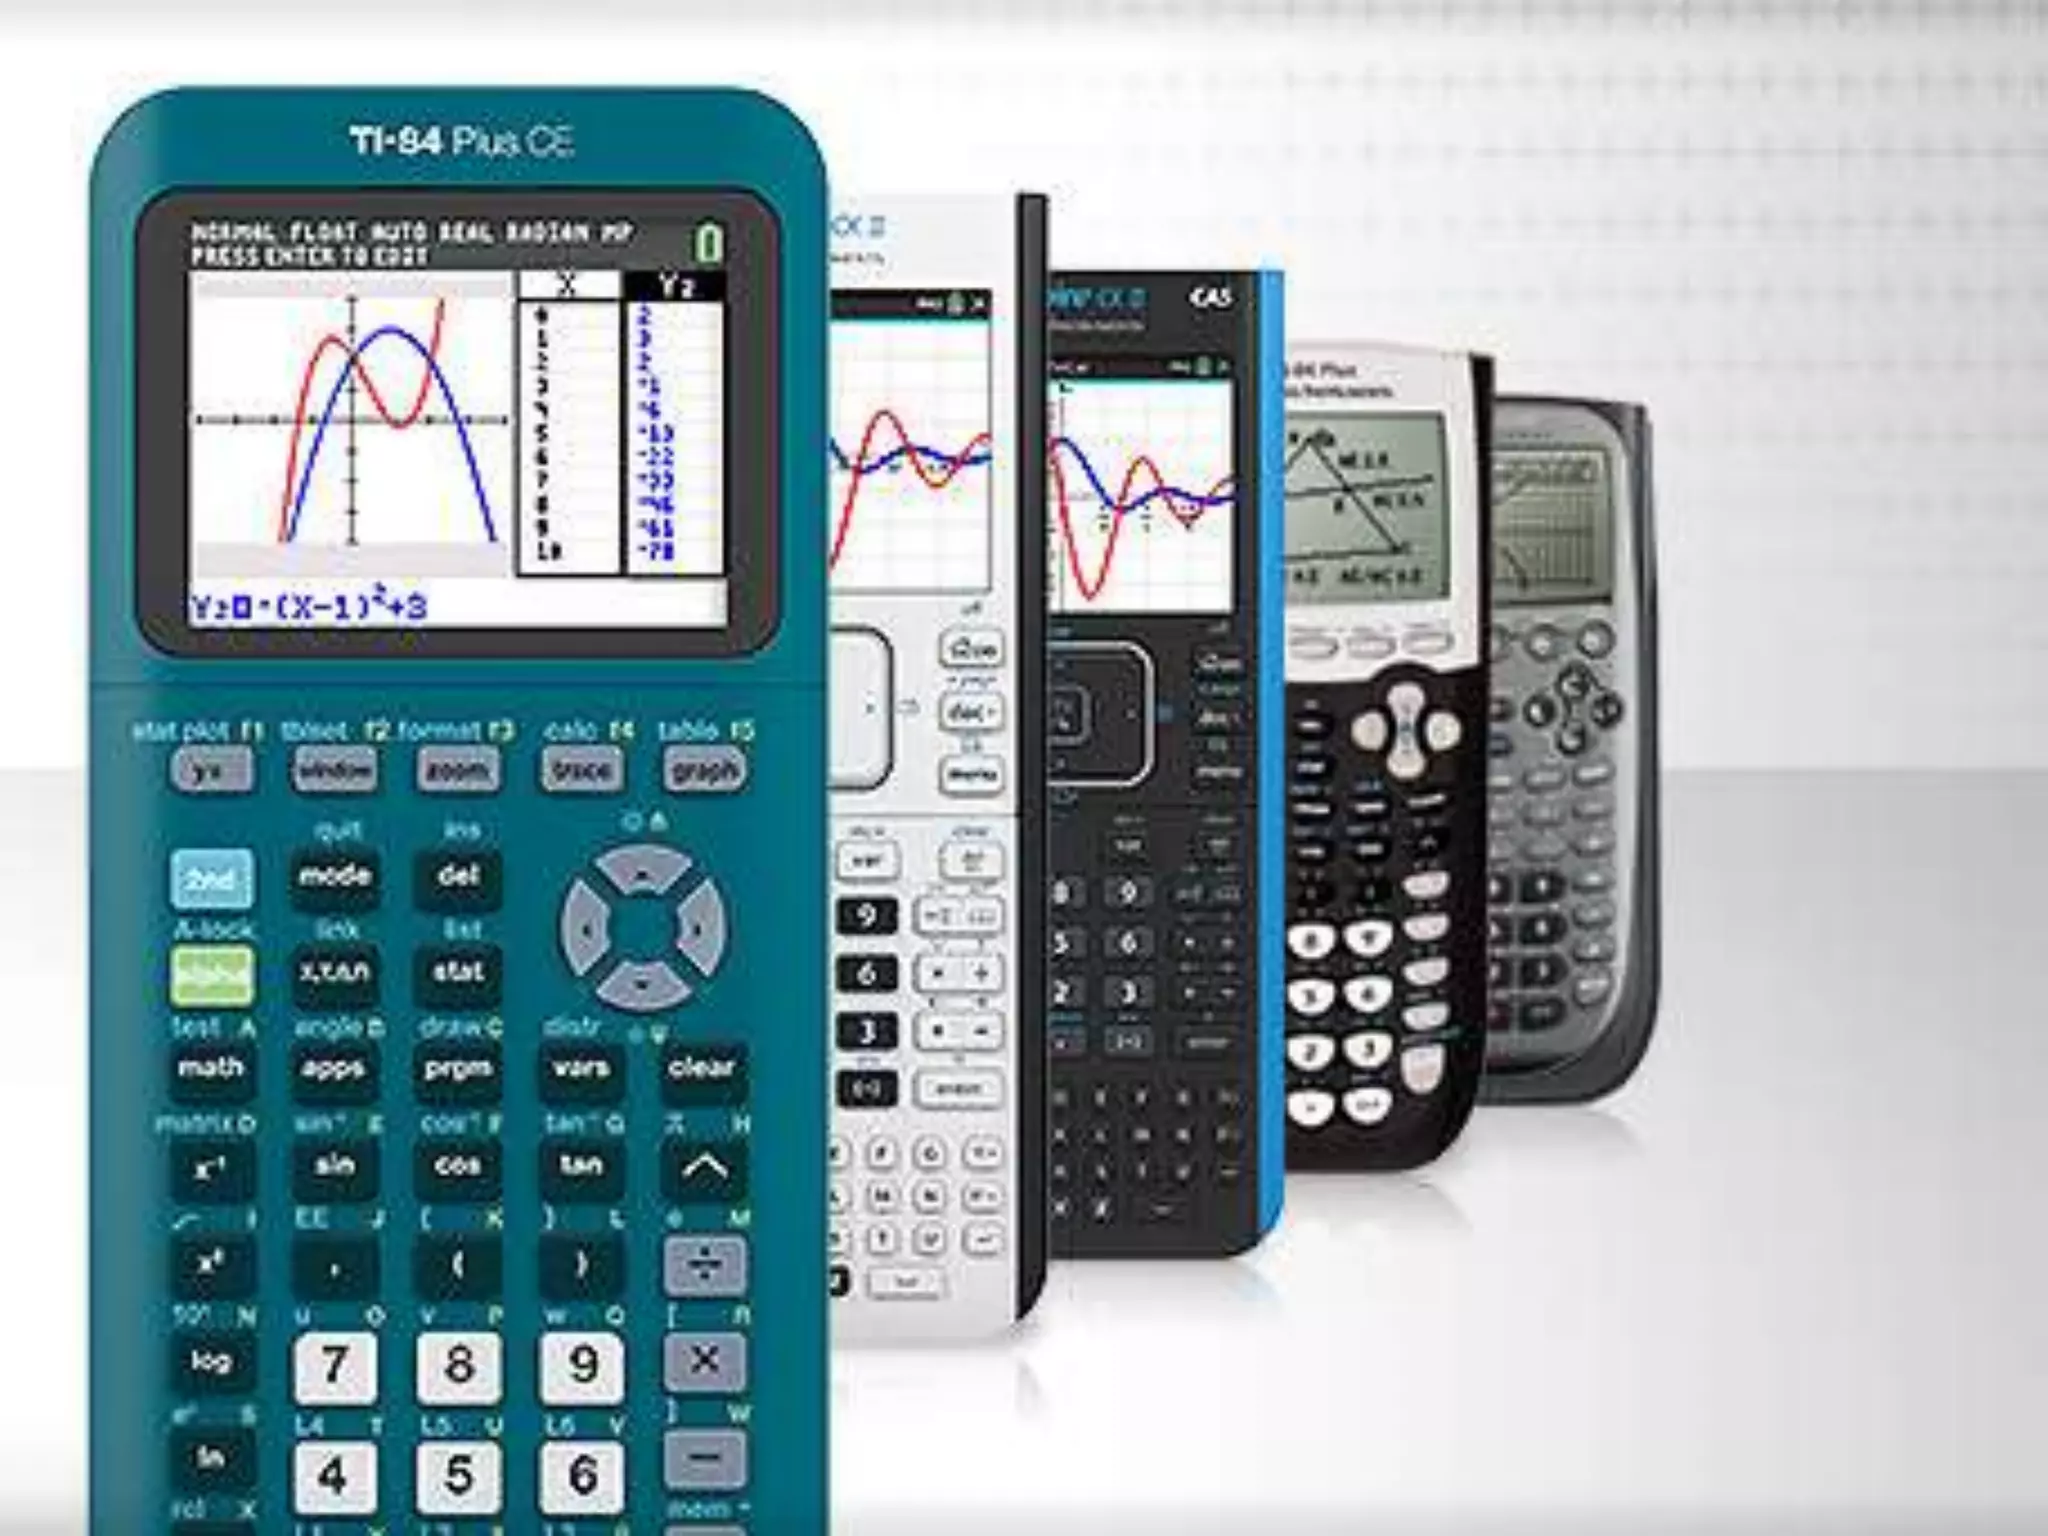
Functions of agraph calculator
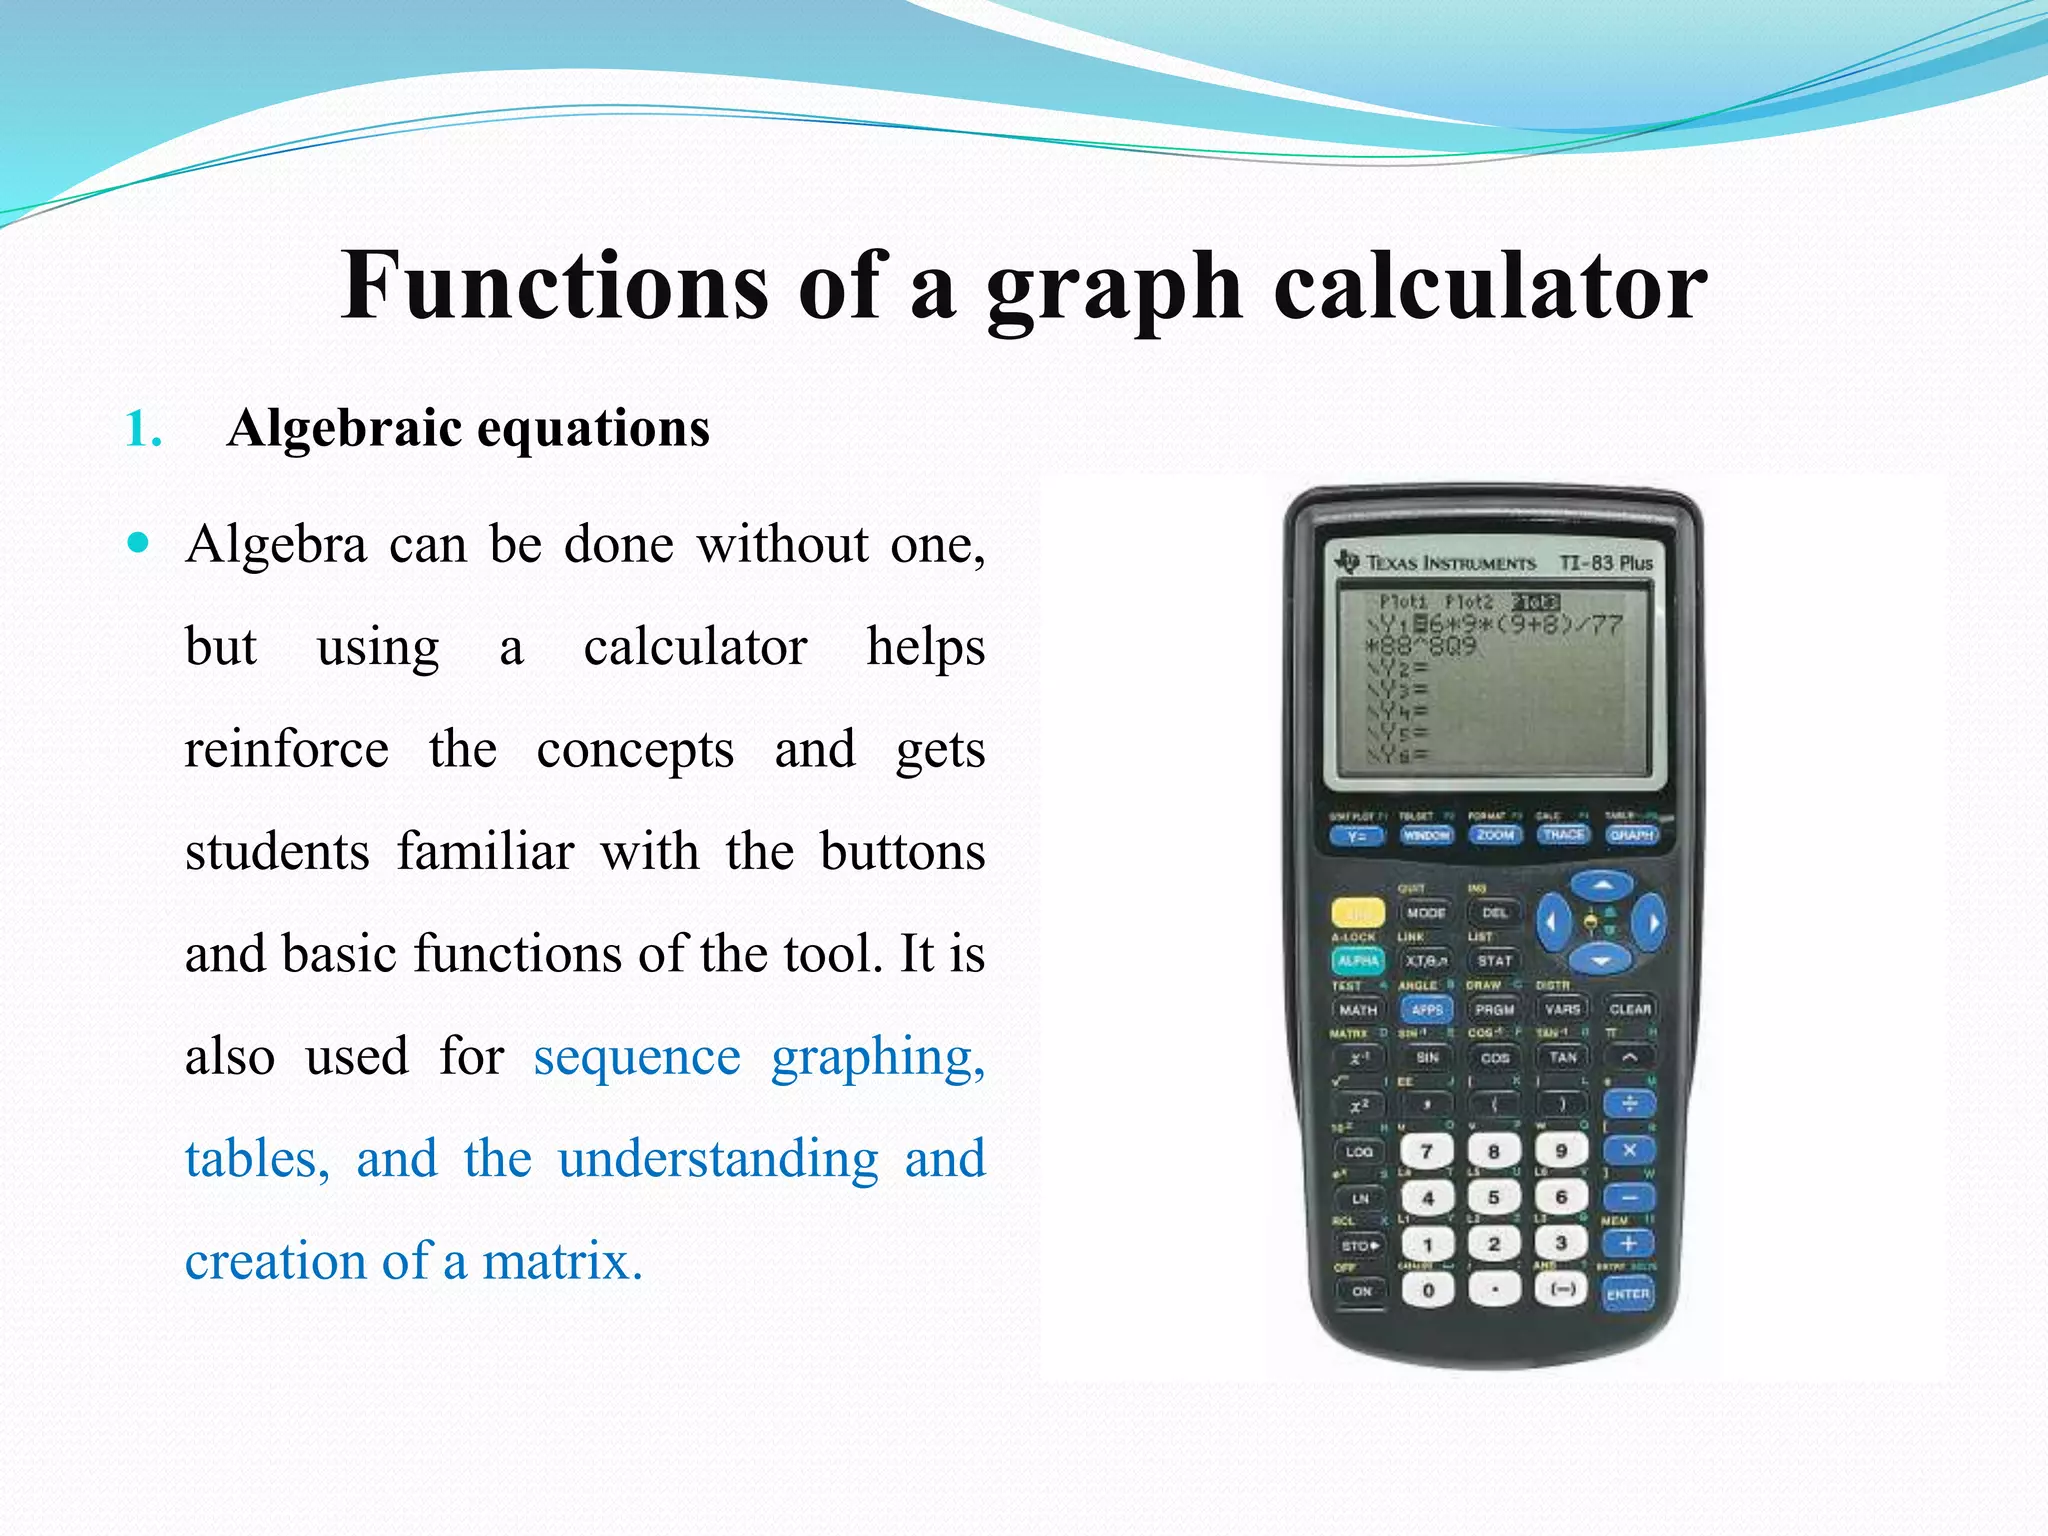
1. Algebraic equations
Algebra can be done without one,
but using a calculator helps
reinforce the concepts and gets
students familiar with the buttons
and basic functions of the tool. It is
also used for sequence graphing,
tables, and the understanding and
creation of a matrix.
21.
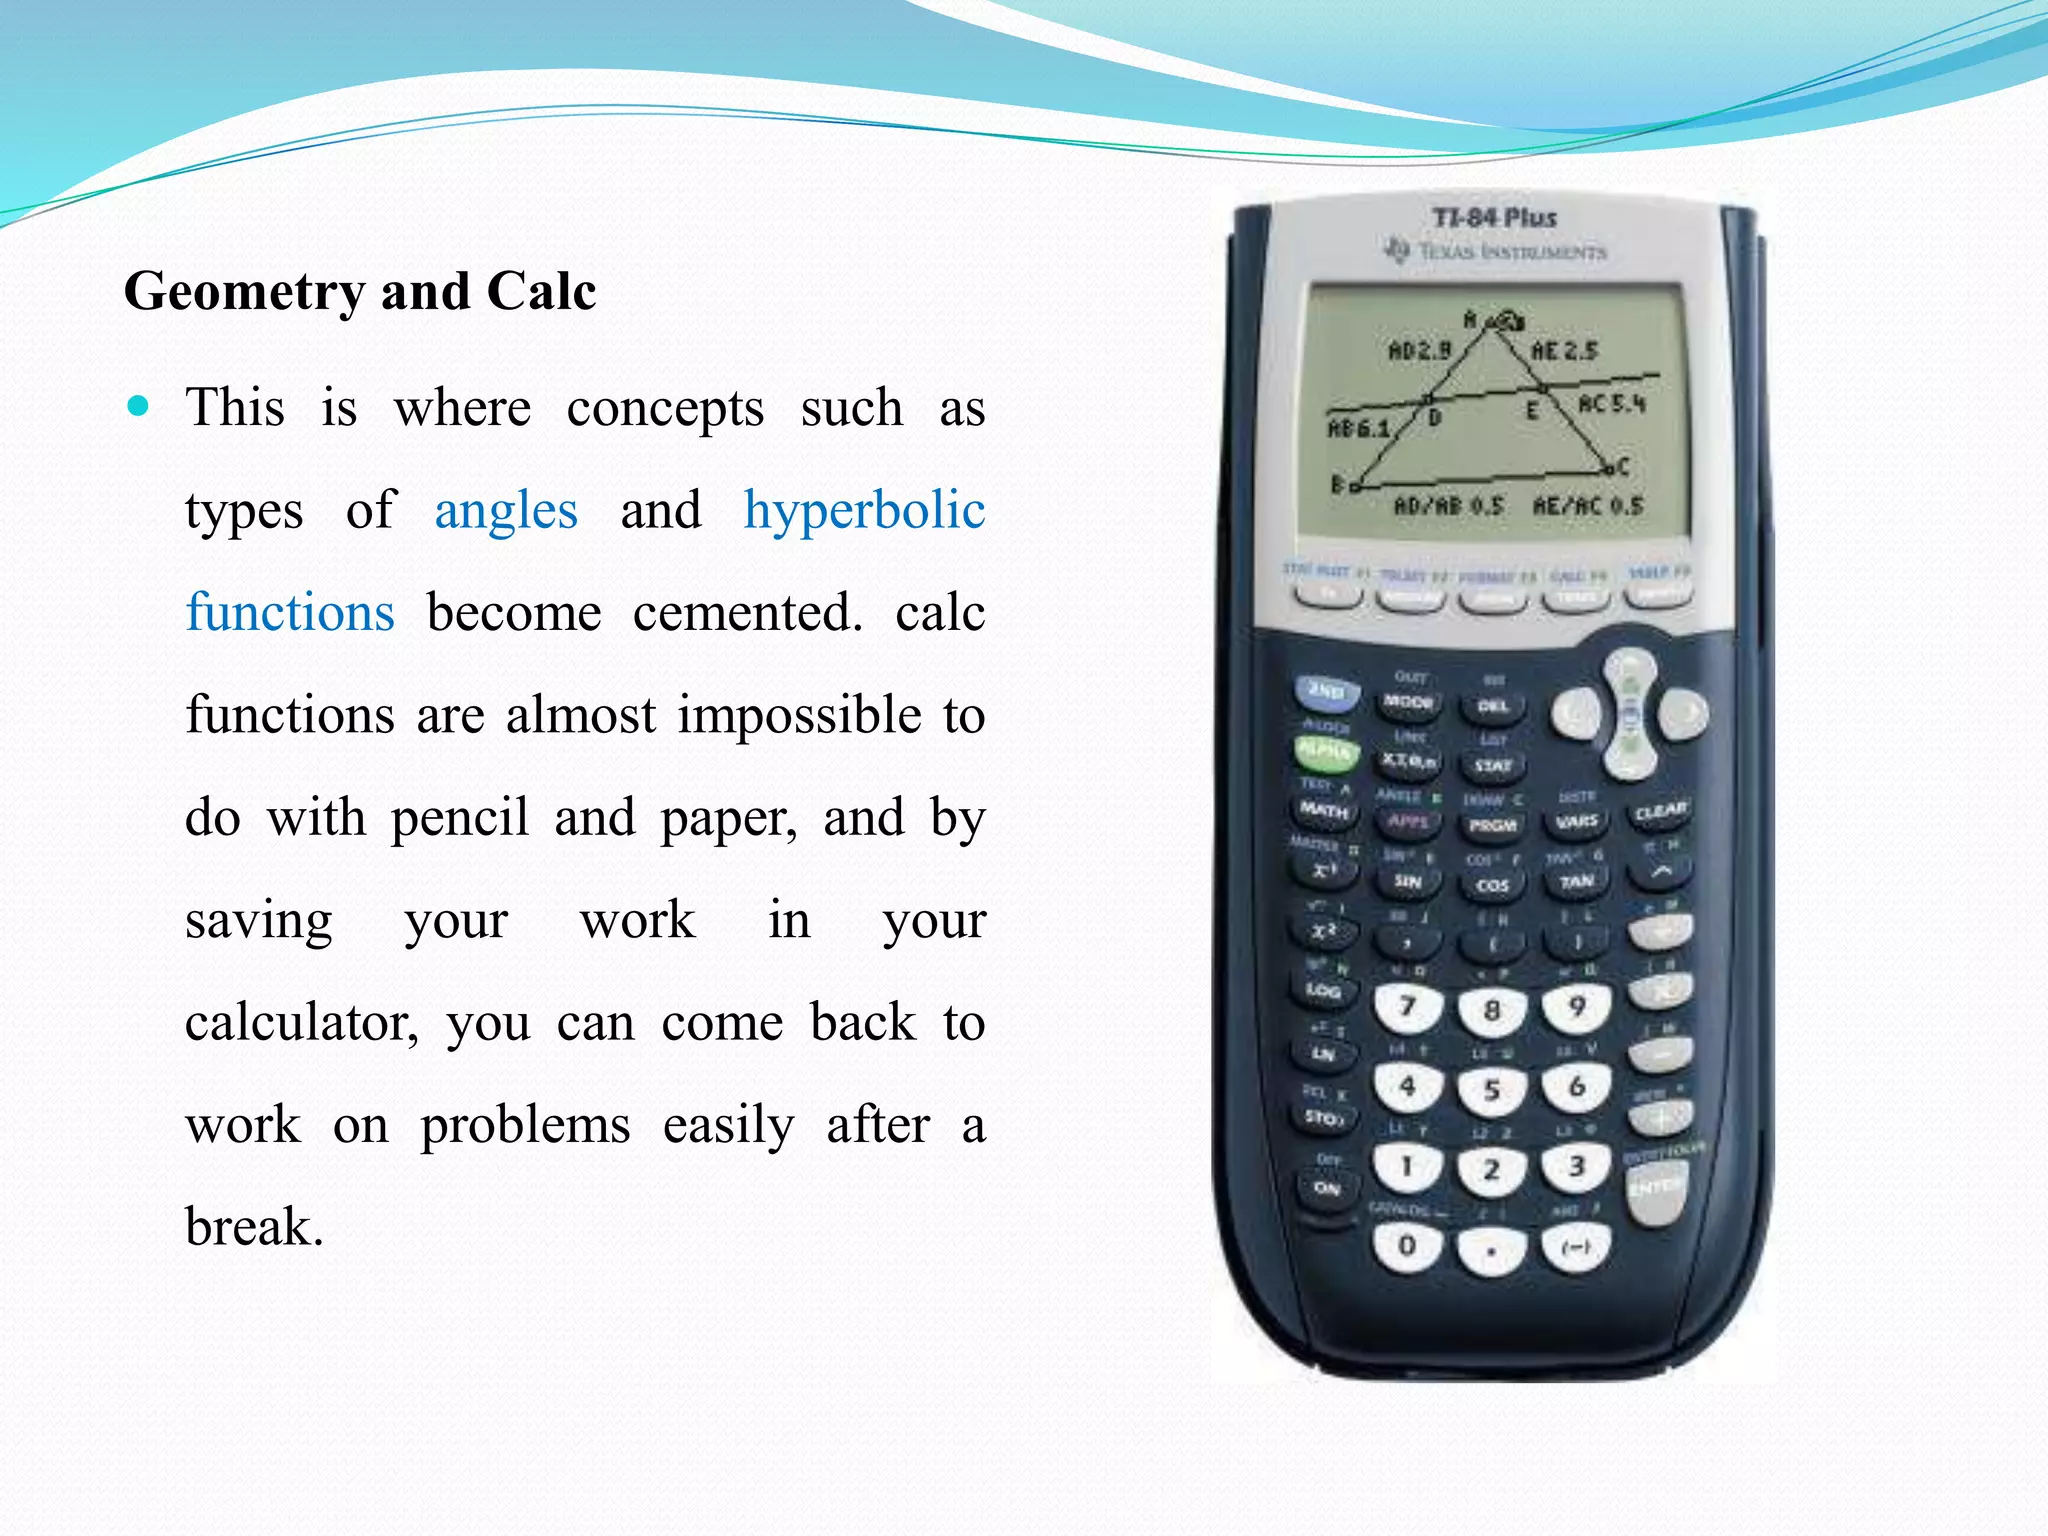
Geometry and Calc
This is where concepts such as
types of angles and hyperbolic
functions become cemented. calc
functions are almost impossible to
do with pencil and paper, and by
saving your work in your
calculator, you can come back to
work on problems easily after a
break.
22.
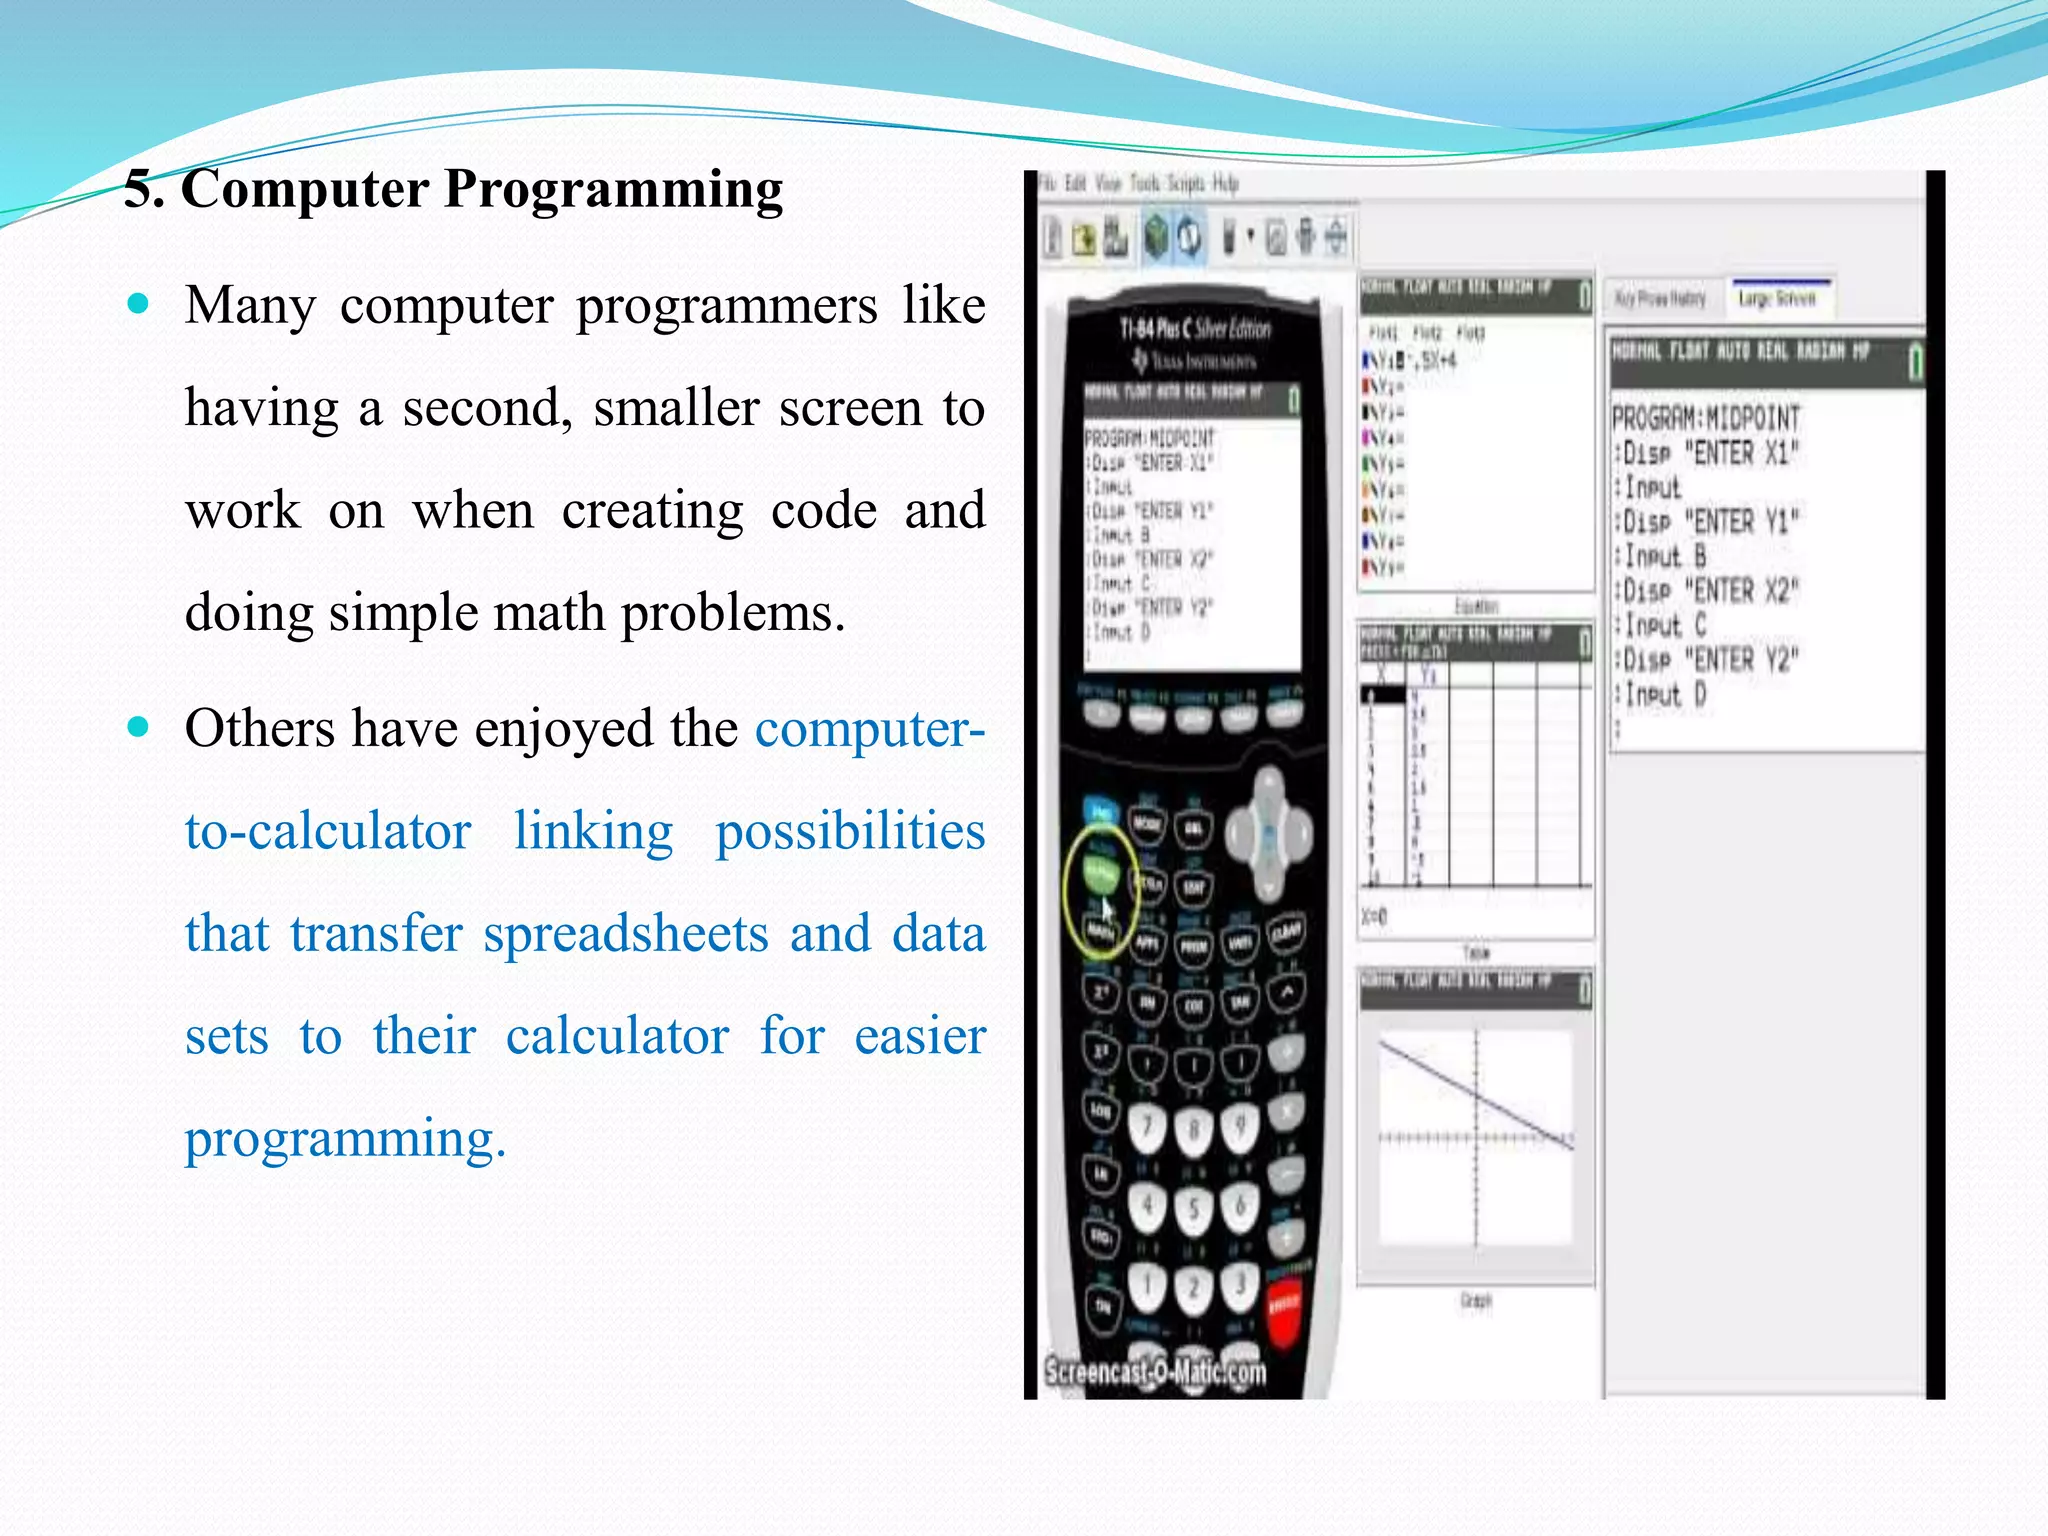
5. Computer Programming
Many computer programmers like
having a second, smaller screen to
work on when creating code and
doing simple math problems.
Others have enjoyed the computer-
to-calculator linking possibilities
that transfer spreadsheets and data
sets to their calculator for easier
programming.
23.
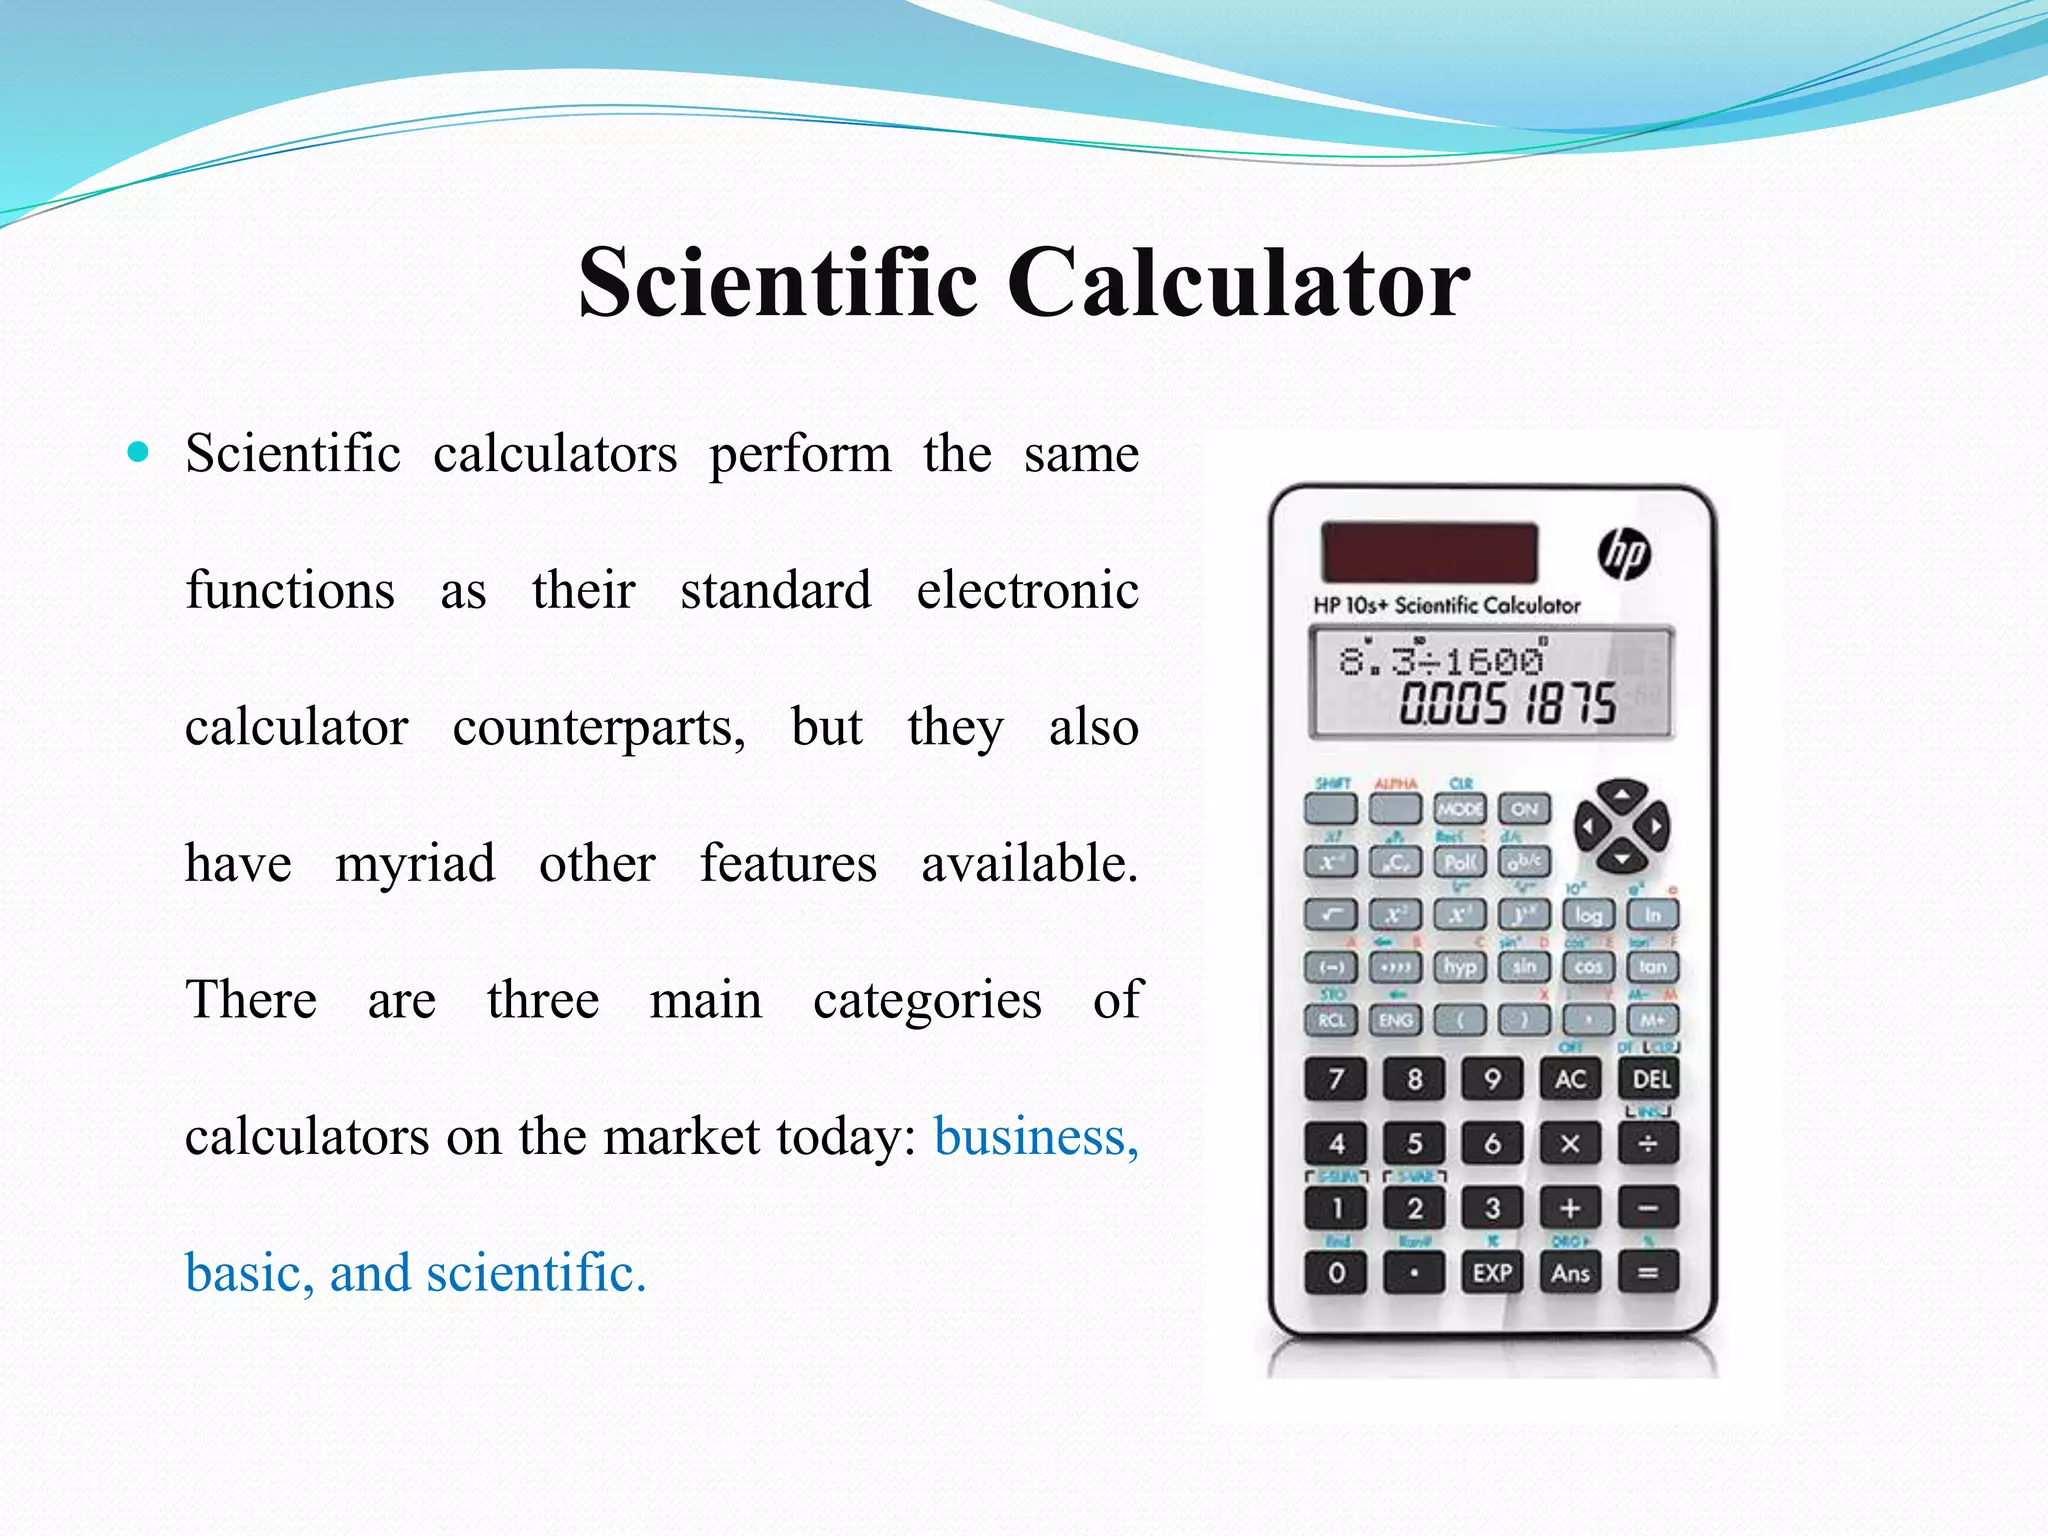
Scientific Calculator
Scientificcalculators perform the same
functions as their standard electronic
calculator counterparts, but they also
have myriad other features available.
There are three main categories of
calculators on the market today: business,
basic, and scientific.
24.
Uses of ScientificCalculator
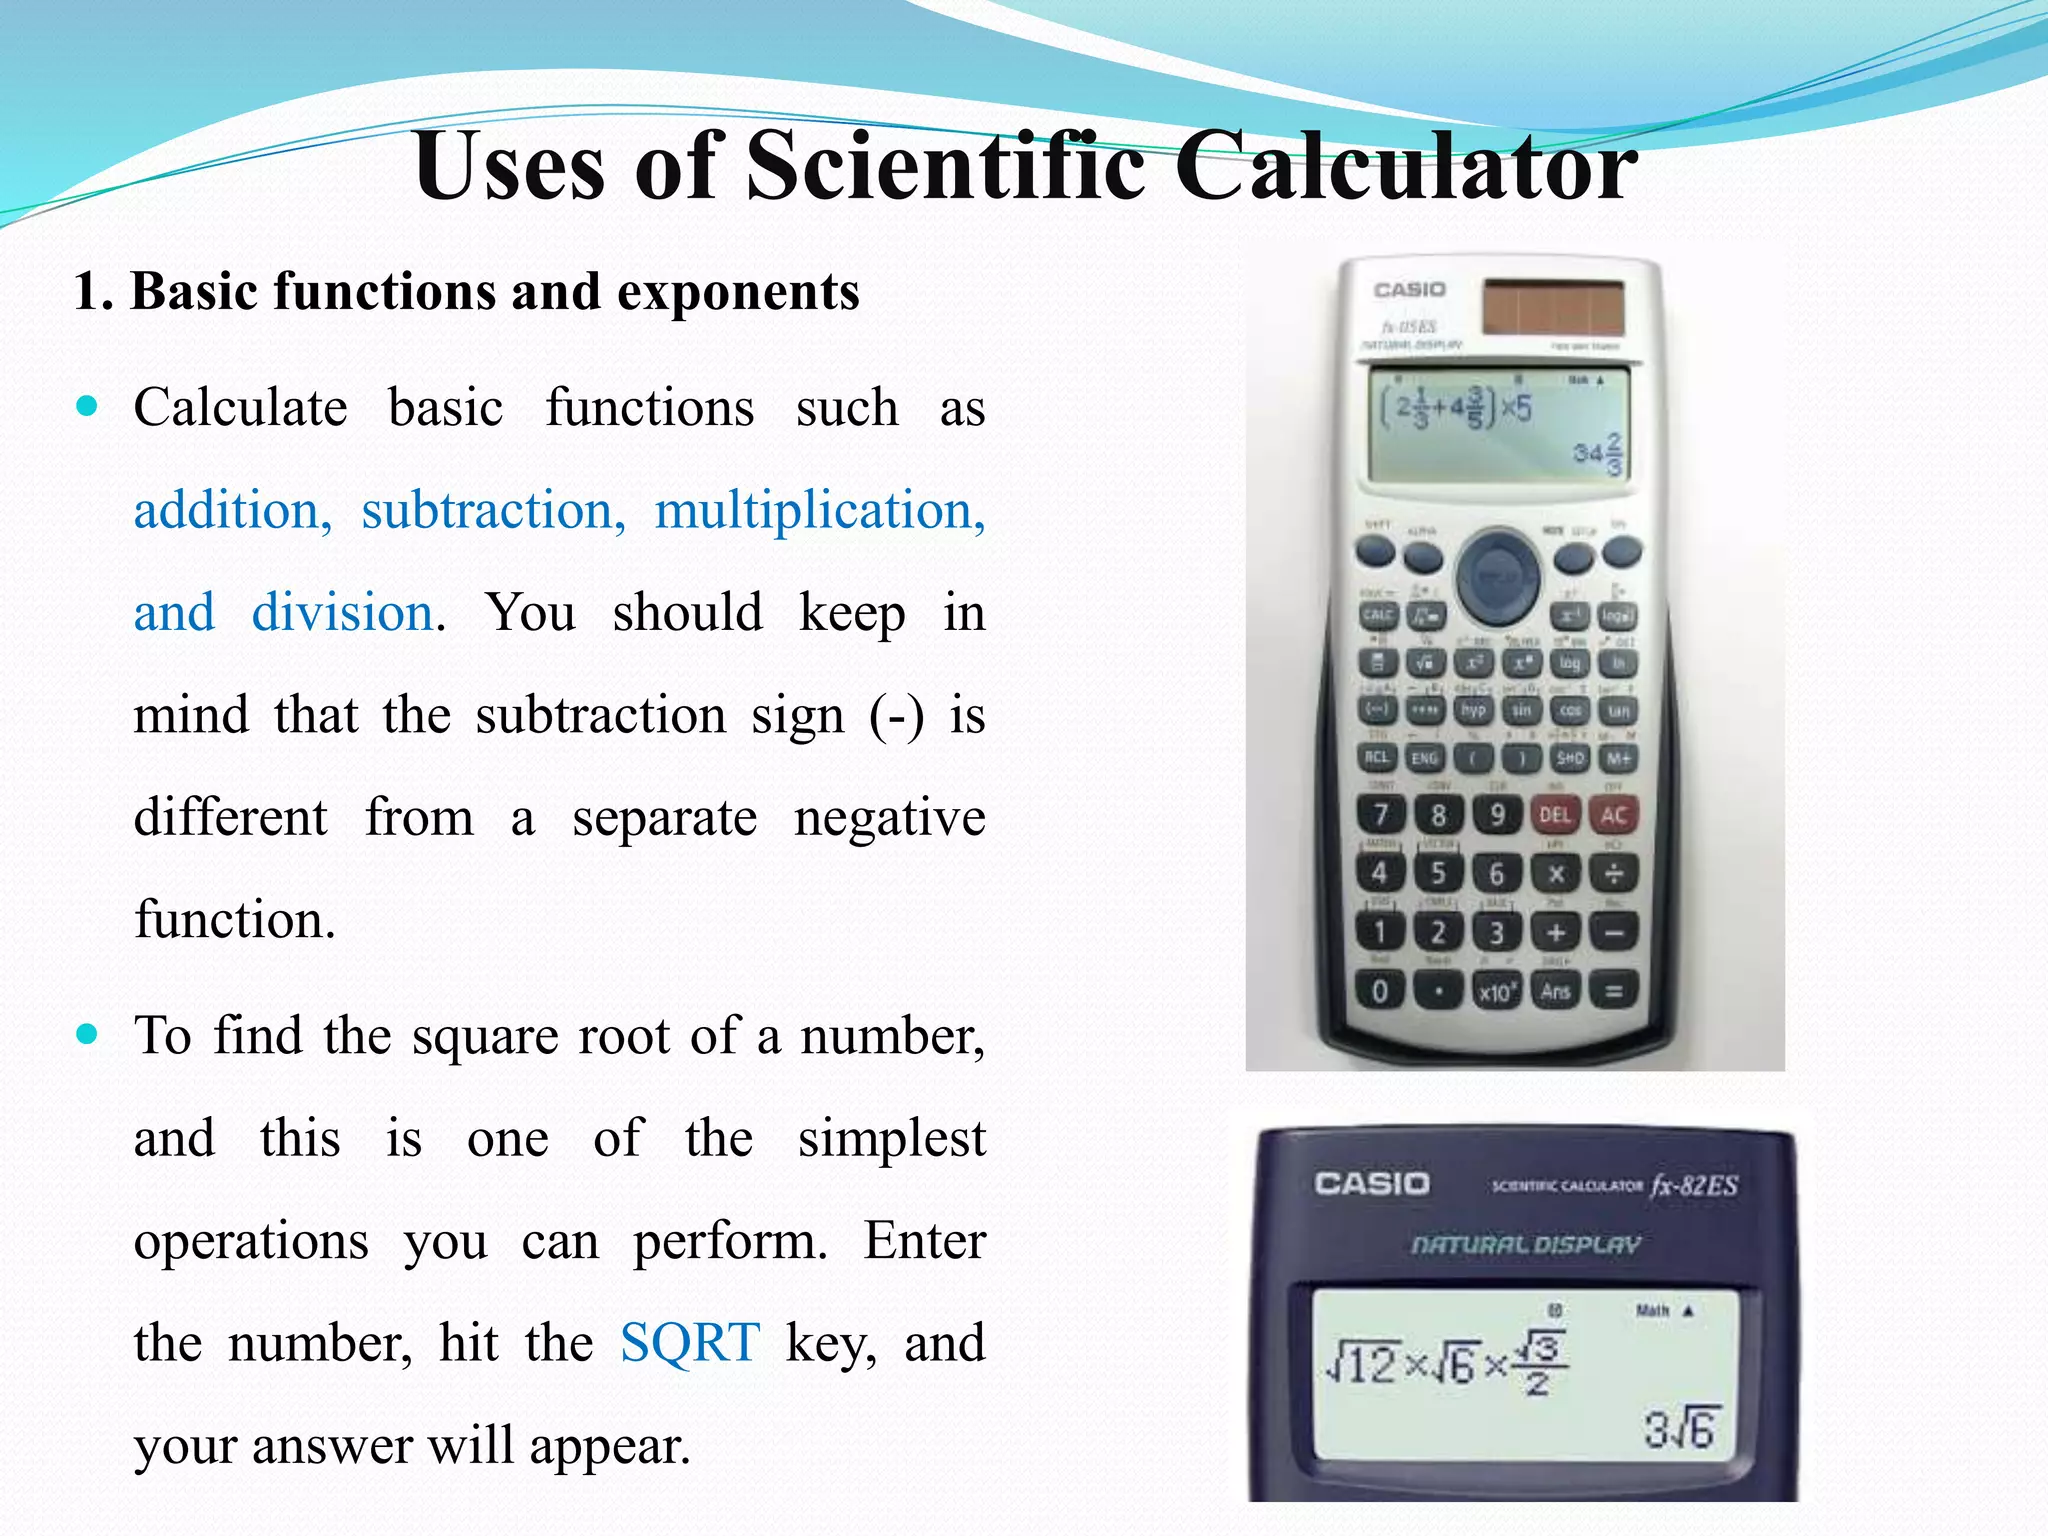
1. Basic functions and exponents
Calculate basic functions such as
addition, subtraction, multiplication,
and division. You should keep in
mind that the subtraction sign (-) is
different from a separate negative
function.
To find the square root of a number,
and this is one of the simplest
operations you can perform. Enter
the number, hit the SQRT key, and
your answer will appear.
25.
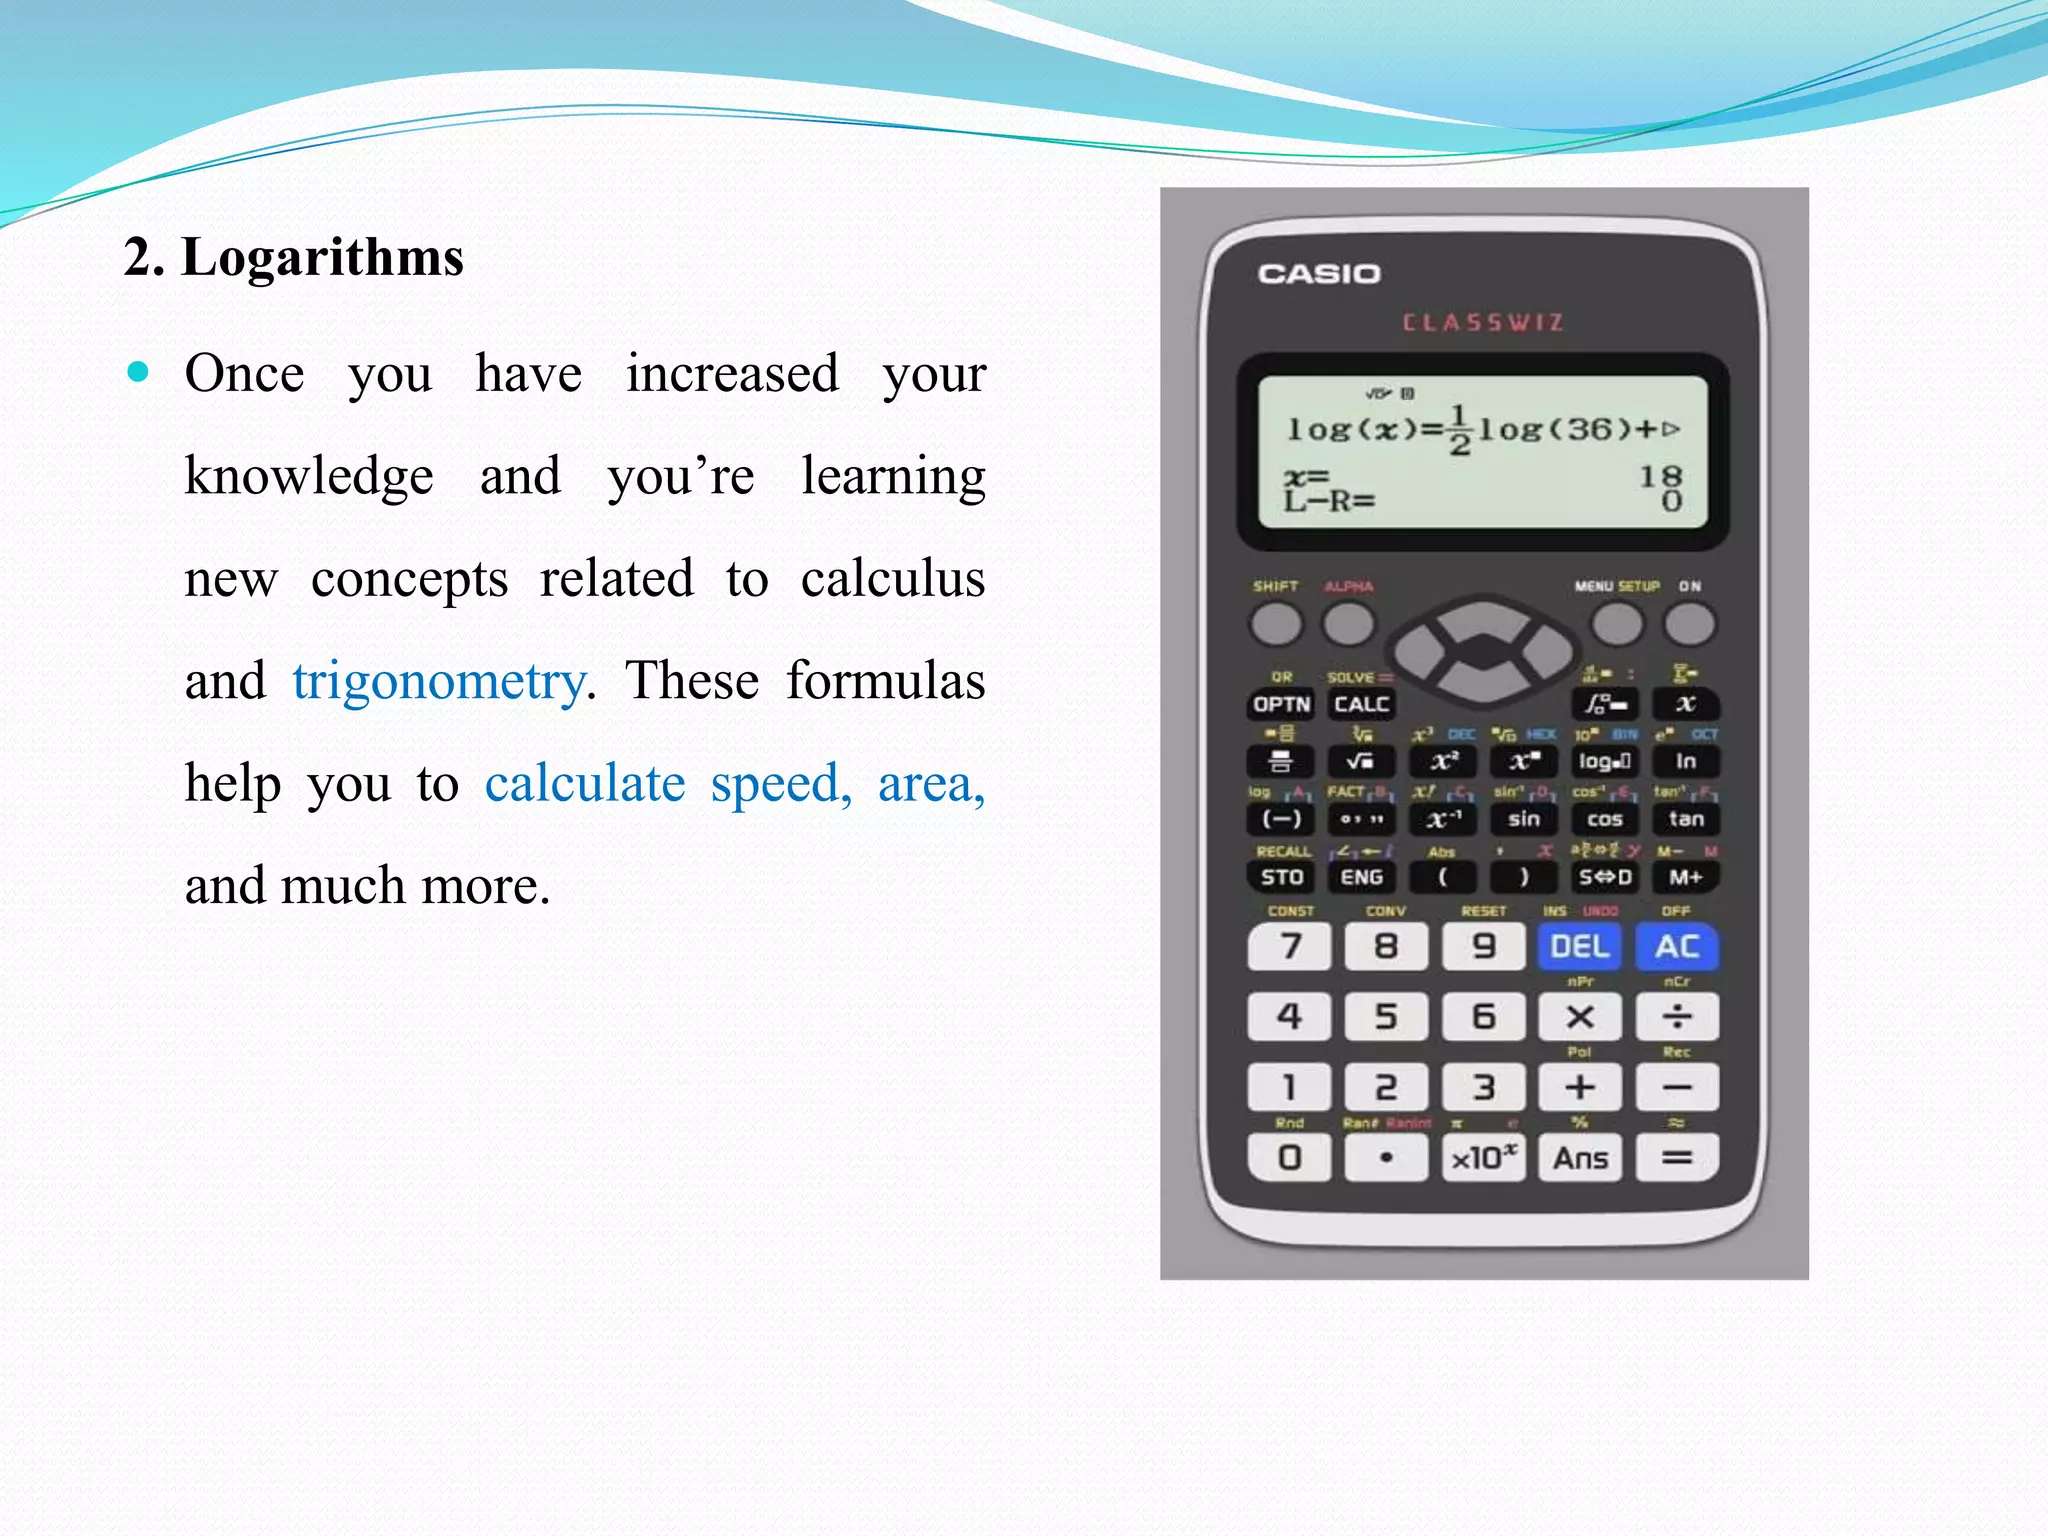
2. Logarithms
Onceyou have increased your
knowledge and you’re learning
new concepts related to calculus
and trigonometry. These formulas
help you to calculate speed, area,
and much more.
26.
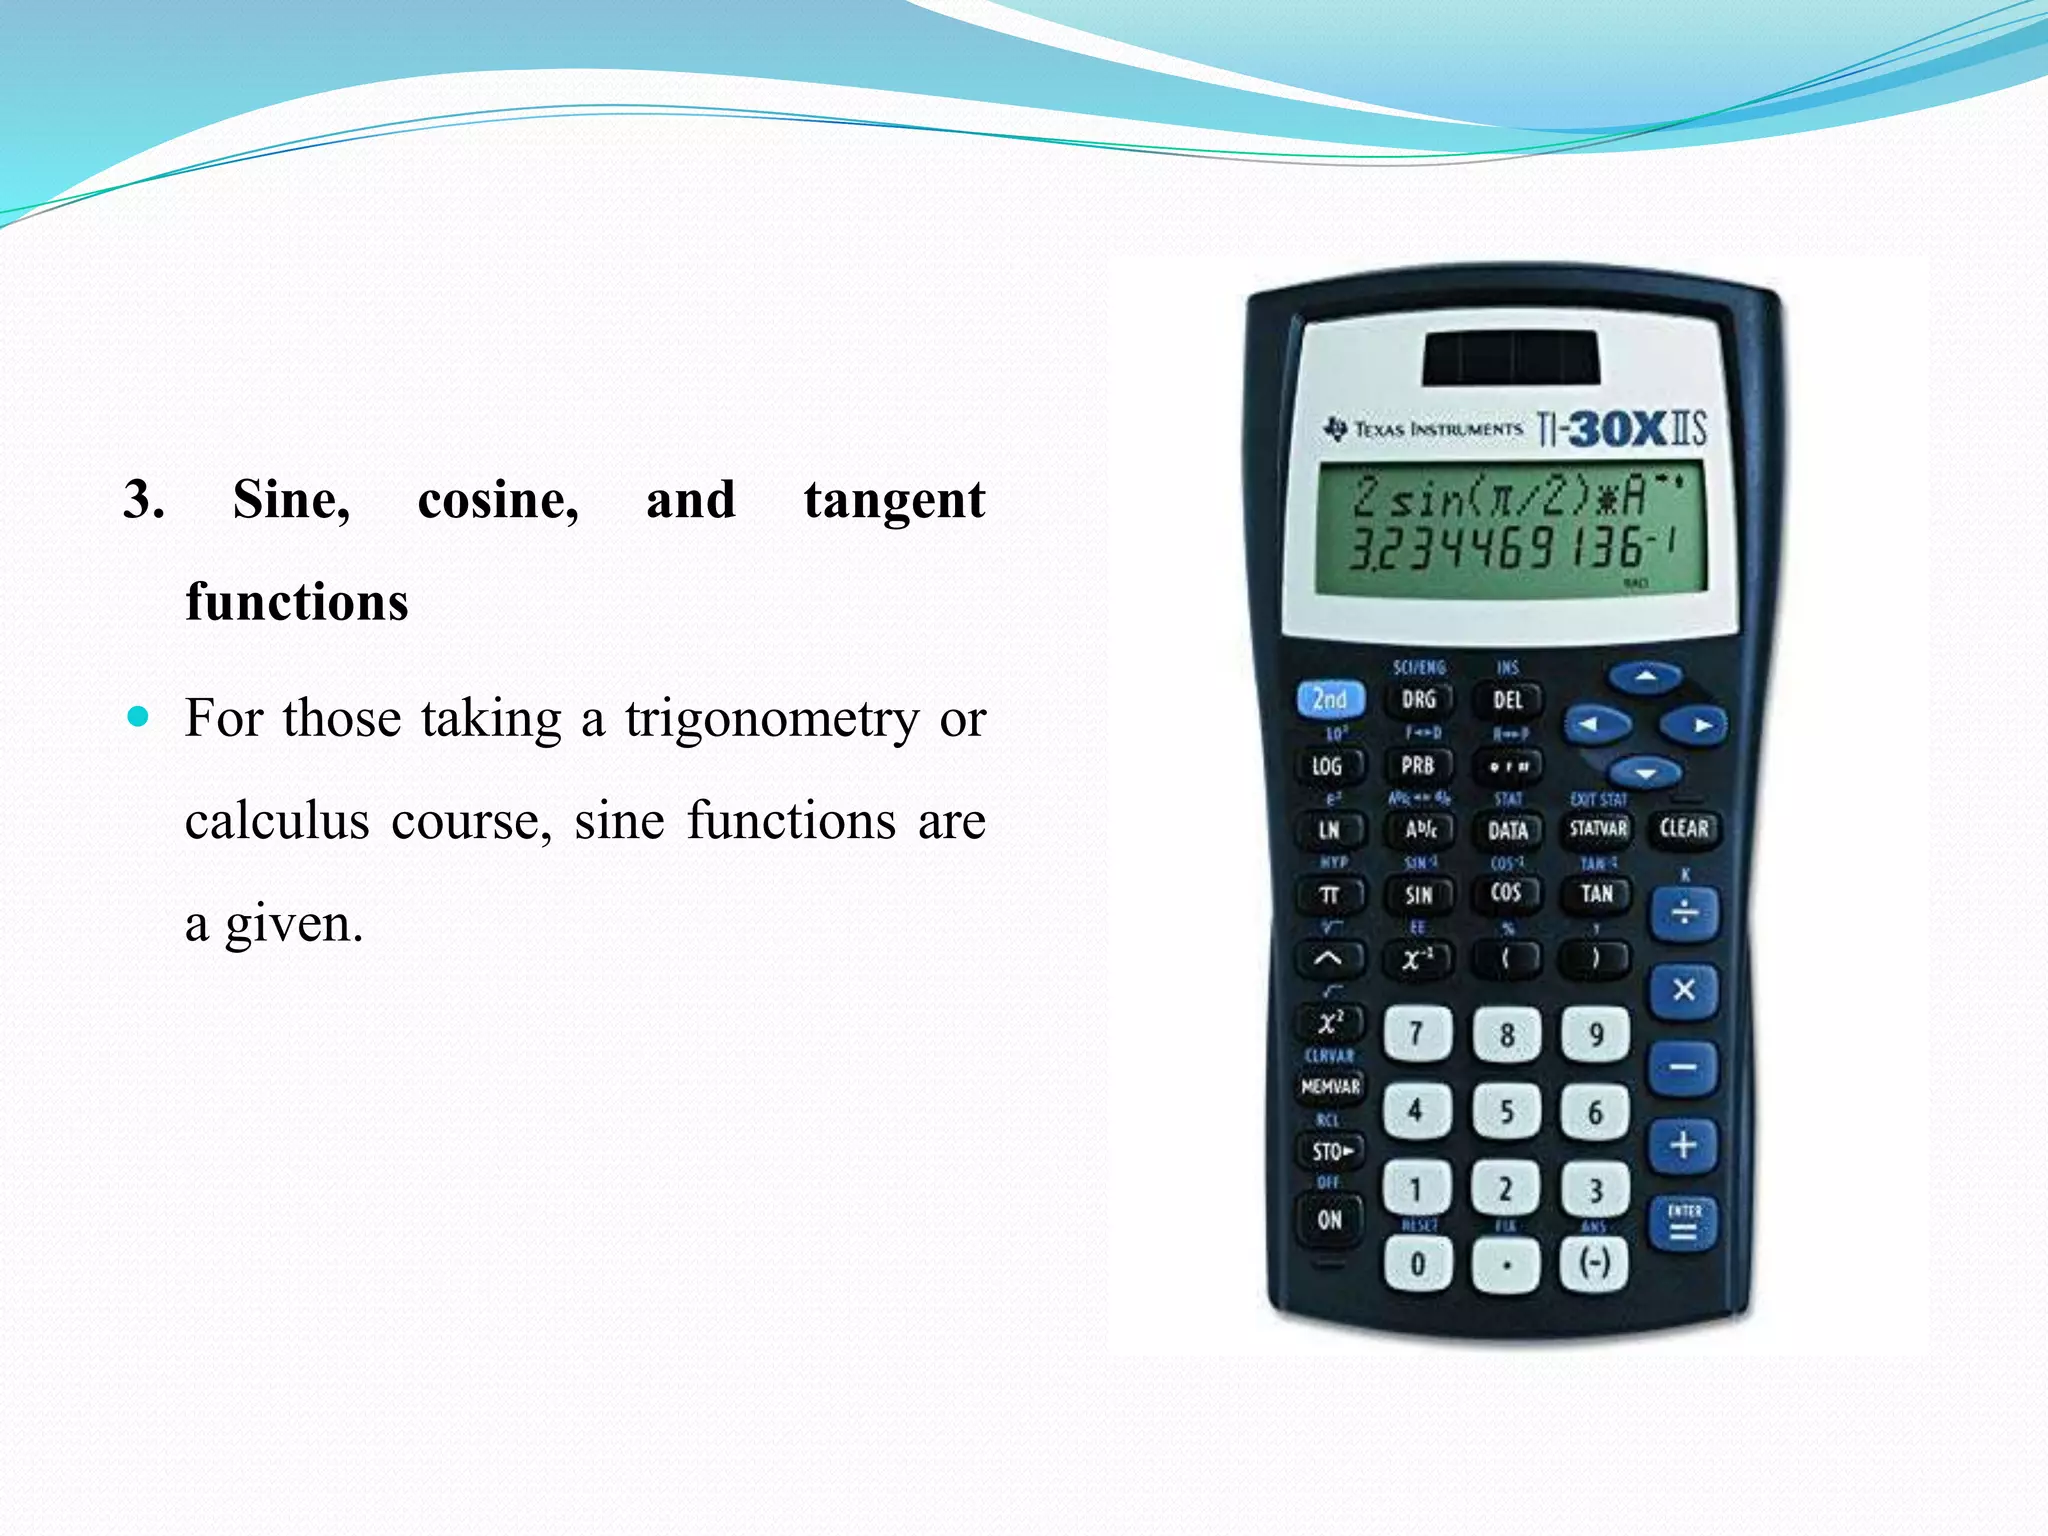
3. Sine, cosine,and tangent
functions
For those taking a trigonometry or
calculus course, sine functions are
a given.
27.
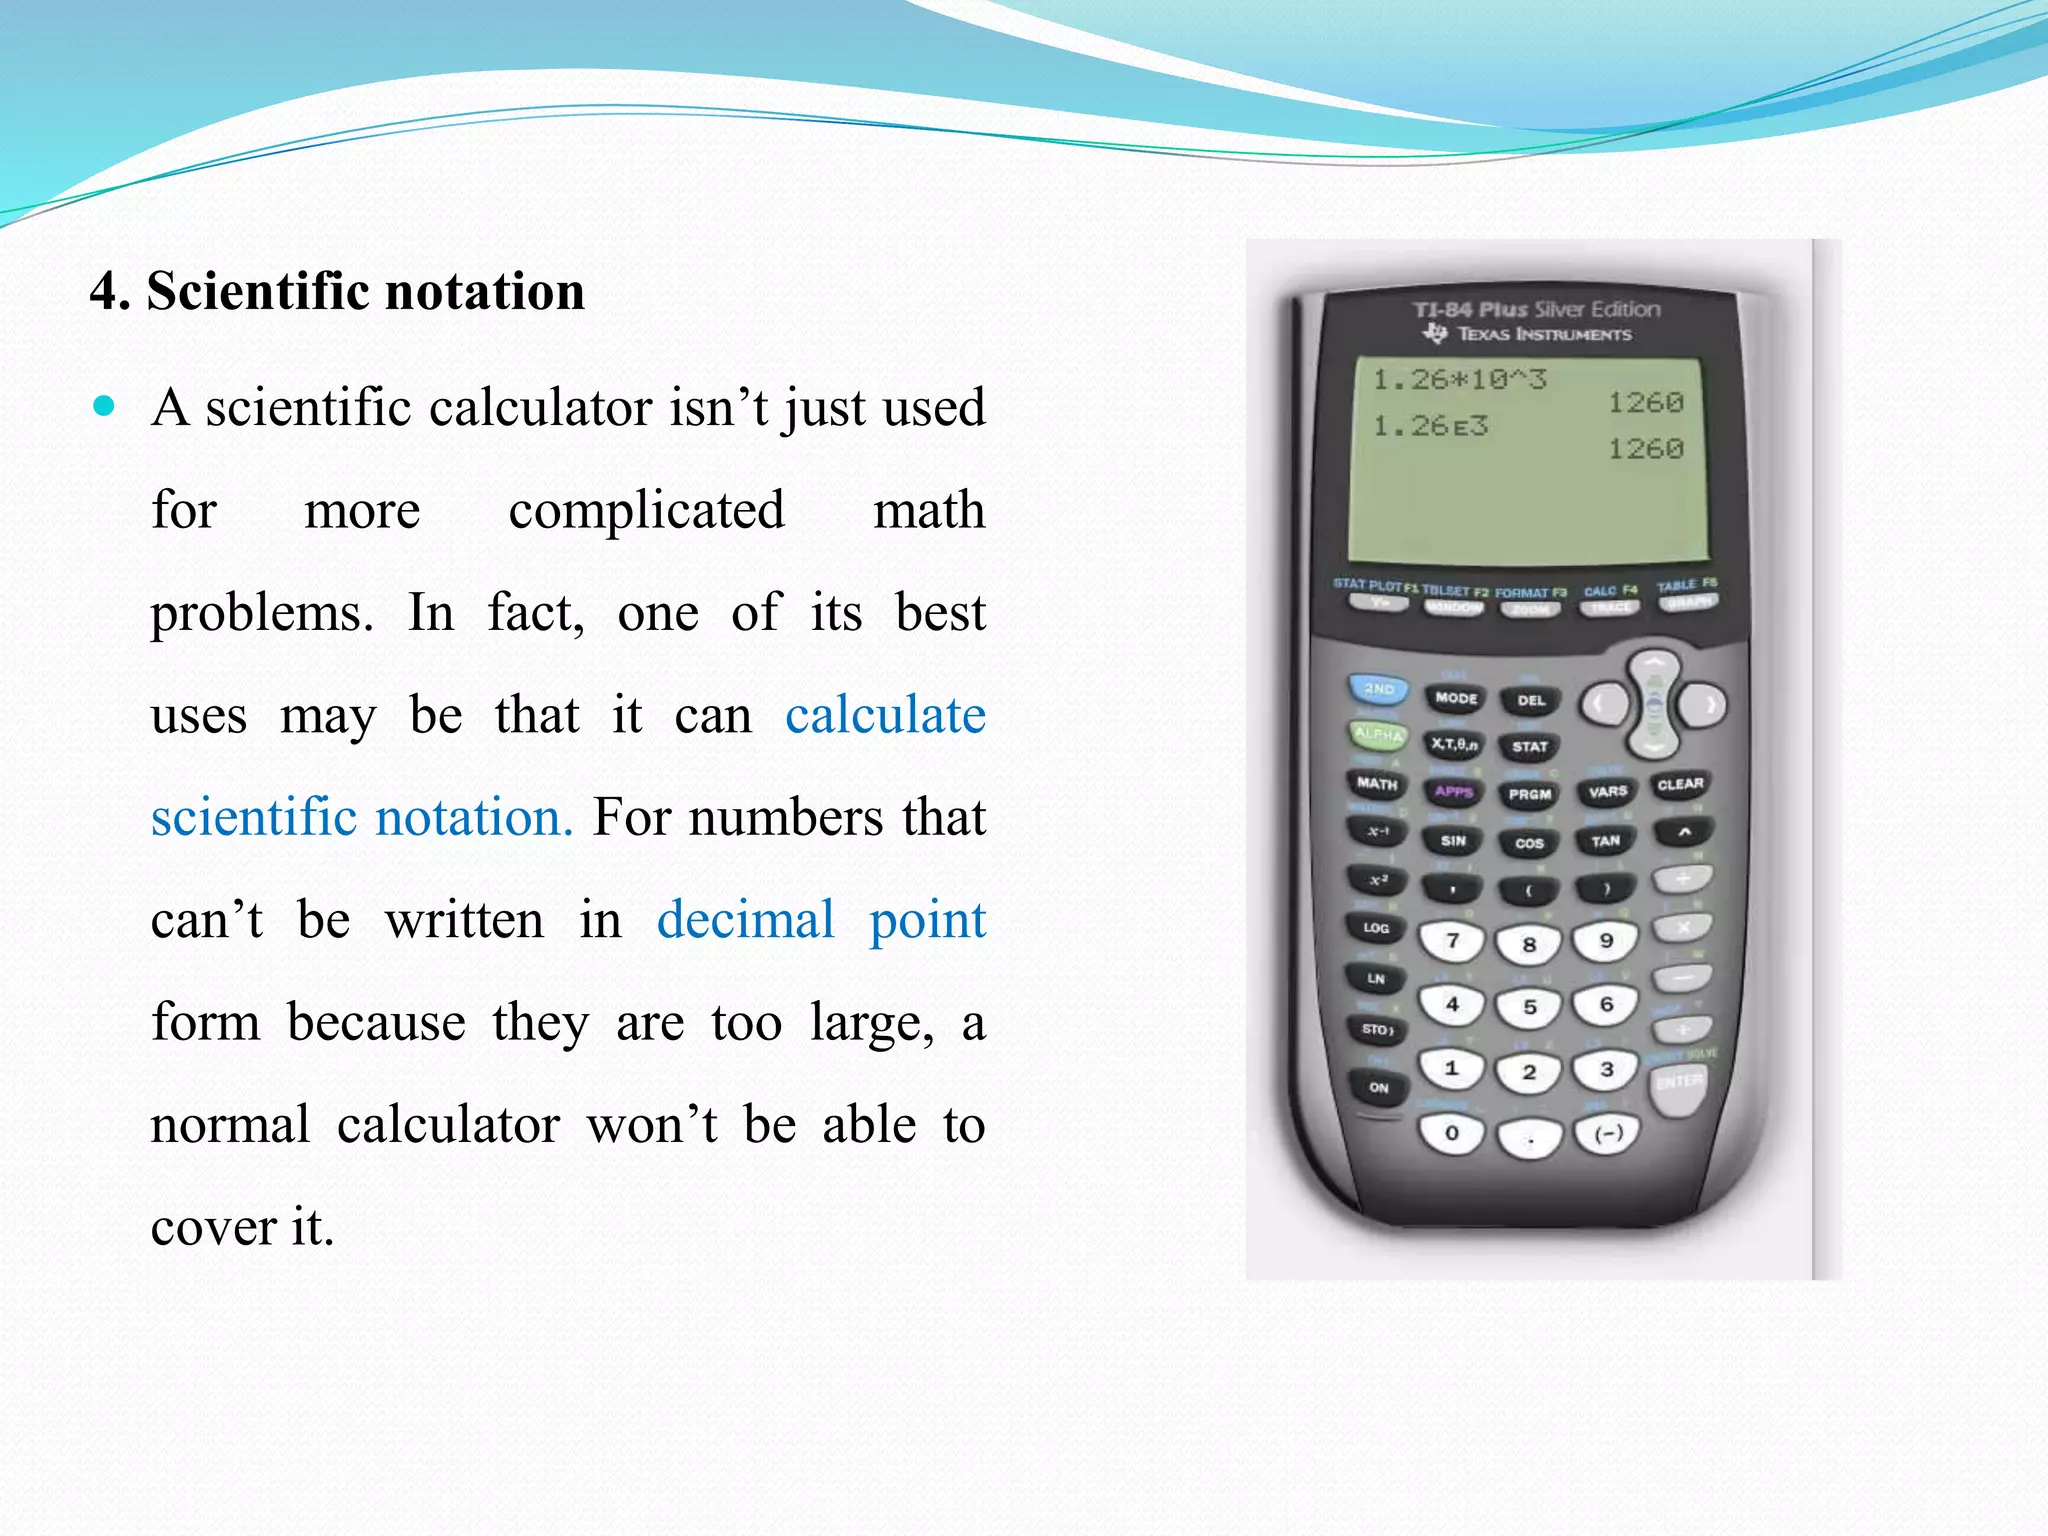
4. Scientific notation
A scientific calculator isn’t just used
for more complicated math
problems. In fact, one of its best
uses may be that it can calculate
scientific notation. For numbers that
can’t be written in decimal point
form because they are too large, a
normal calculator won’t be able to
cover it.
28.
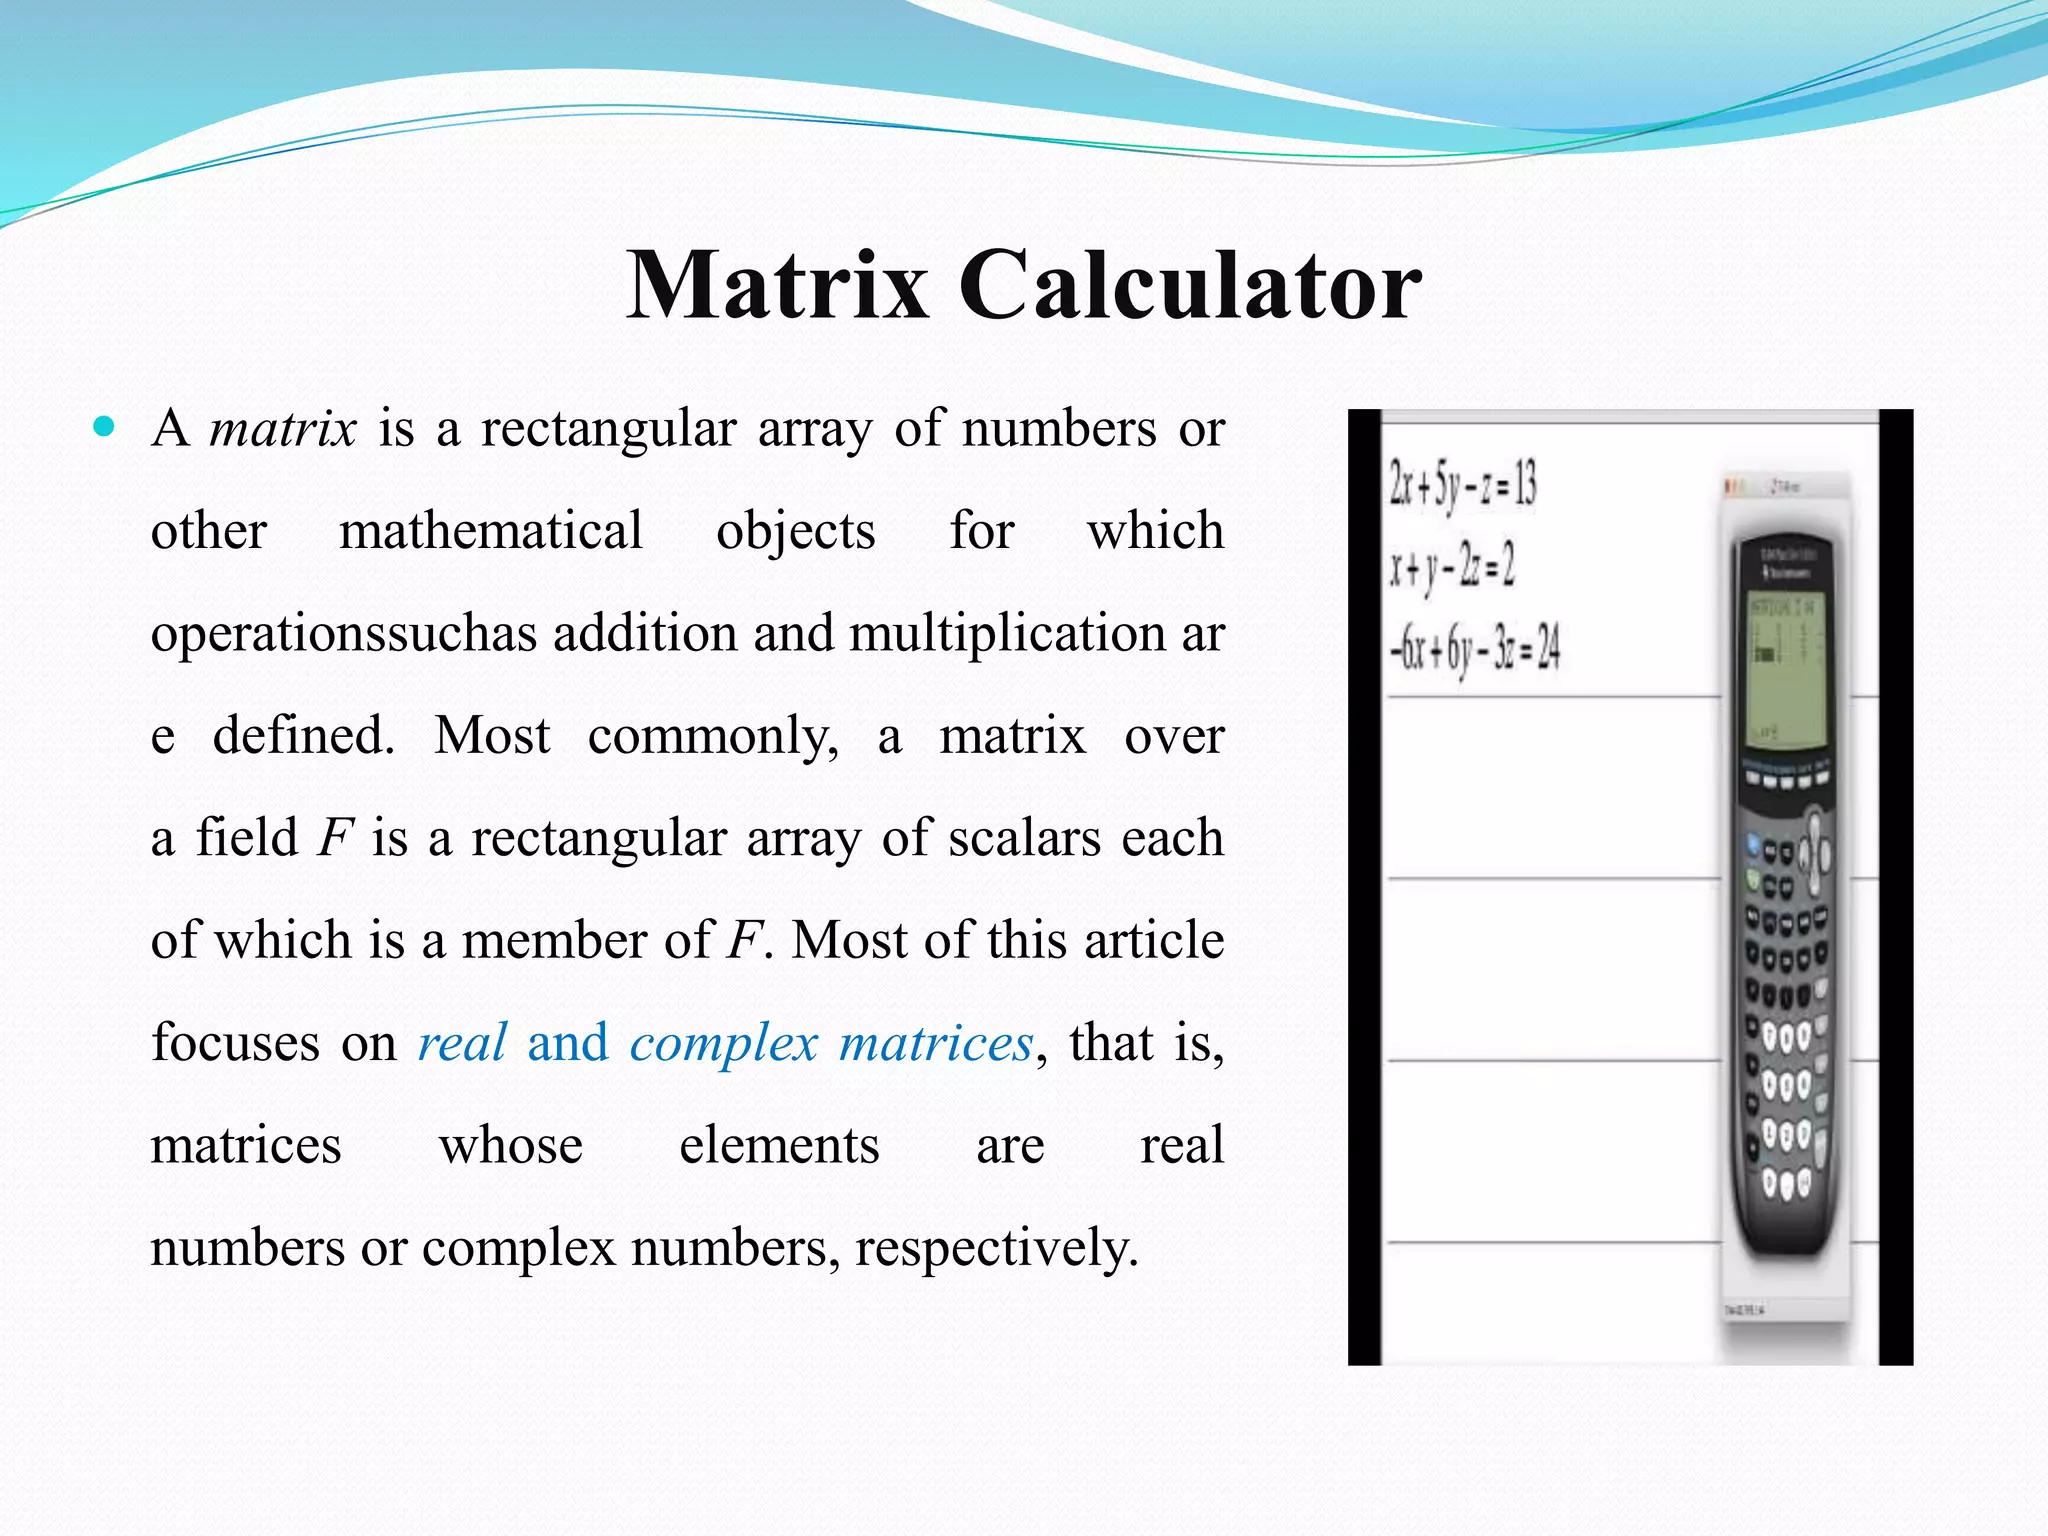
Matrix Calculator
Amatrix is a rectangular array of numbers or
other mathematical objects for which
operationssuchas addition and multiplication ar
e defined. Most commonly, a matrix over
a field F is a rectangular array of scalars each
of which is a member of F. Most of this article
focuses on real and complex matrices, that is,
matrices whose elements are real
numbers or complex numbers, respectively.
29.
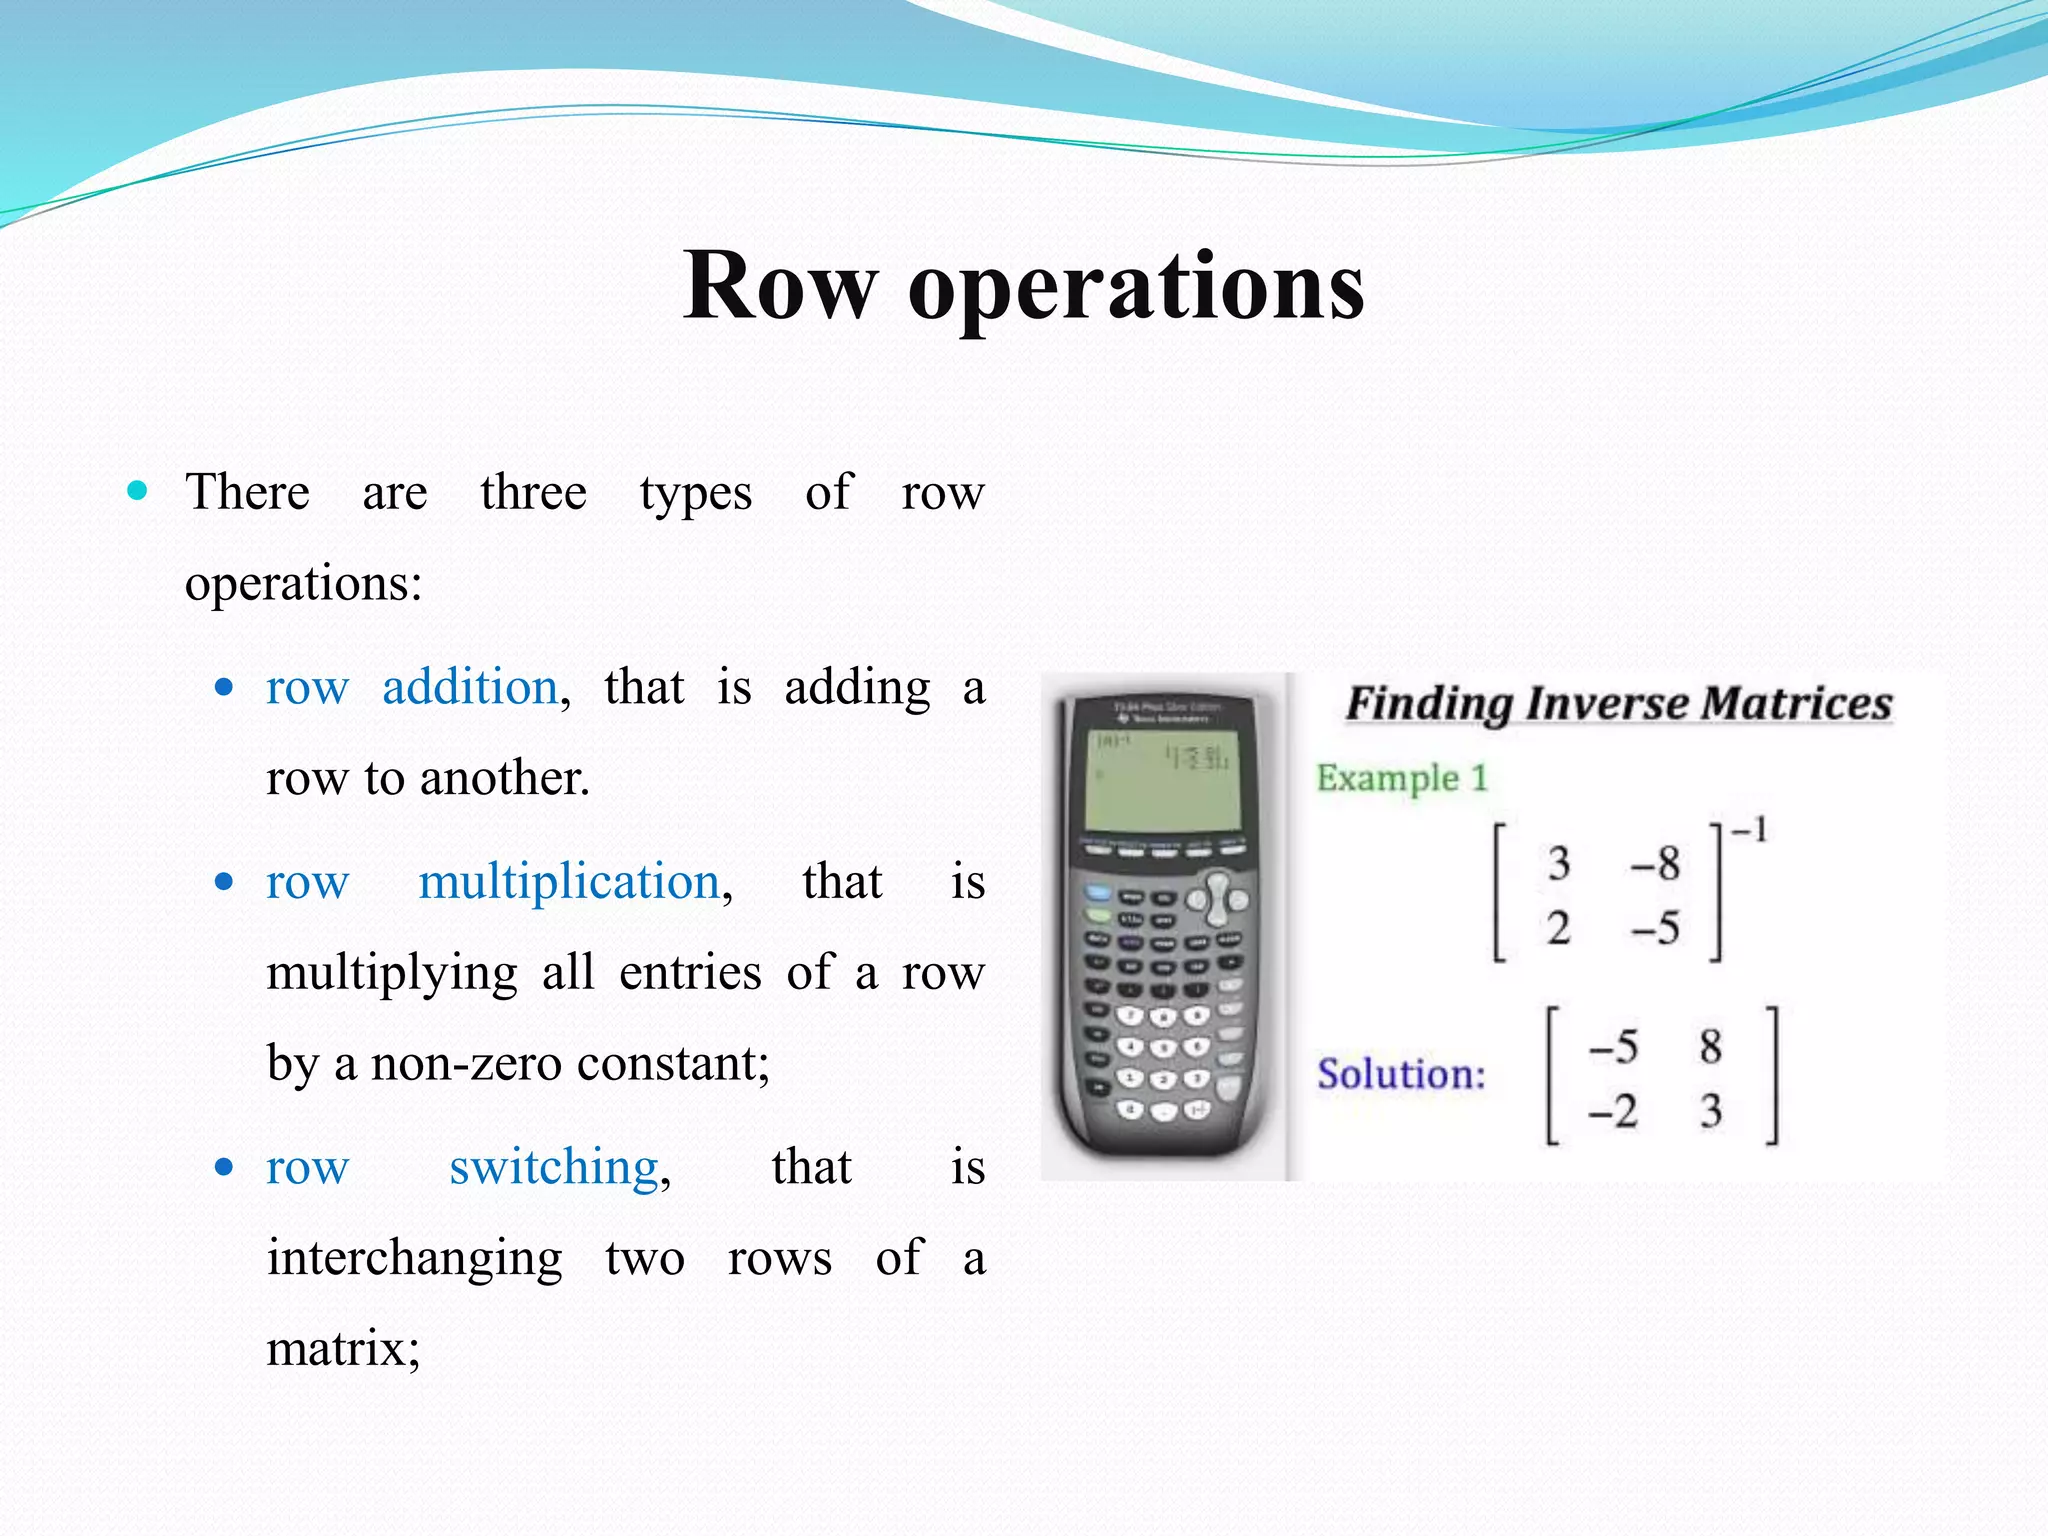
Row operations
Thereare three types of row
operations:
row addition, that is adding a
row to another.
row multiplication, that is
multiplying all entries of a row
by a non-zero constant;
row switching, that is
interchanging two rows of a
matrix;
30.
Statistics Calculator
Statisticscalculator is the most sophisticated statistics calculator online.
It can do all the basics like calculating quartiles, mean, median, mode,
variance, standard deviation as well as the correlation coefficient.
You can also do almost any kind of regression analysis (linear, quadratic,
exponential, cubic , power, logarithmic and natural Logarithmic). The
regressions and points can then be graphed.
33.
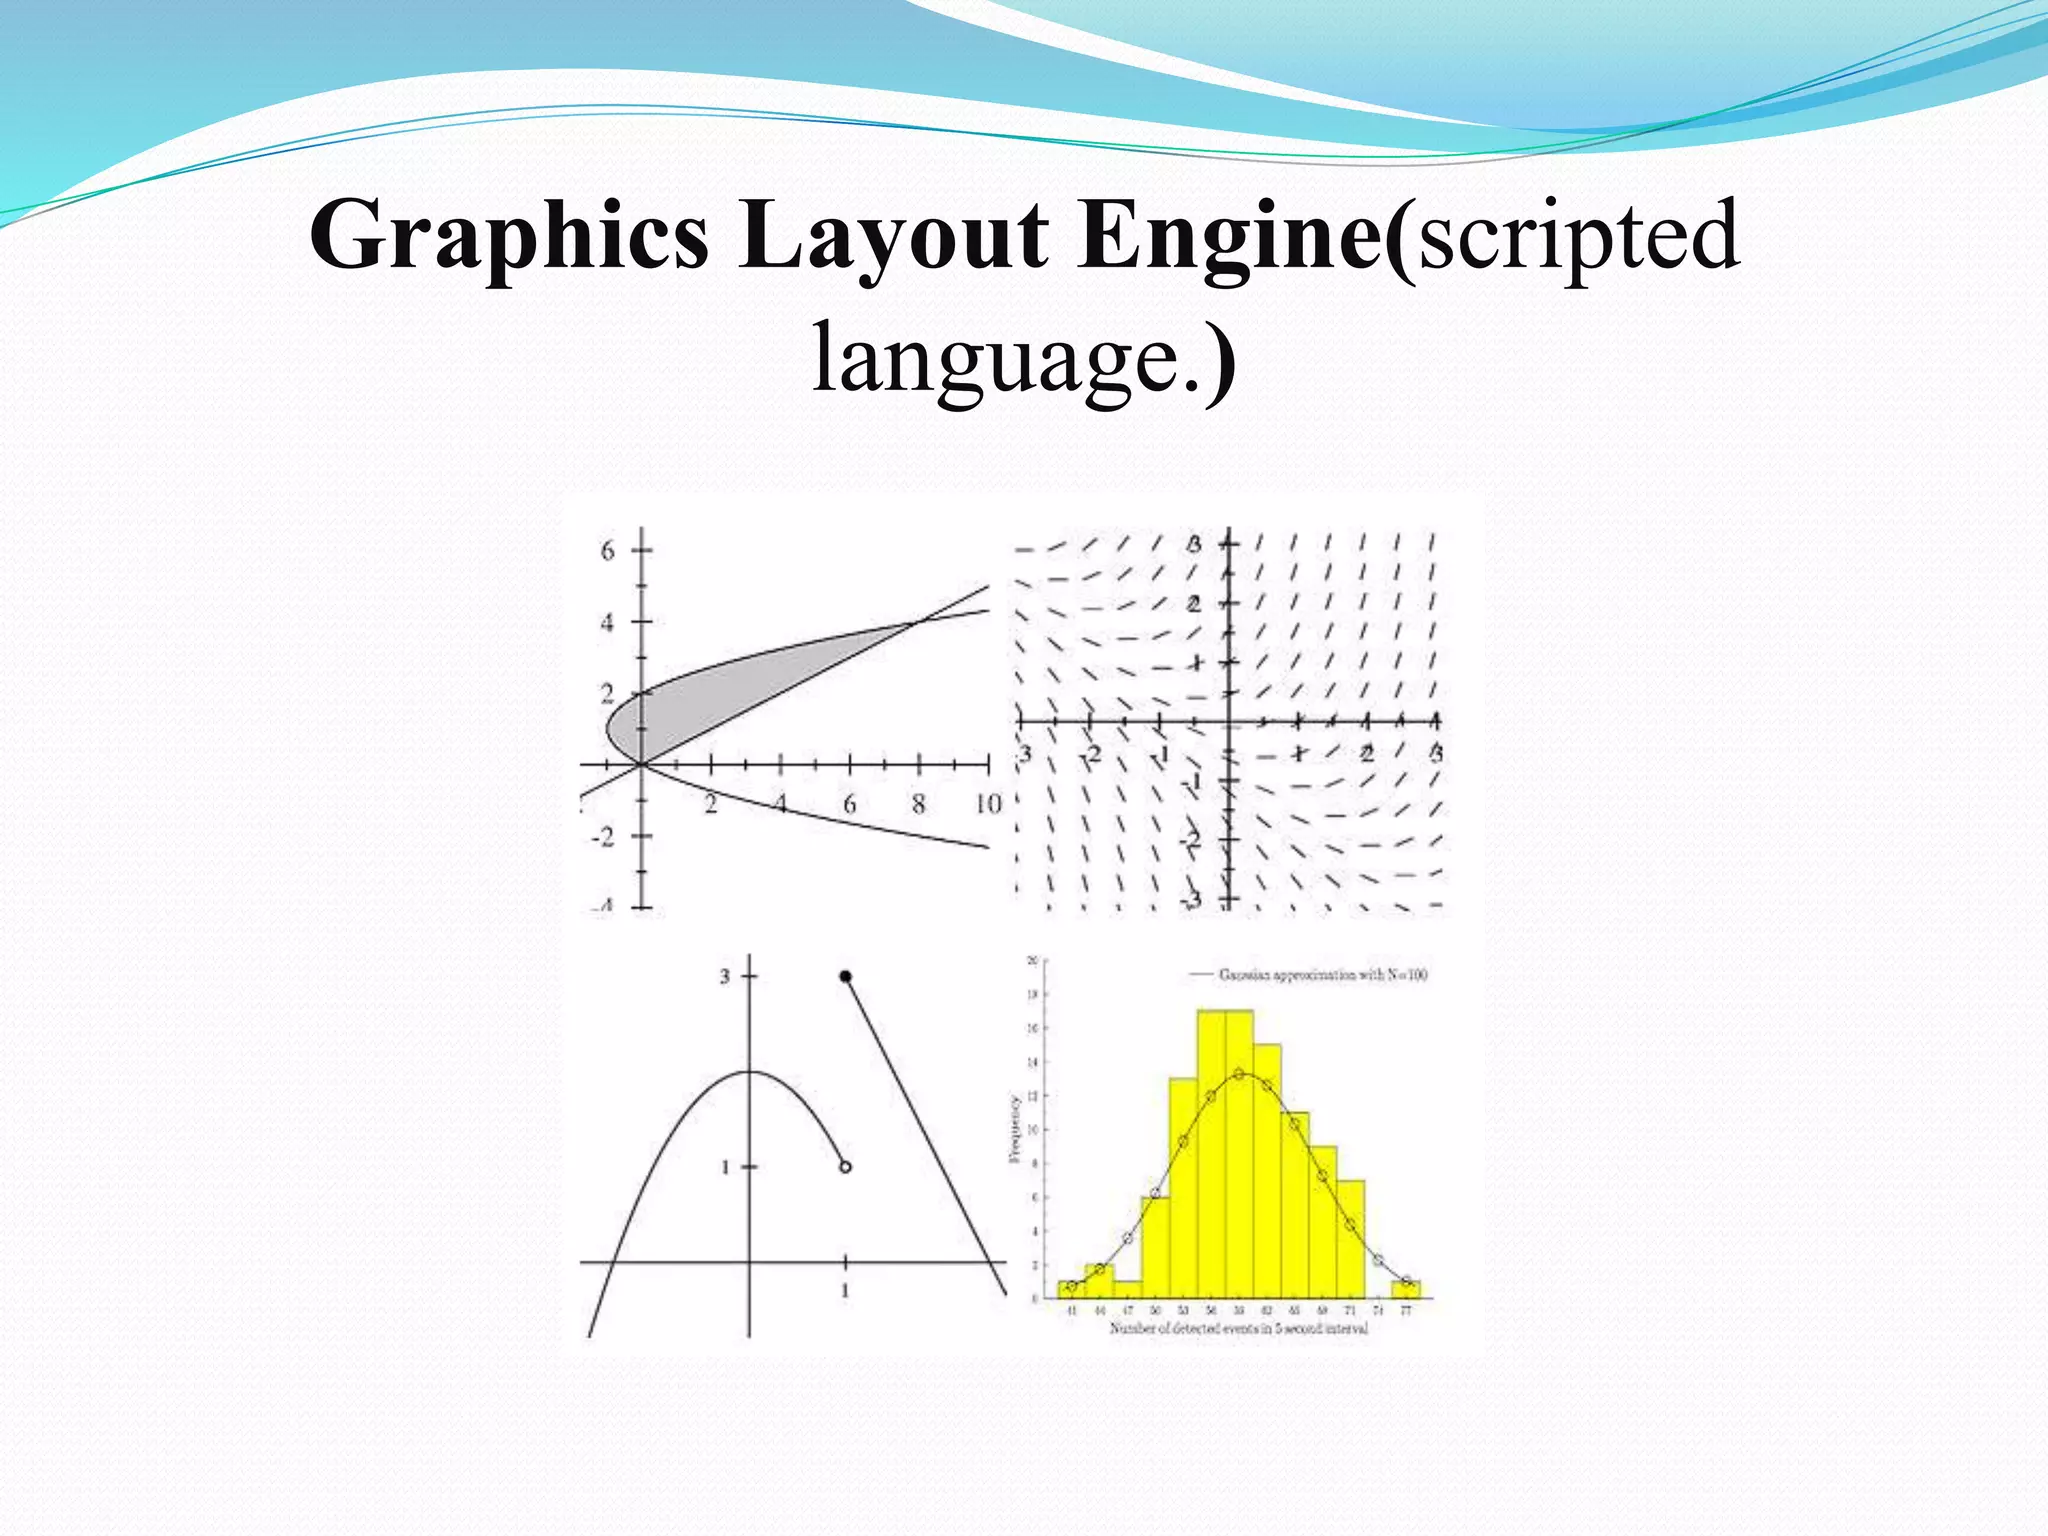
Dynamic Graphing Tools
Creating graphs is easy.
grab your favorite spreadsheet program, enter some data, and use the chart
wizard.
What's more difficult is creating those graphs to be published on the web
based on dynamic data.
Plenty of options are available to graph hard-entered data, but few are
capable of dynamic generation.
Few free web-based tools for creating different types of graphs from
dynamic data.
34.
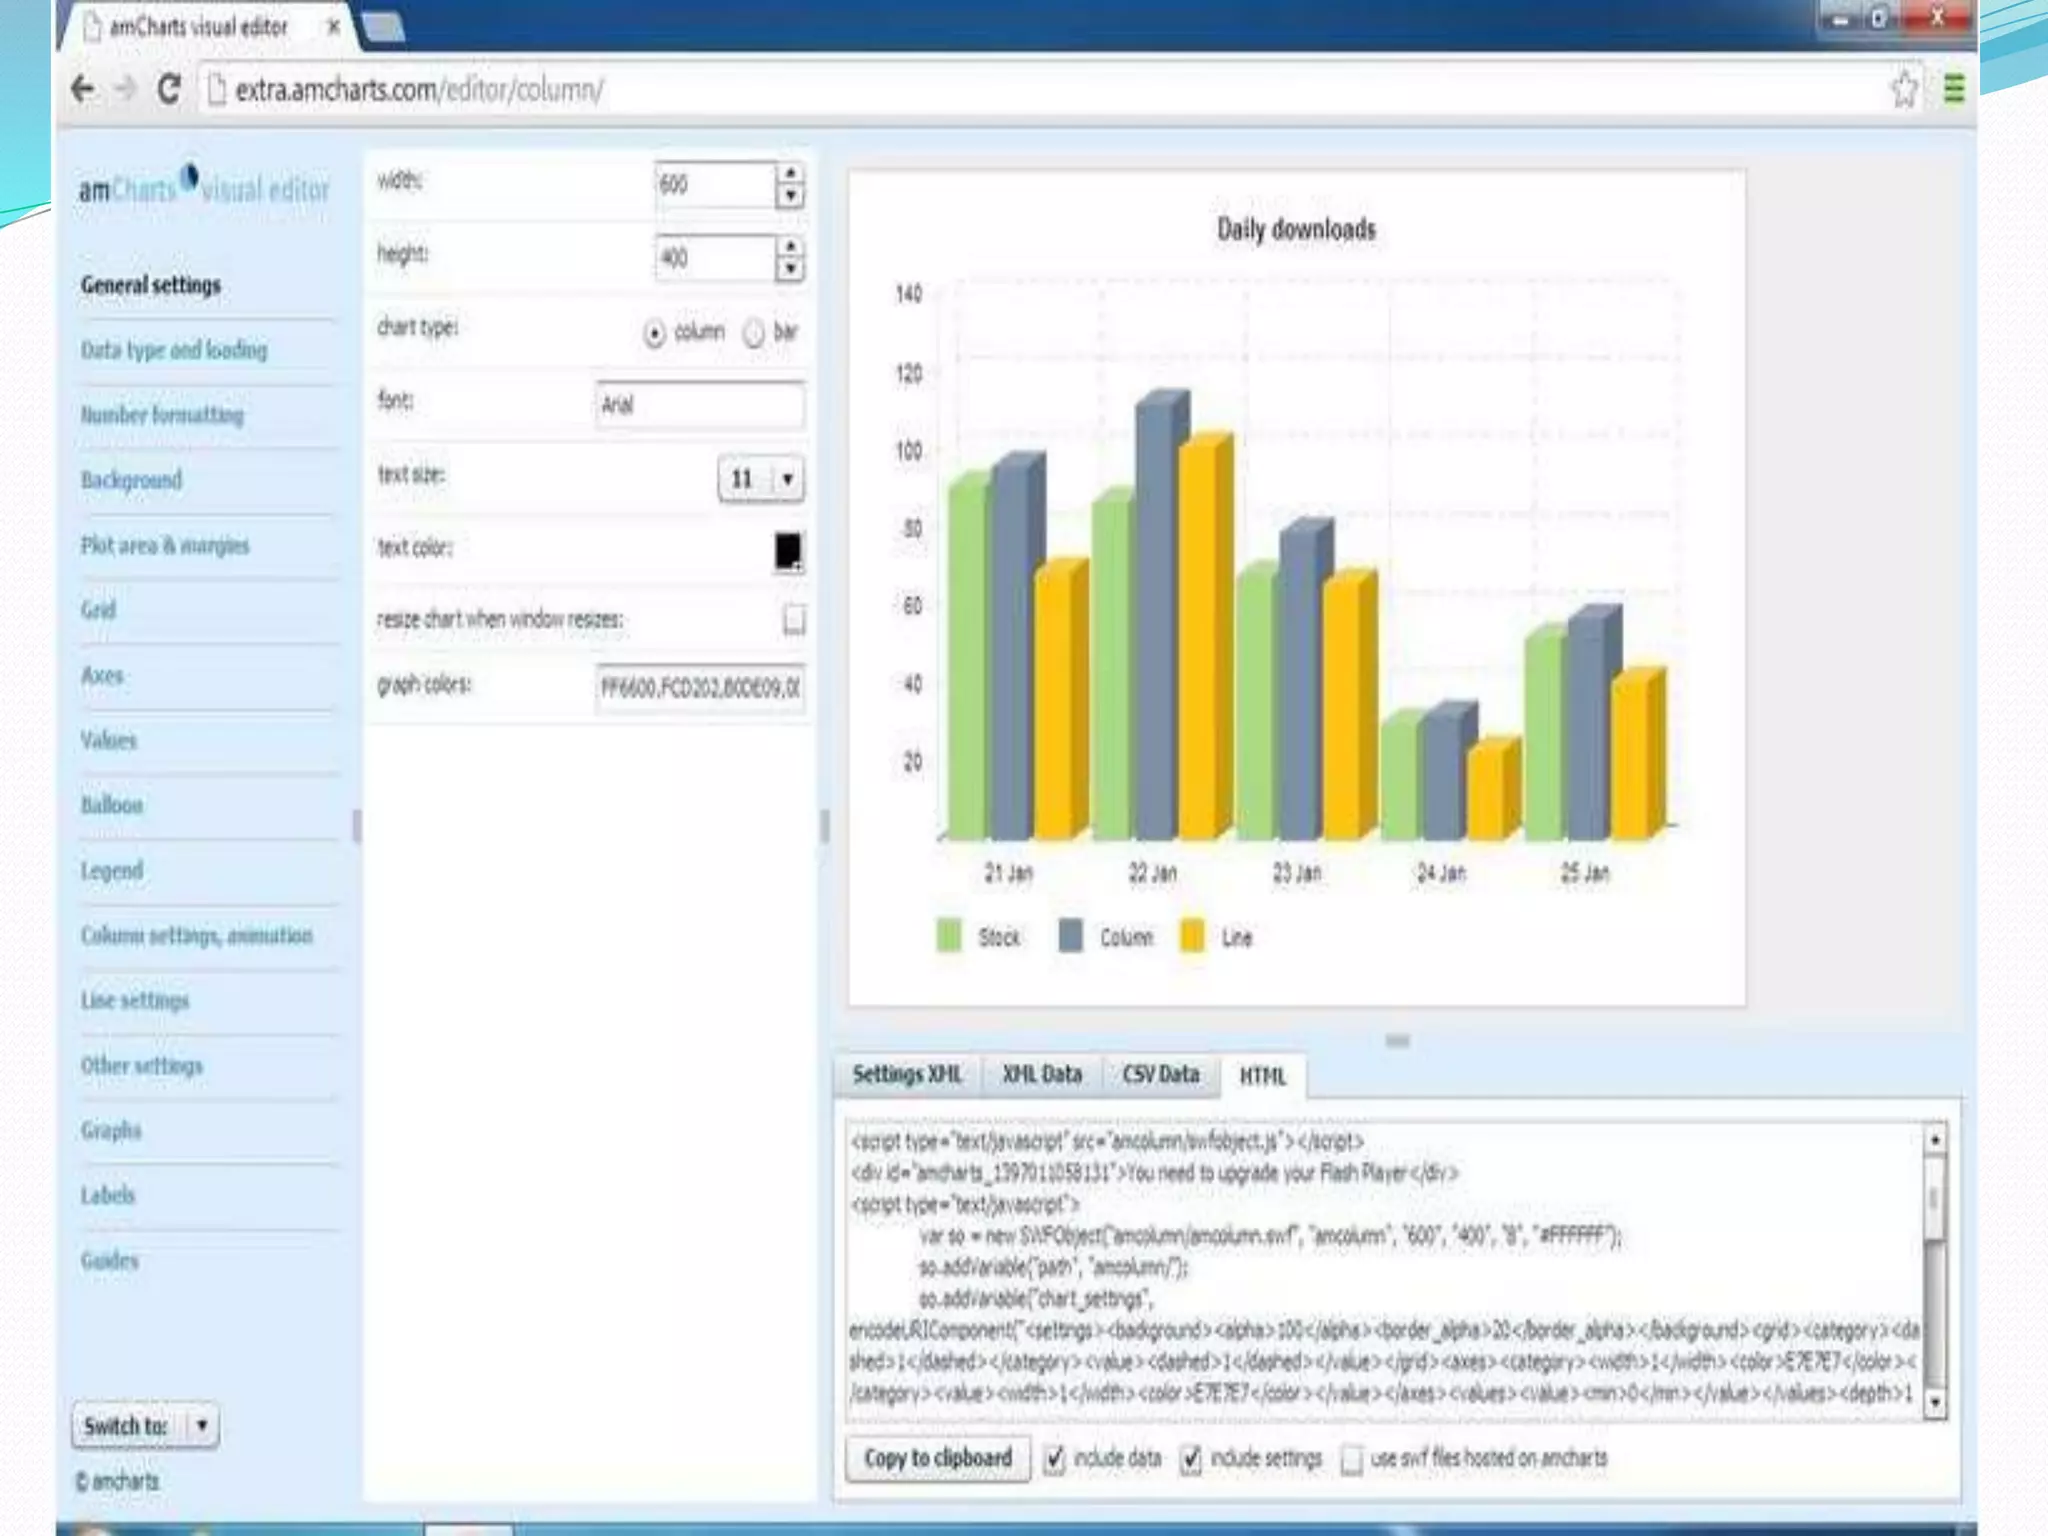
amCharts
amCharts isoffers only the basic options for the most common types of
charts.
However, it comes with a nice visual editor that allows you to paste in
sample data in a CSV format (which it then converts to XML) and
manipulate the settings all while watching your graph take shape.
When you're finished, simply copy the generated HTML code into your
page to display your Flash-based graph.
If you want to use dynamic data, replace the value in the "chart_data"
variable with a custom-generated XML dataset.
36.
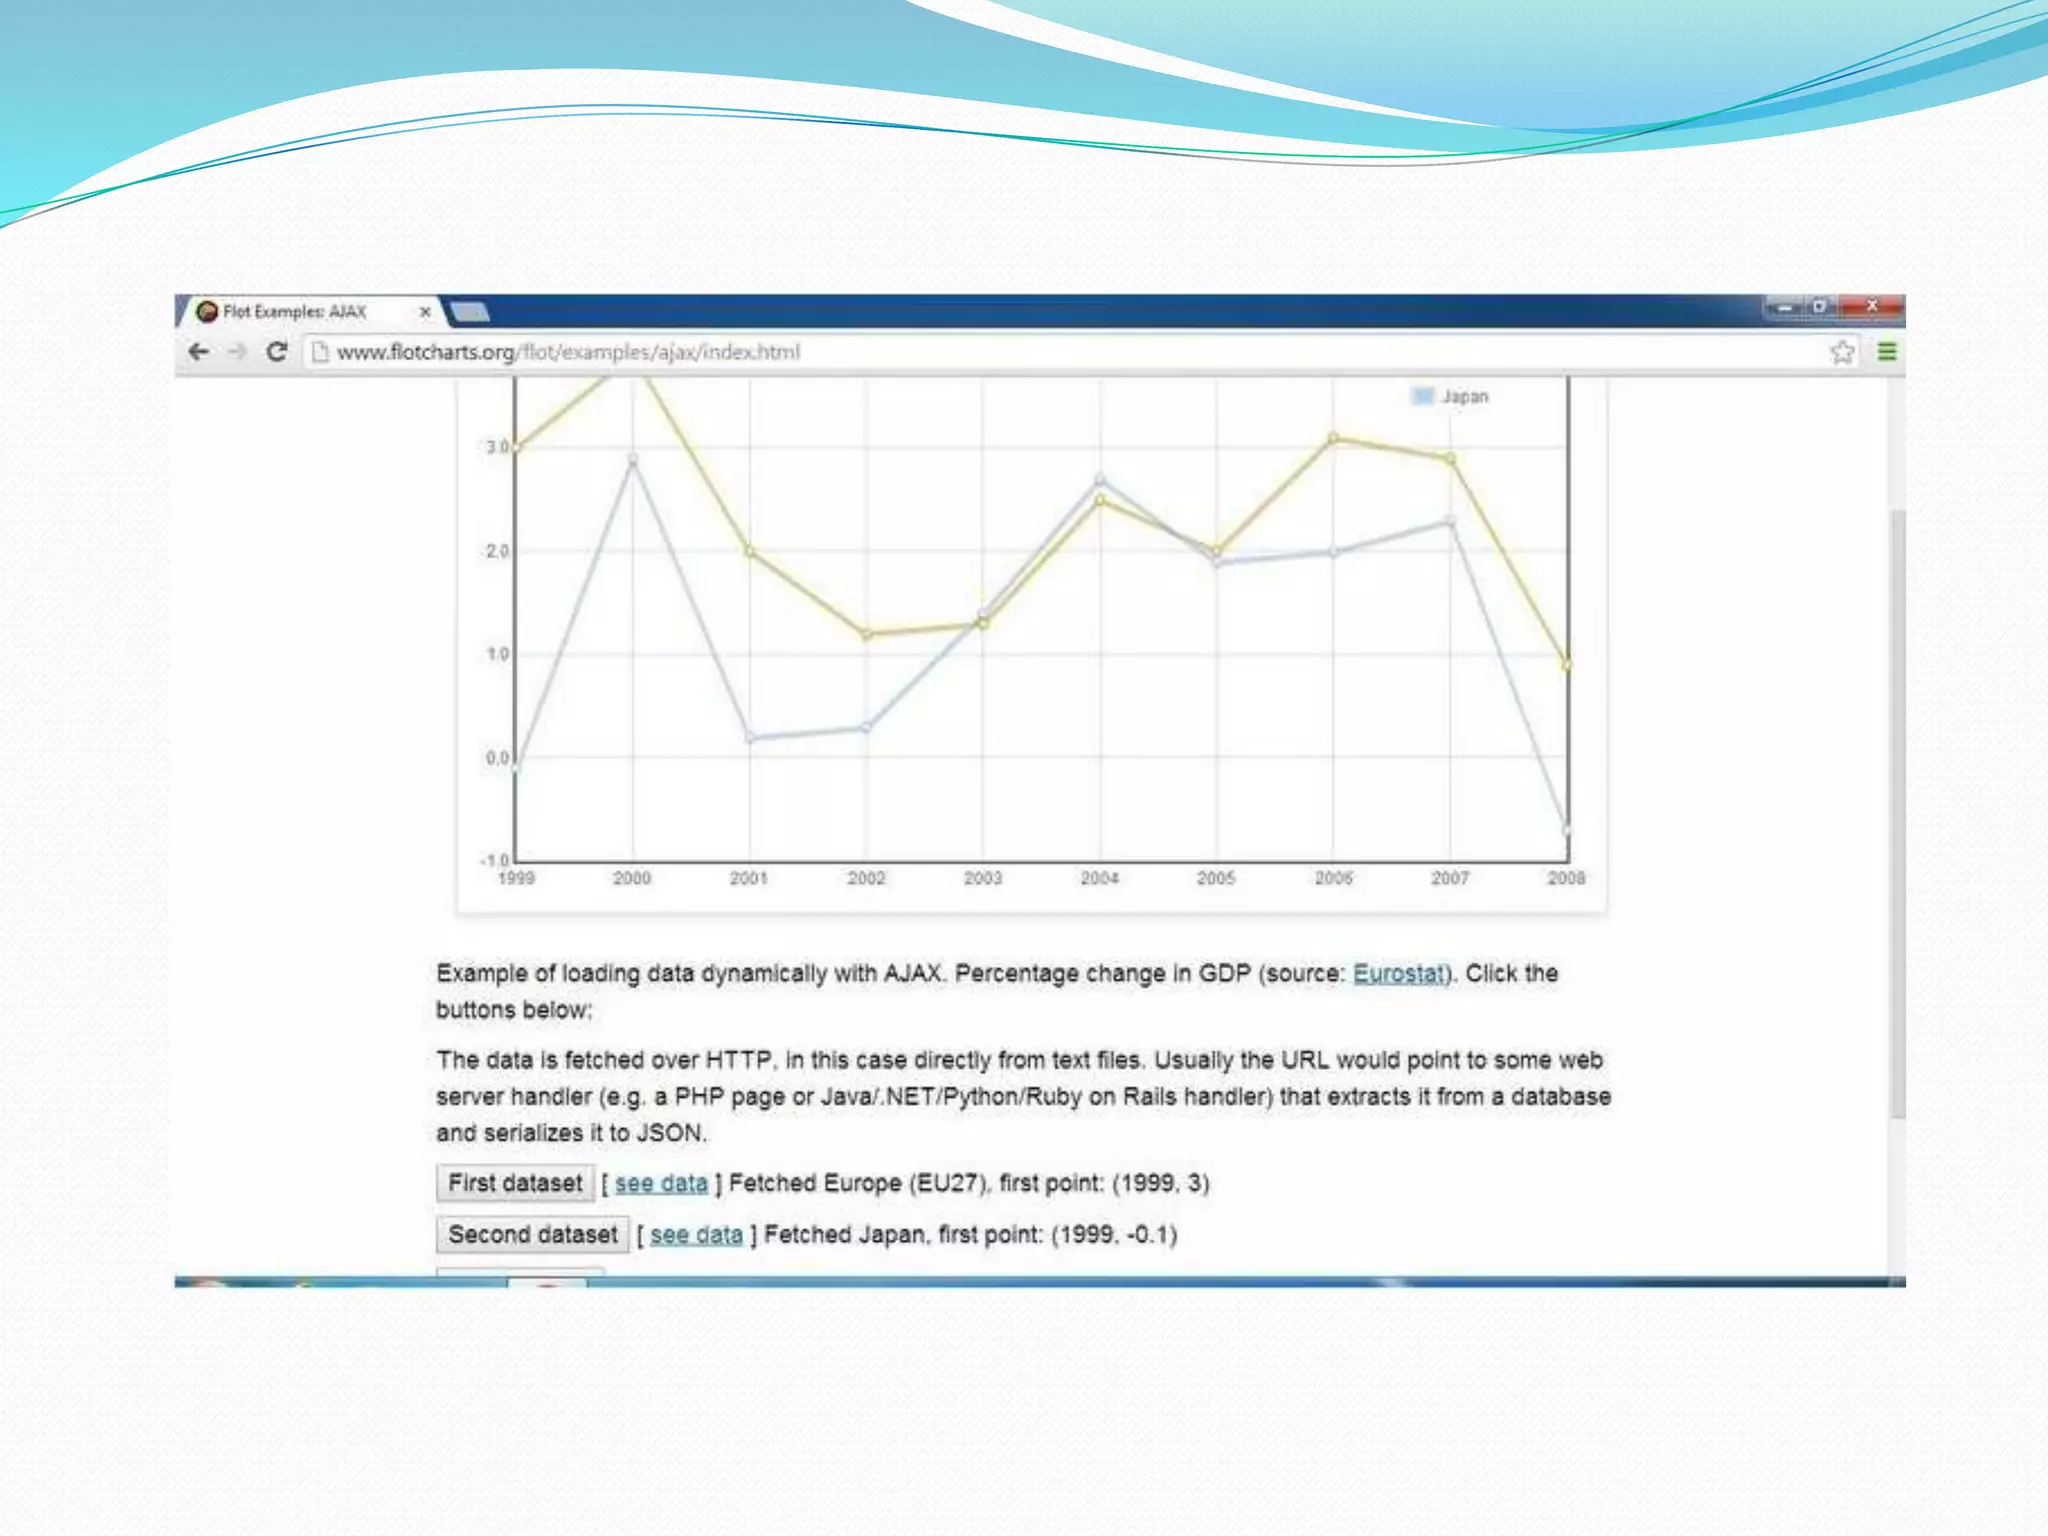
Flot
Flot isa simple jQuery-based graphing utility with a massive array of
options.
It starts with line or scatter charts that can be static or dynamic and that
allow you to customize colors, text, and other aspects.
Then, you can add in dynamic (dashboard-like) enable/disable of chart
series, click-and-drag rectangular zooming, click support, tooltips, panning,
and resizing, all via various plugins.
The advanced features include custom plot point symbols, axes
customization, data thresholding (red light - green light), and more.
Ambitious developers can even create their own plugins to share with the
community.
38.
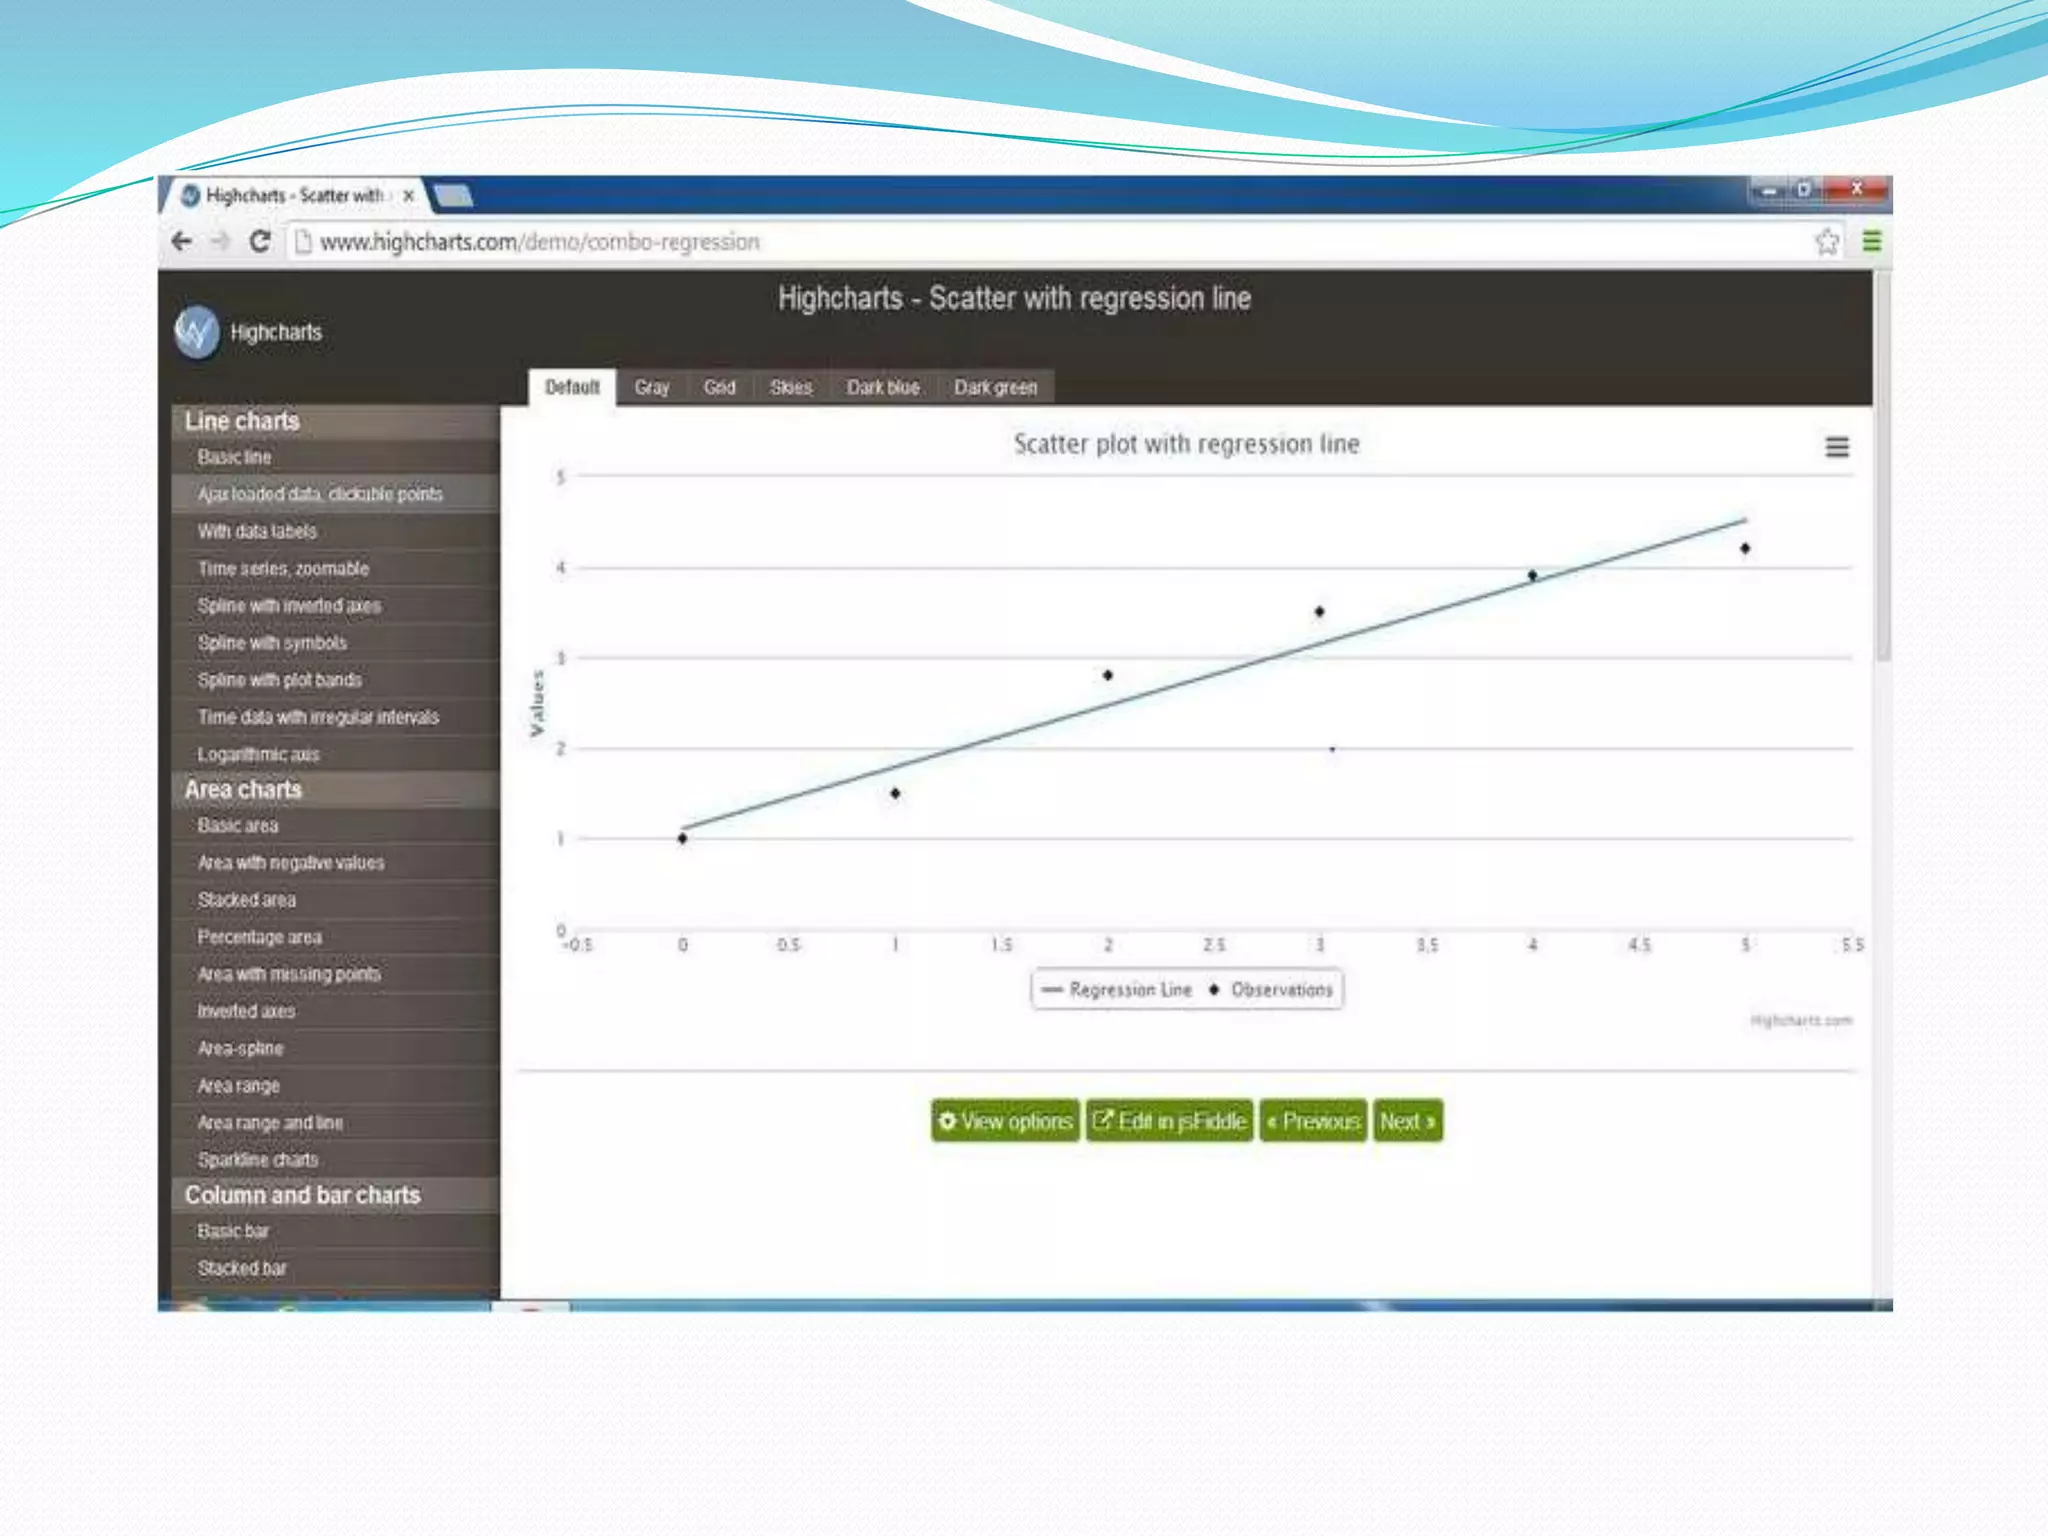
Highcharts
Using HTML5and JavaScript, Highcharts offers a wide array of charts --
basically all the common types as well as a massive array of specialized
types. They can be easily populated using JavaScript arrays or another data
source via script that writes a JavaScript array.
Highcharts is customizable -- labels, colors, and text alignment -- but its
most notable feature is the look and feel. Highcharts has a quality look to it,
and the graphs do small animations while being drawn.
For high-profile presentations, this could be useful. Highcharts links
to JSFiddle for designing and building your charts and graphs.
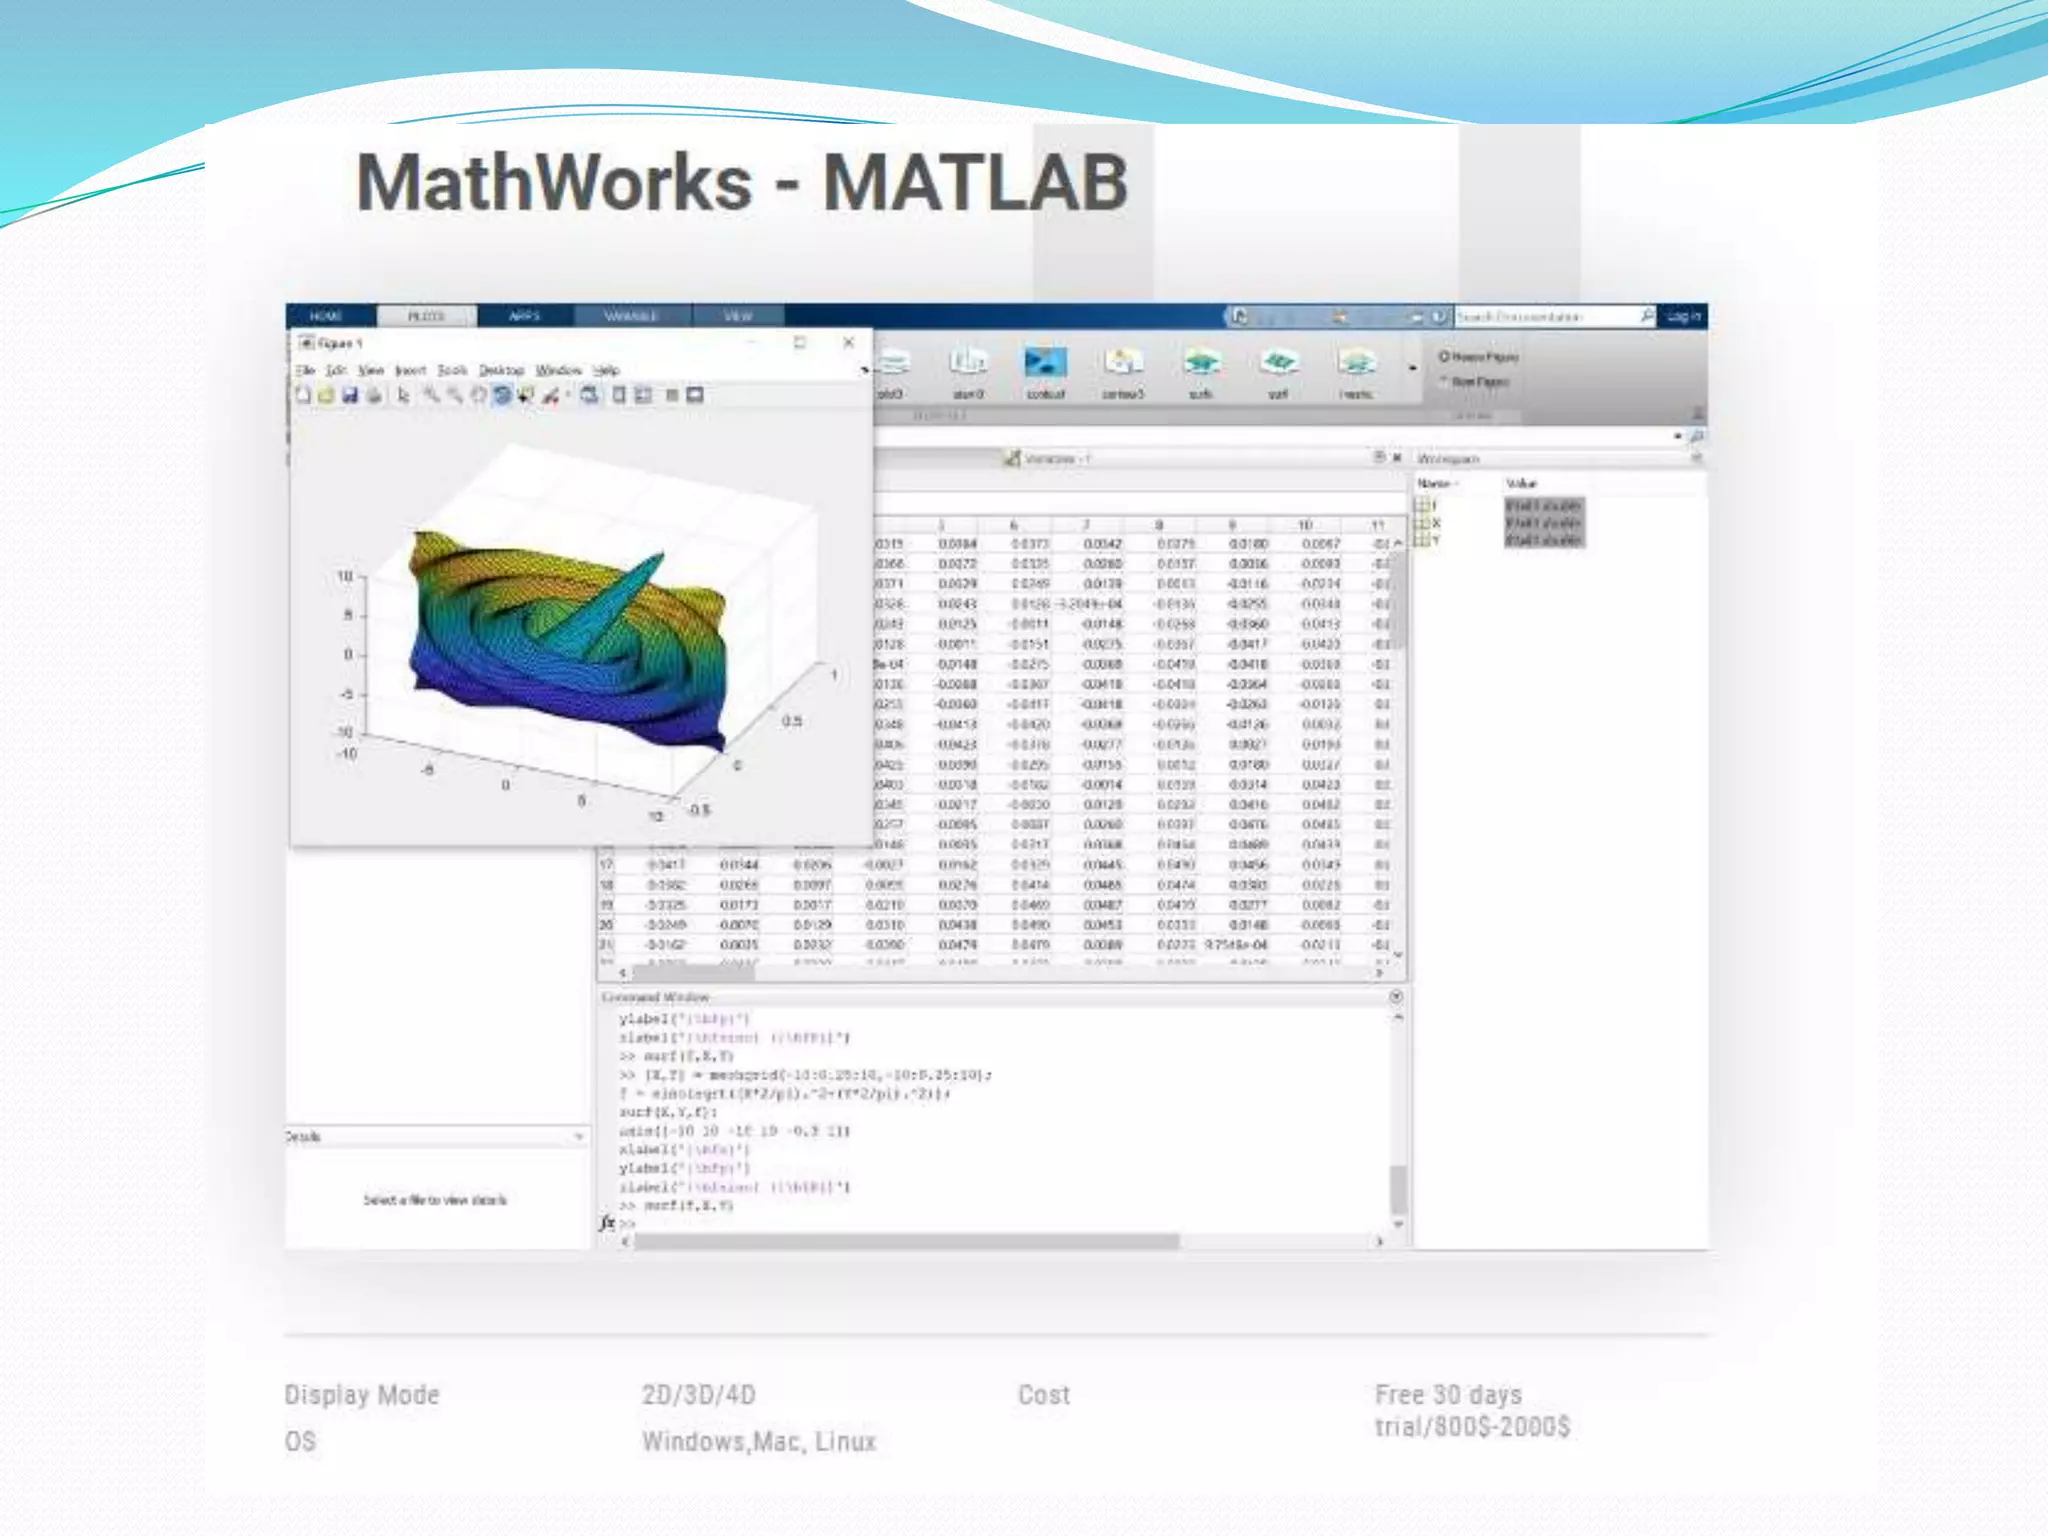
MATLAB
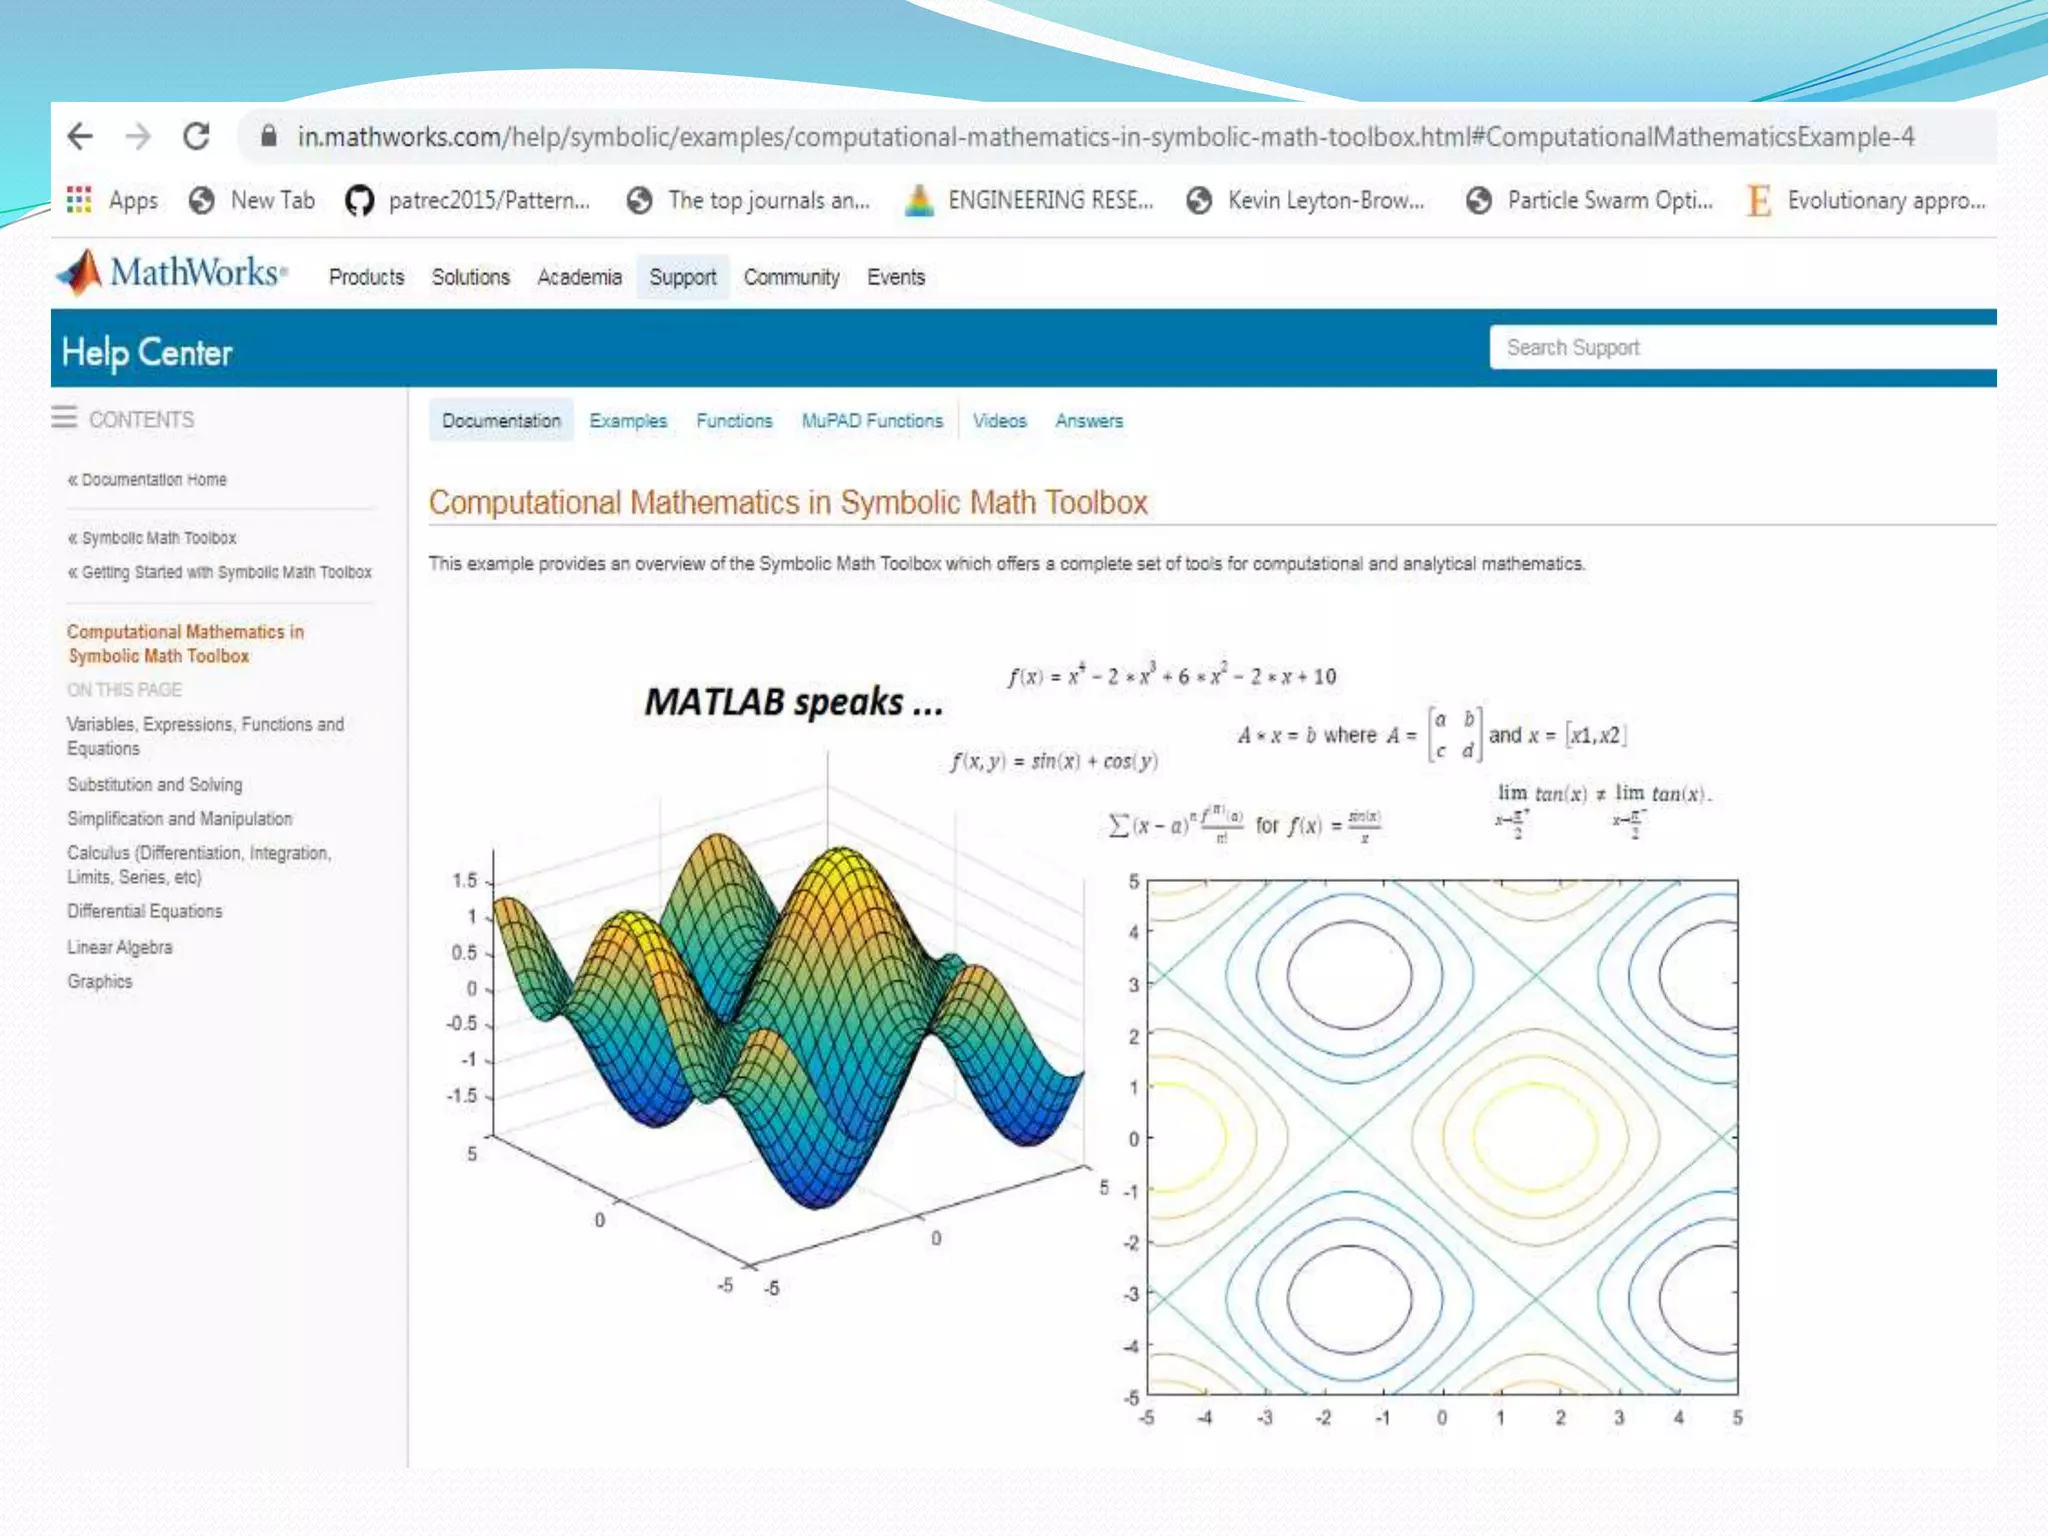
MathWorks productsprovide all the tools you need to develop mathematical
models. MATLAB supports both numeric and symbolic modeling approaches
and provides curve fitting, statistics, optimization, ODE and PDE solving,
calculus, and other core mathematical tools.
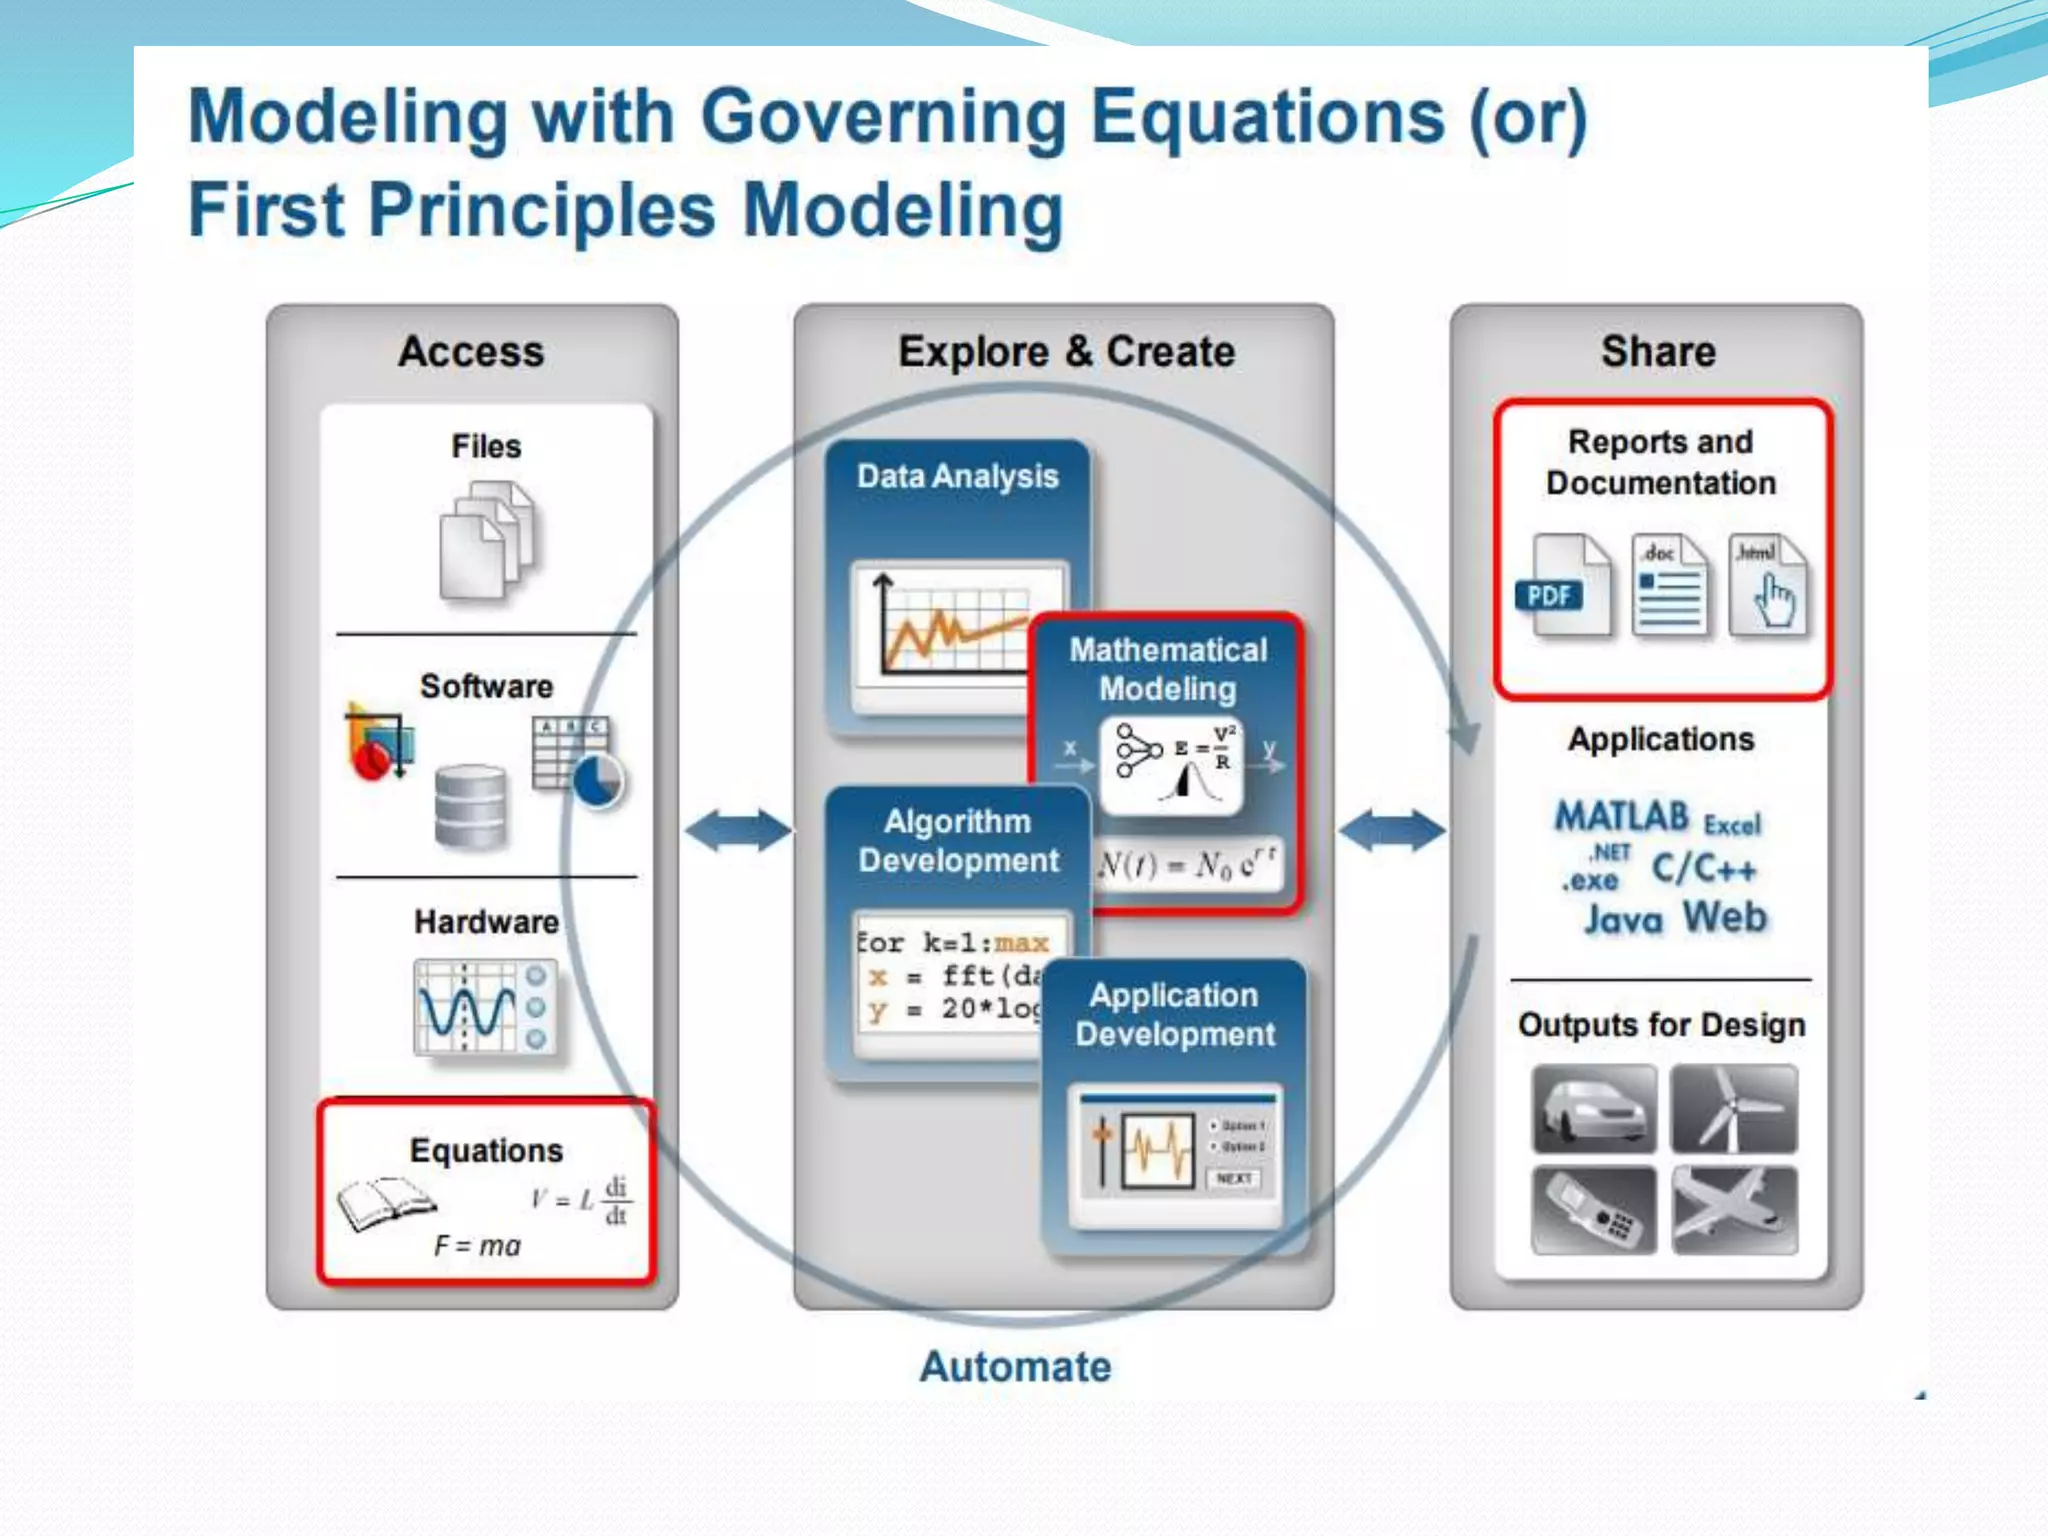
Mathematical models are critical to understanding and accurately predicting
the behavior of complex systems. These models enable critical tasks, such as:
Forecasting and optimizing system behavior
Designing control systems
Characterizing system response
57.
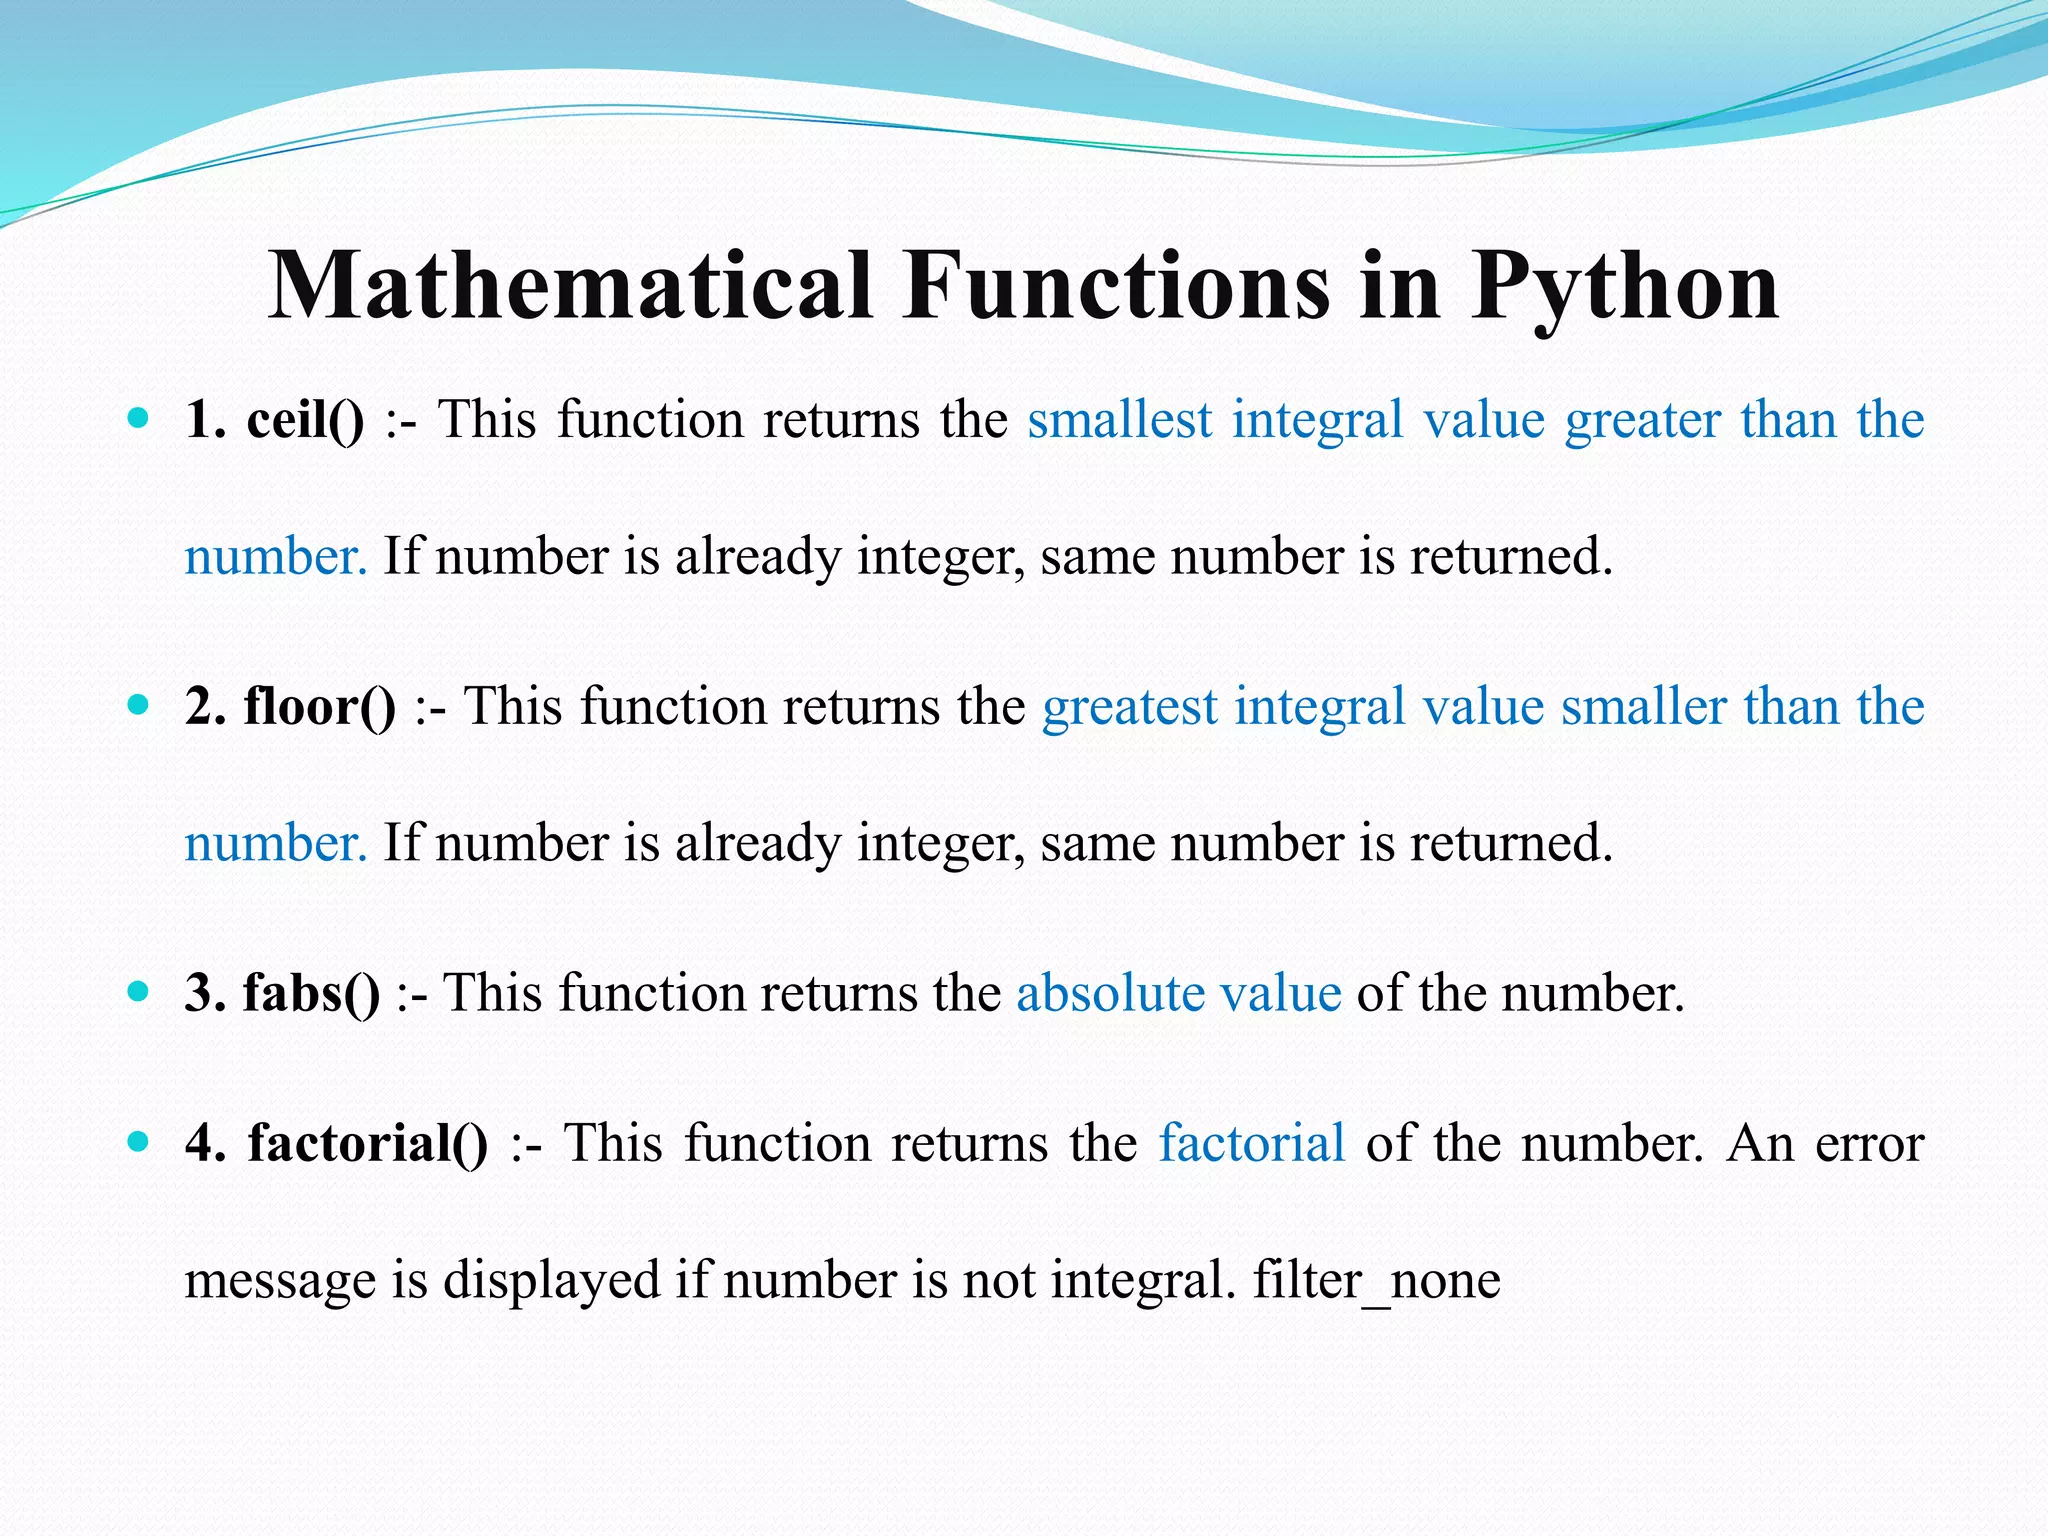
Mathematical Functions inPython
1. ceil() :- This function returns the smallest integral value greater than the
number. If number is already integer, same number is returned.
2. floor() :- This function returns the greatest integral value smaller than the
number. If number is already integer, same number is returned.
3. fabs() :- This function returns the absolute value of the number.
4. factorial() :- This function returns the factorial of the number. An error
message is displayed if number is not integral. filter_none
58.
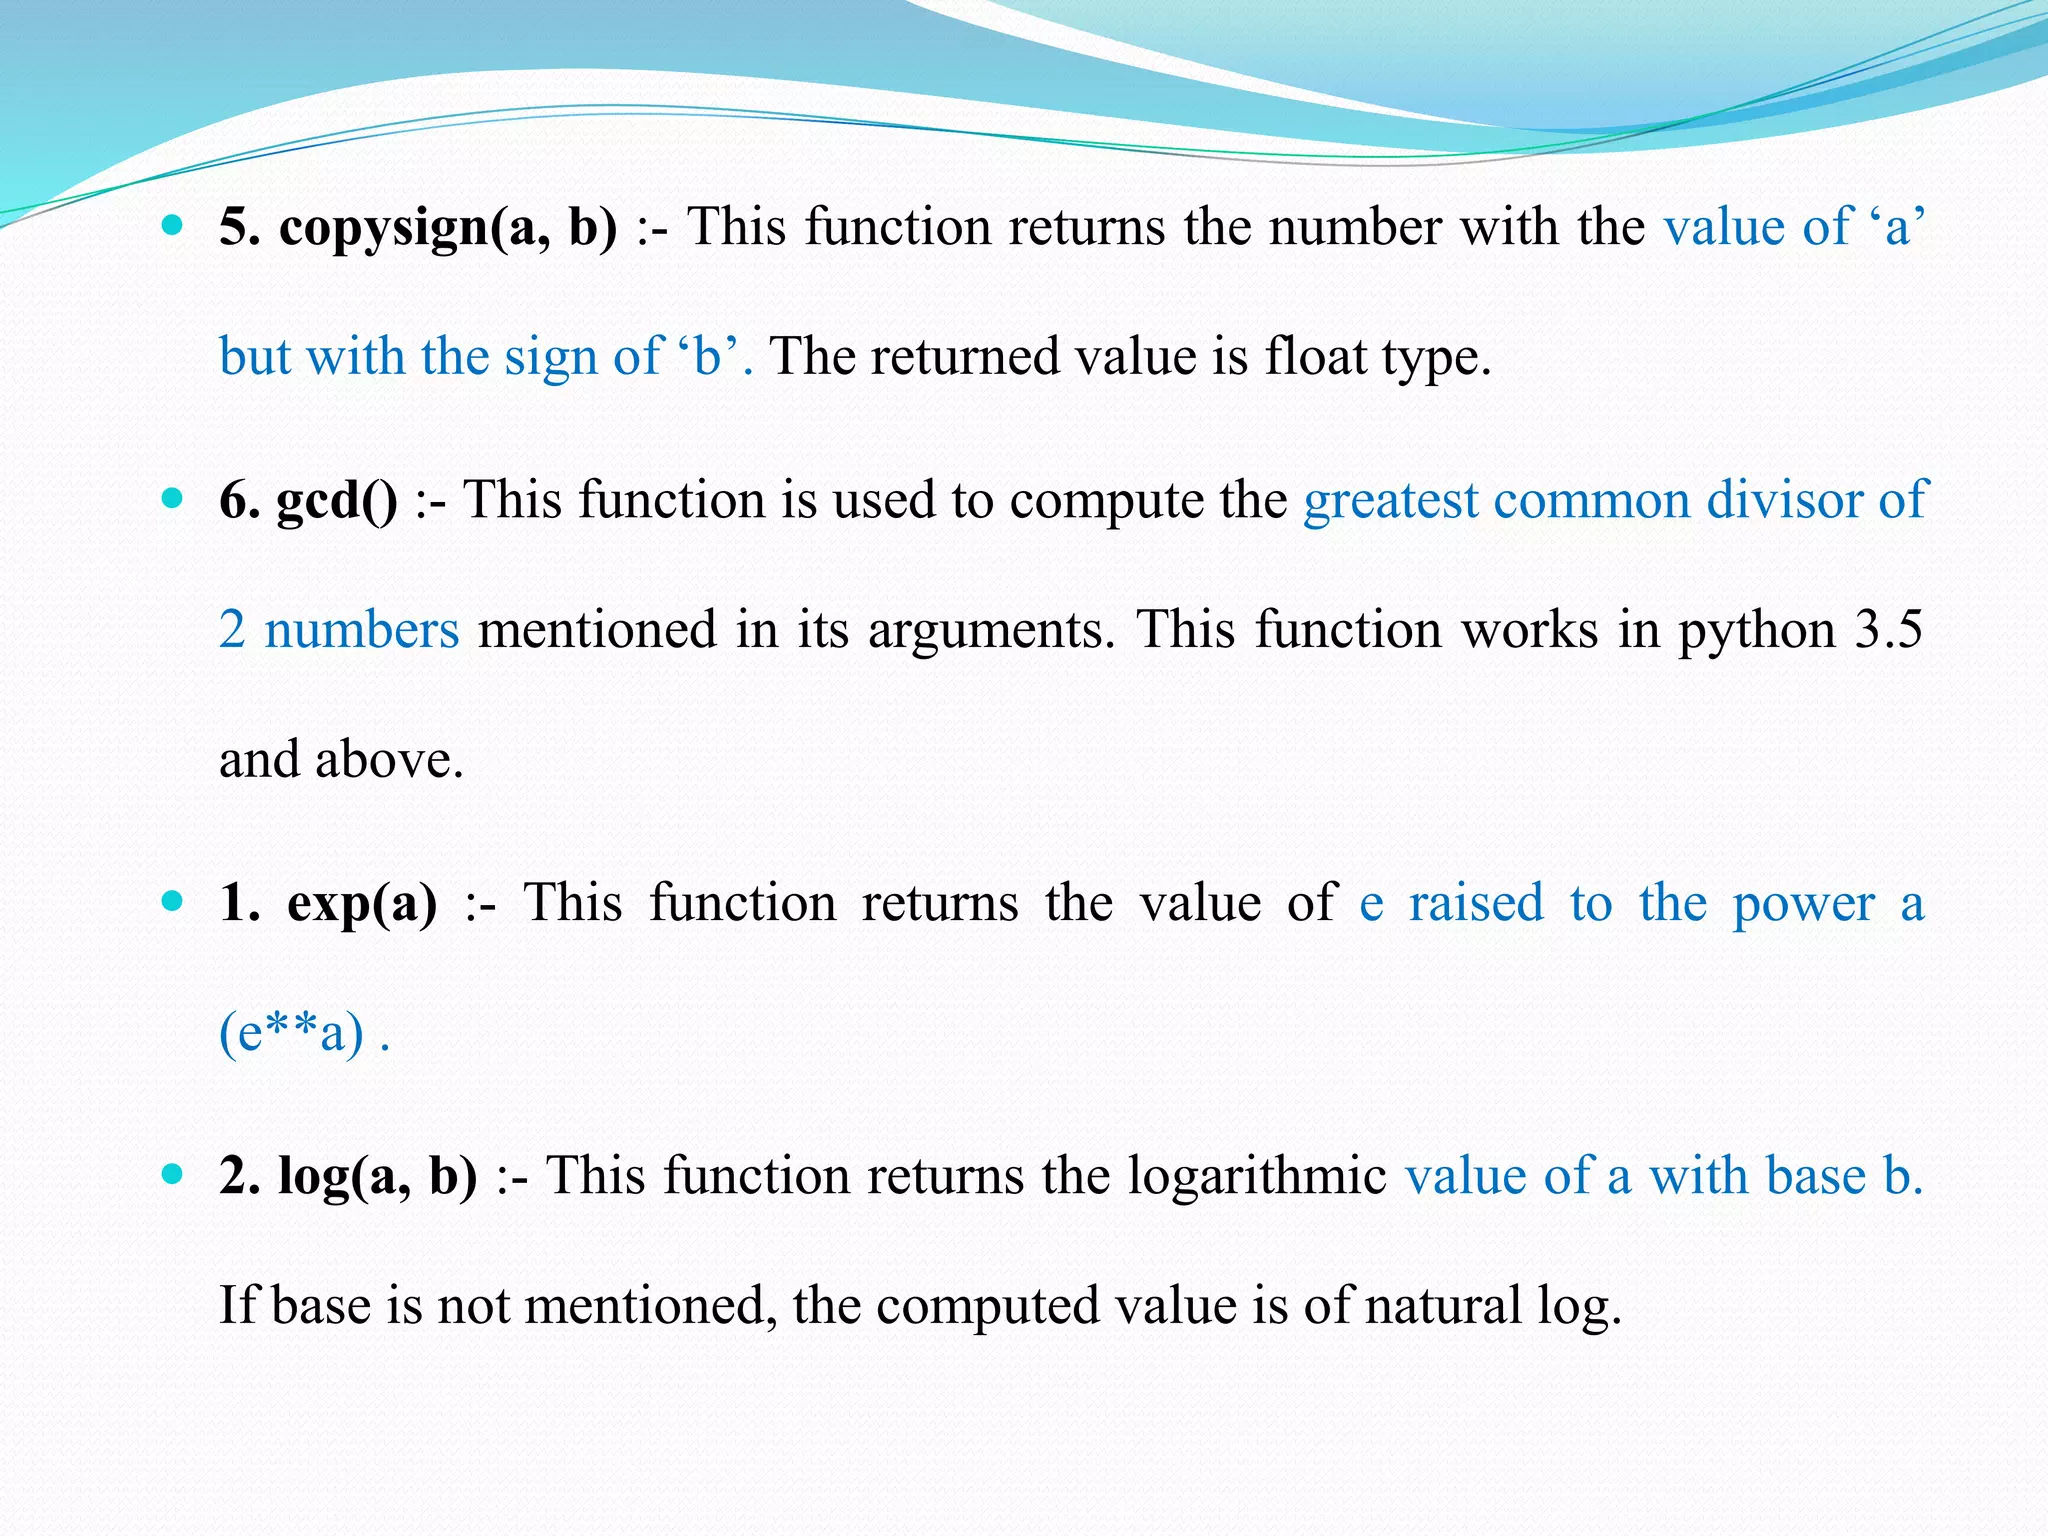
5. copysign(a,b) :- This function returns the number with the value of ‘a’
but with the sign of ‘b’. The returned value is float type.
6. gcd() :- This function is used to compute the greatest common divisor of
2 numbers mentioned in its arguments. This function works in python 3.5
and above.
1. exp(a) :- This function returns the value of e raised to the power a
(e**a) .
2. log(a, b) :- This function returns the logarithmic value of a with base b.
If base is not mentioned, the computed value is of natural log.
59.
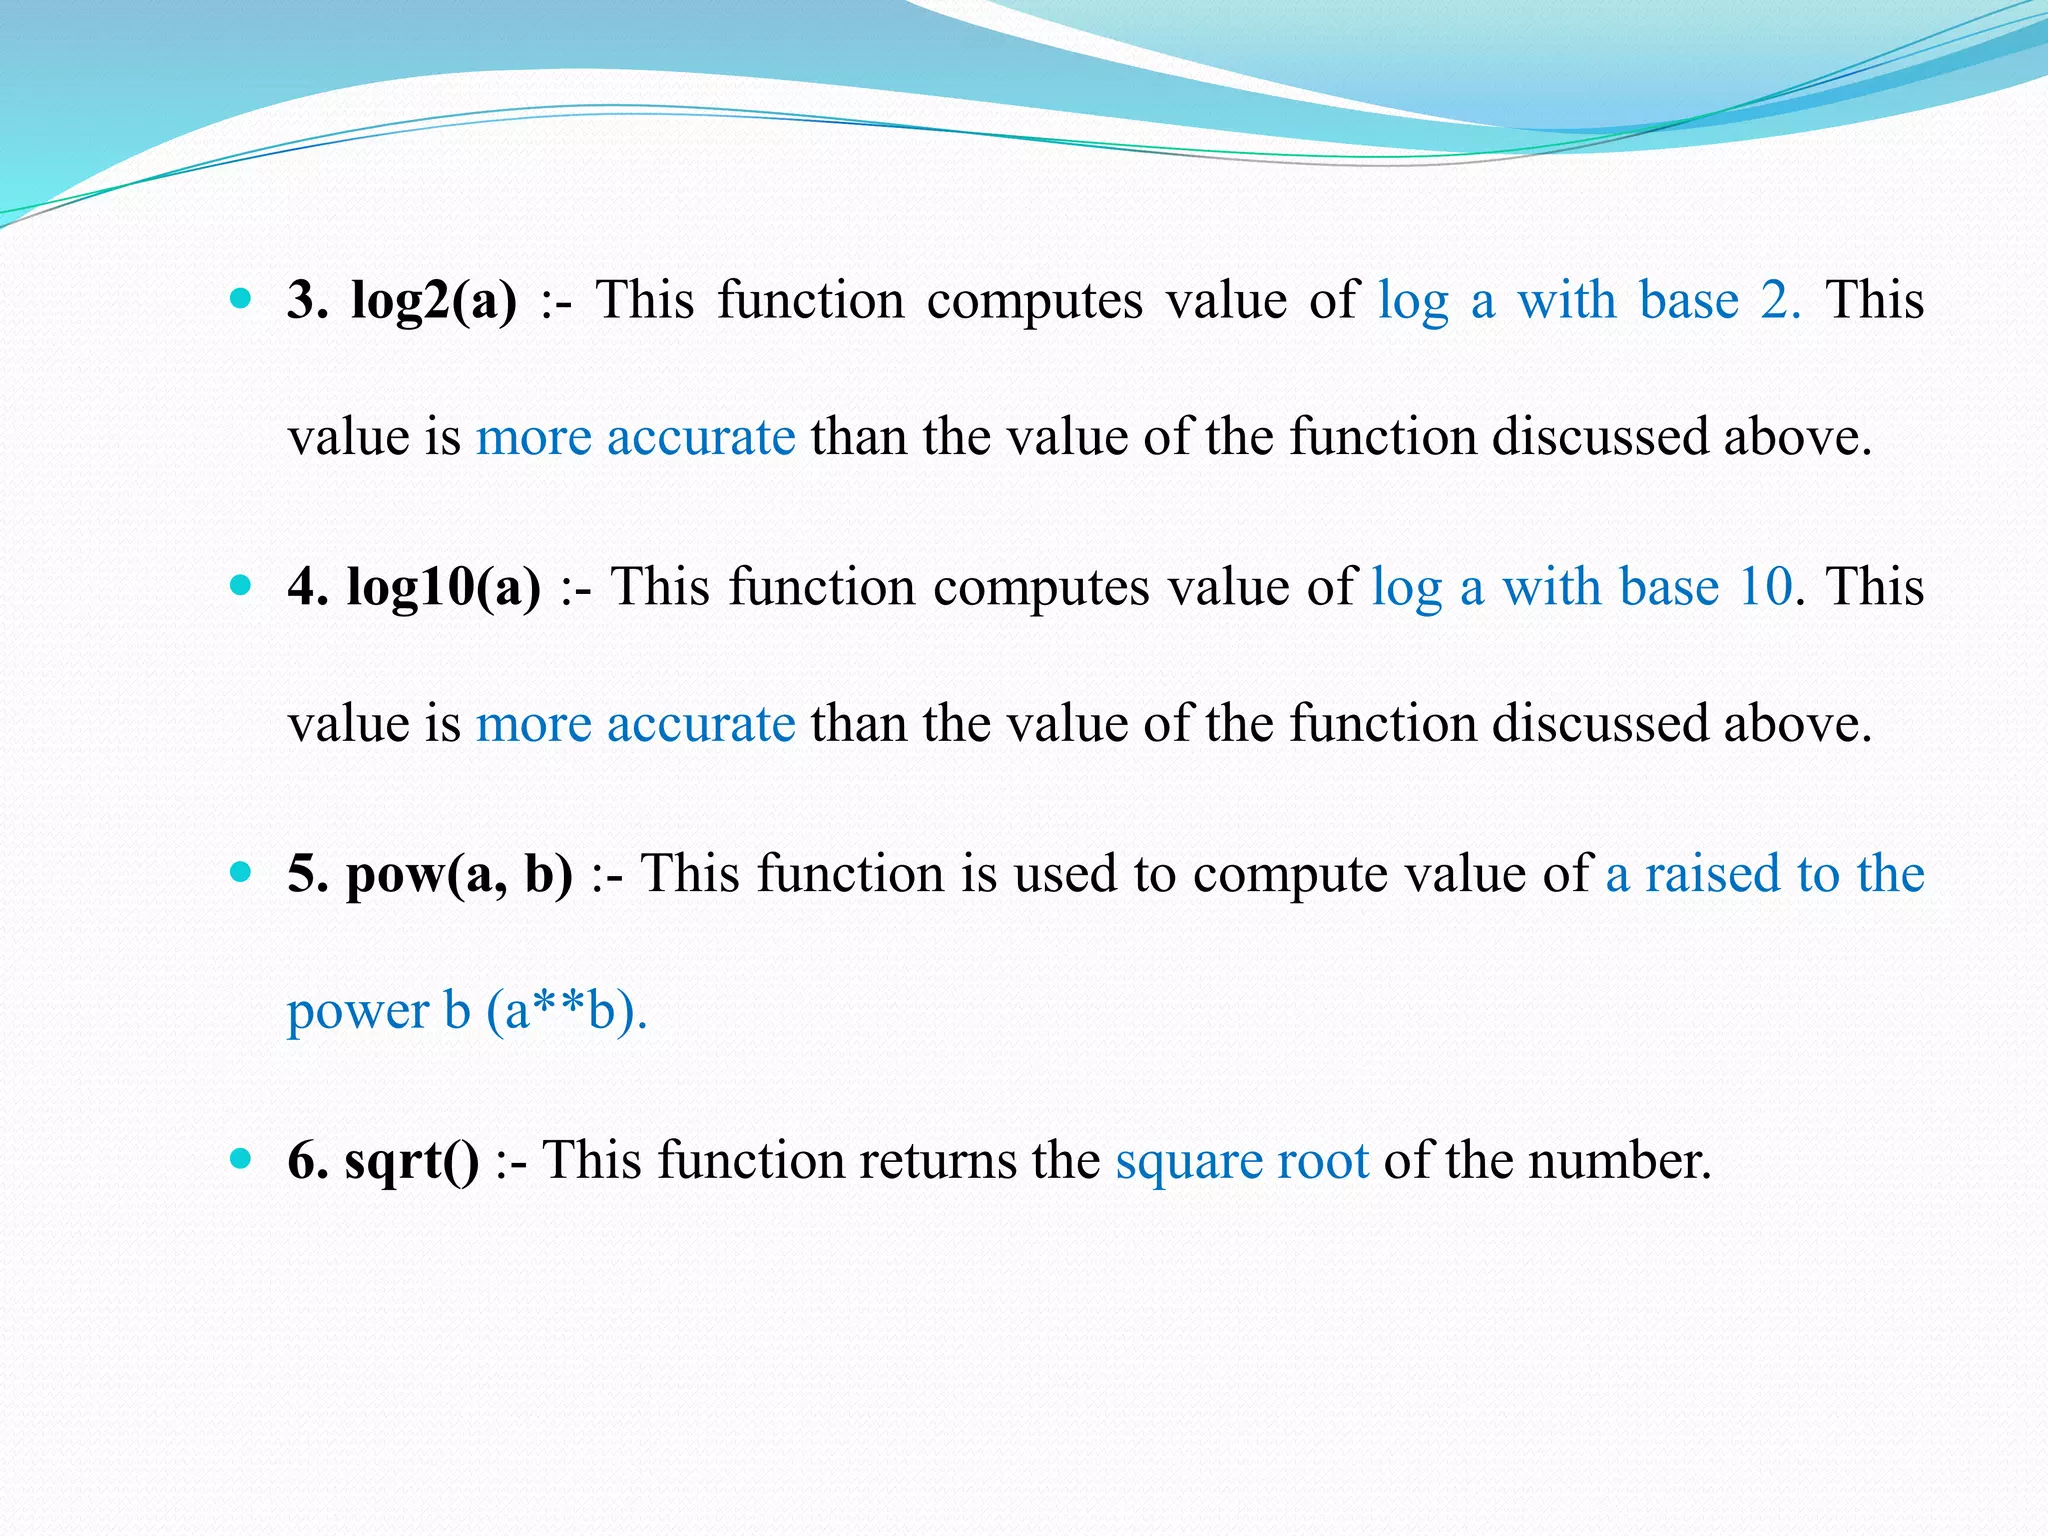
3. log2(a):- This function computes value of log a with base 2. This
value is more accurate than the value of the function discussed above.
4. log10(a) :- This function computes value of log a with base 10. This
value is more accurate than the value of the function discussed above.
5. pow(a, b) :- This function is used to compute value of a raised to the
power b (a**b).
6. sqrt() :- This function returns the square root of the number.
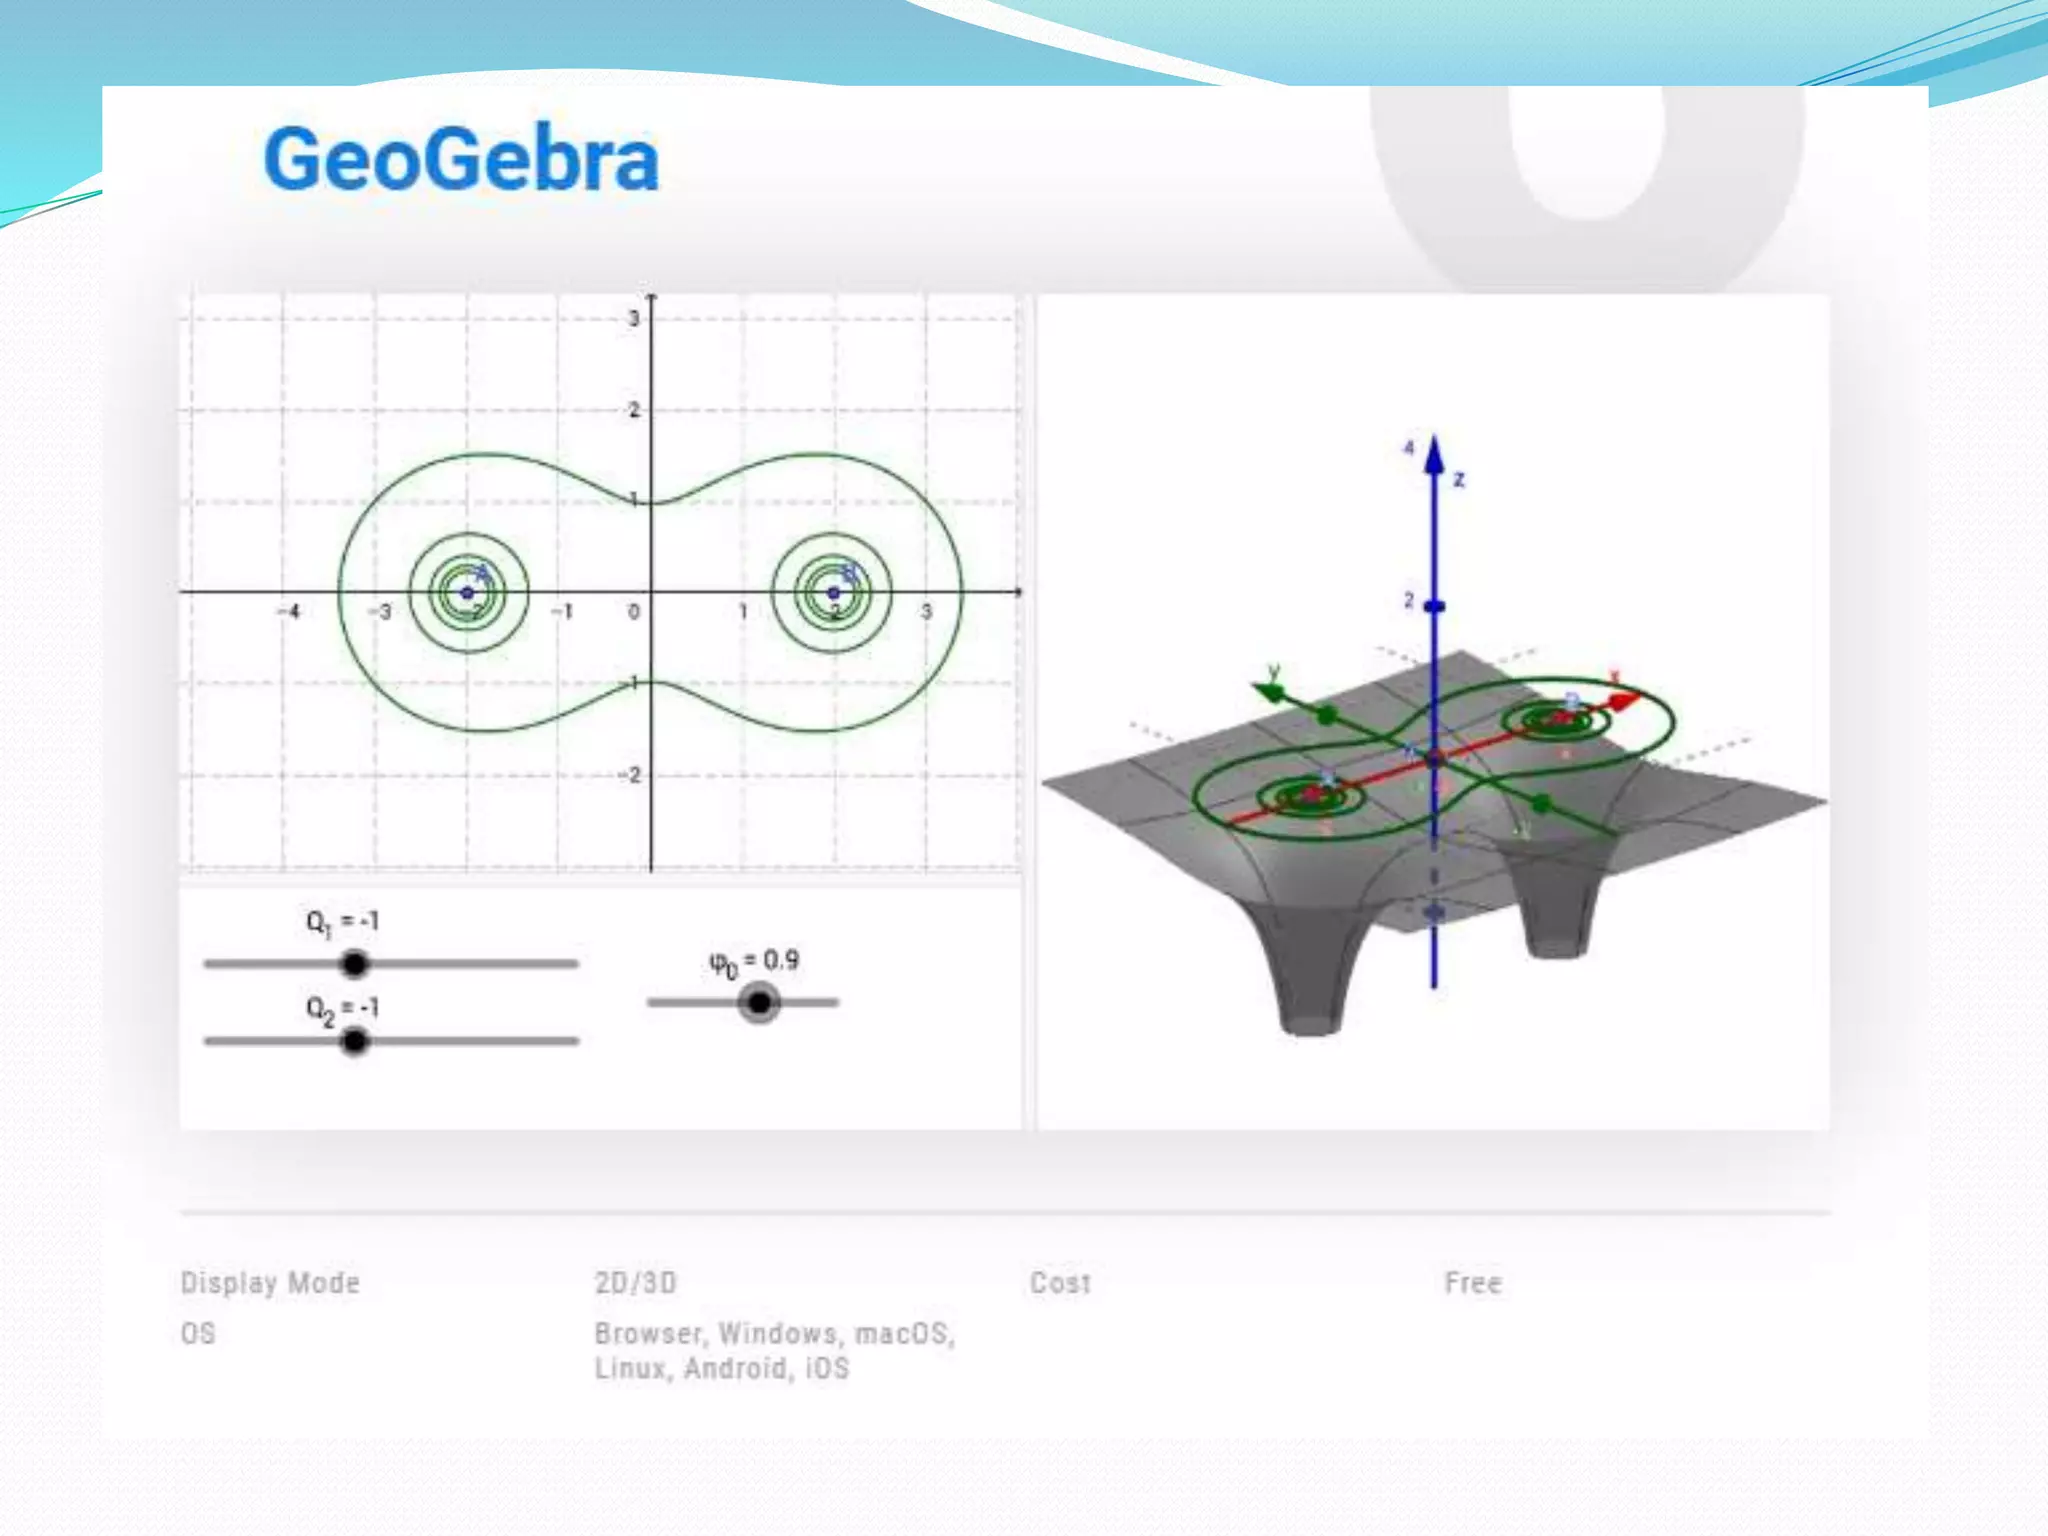
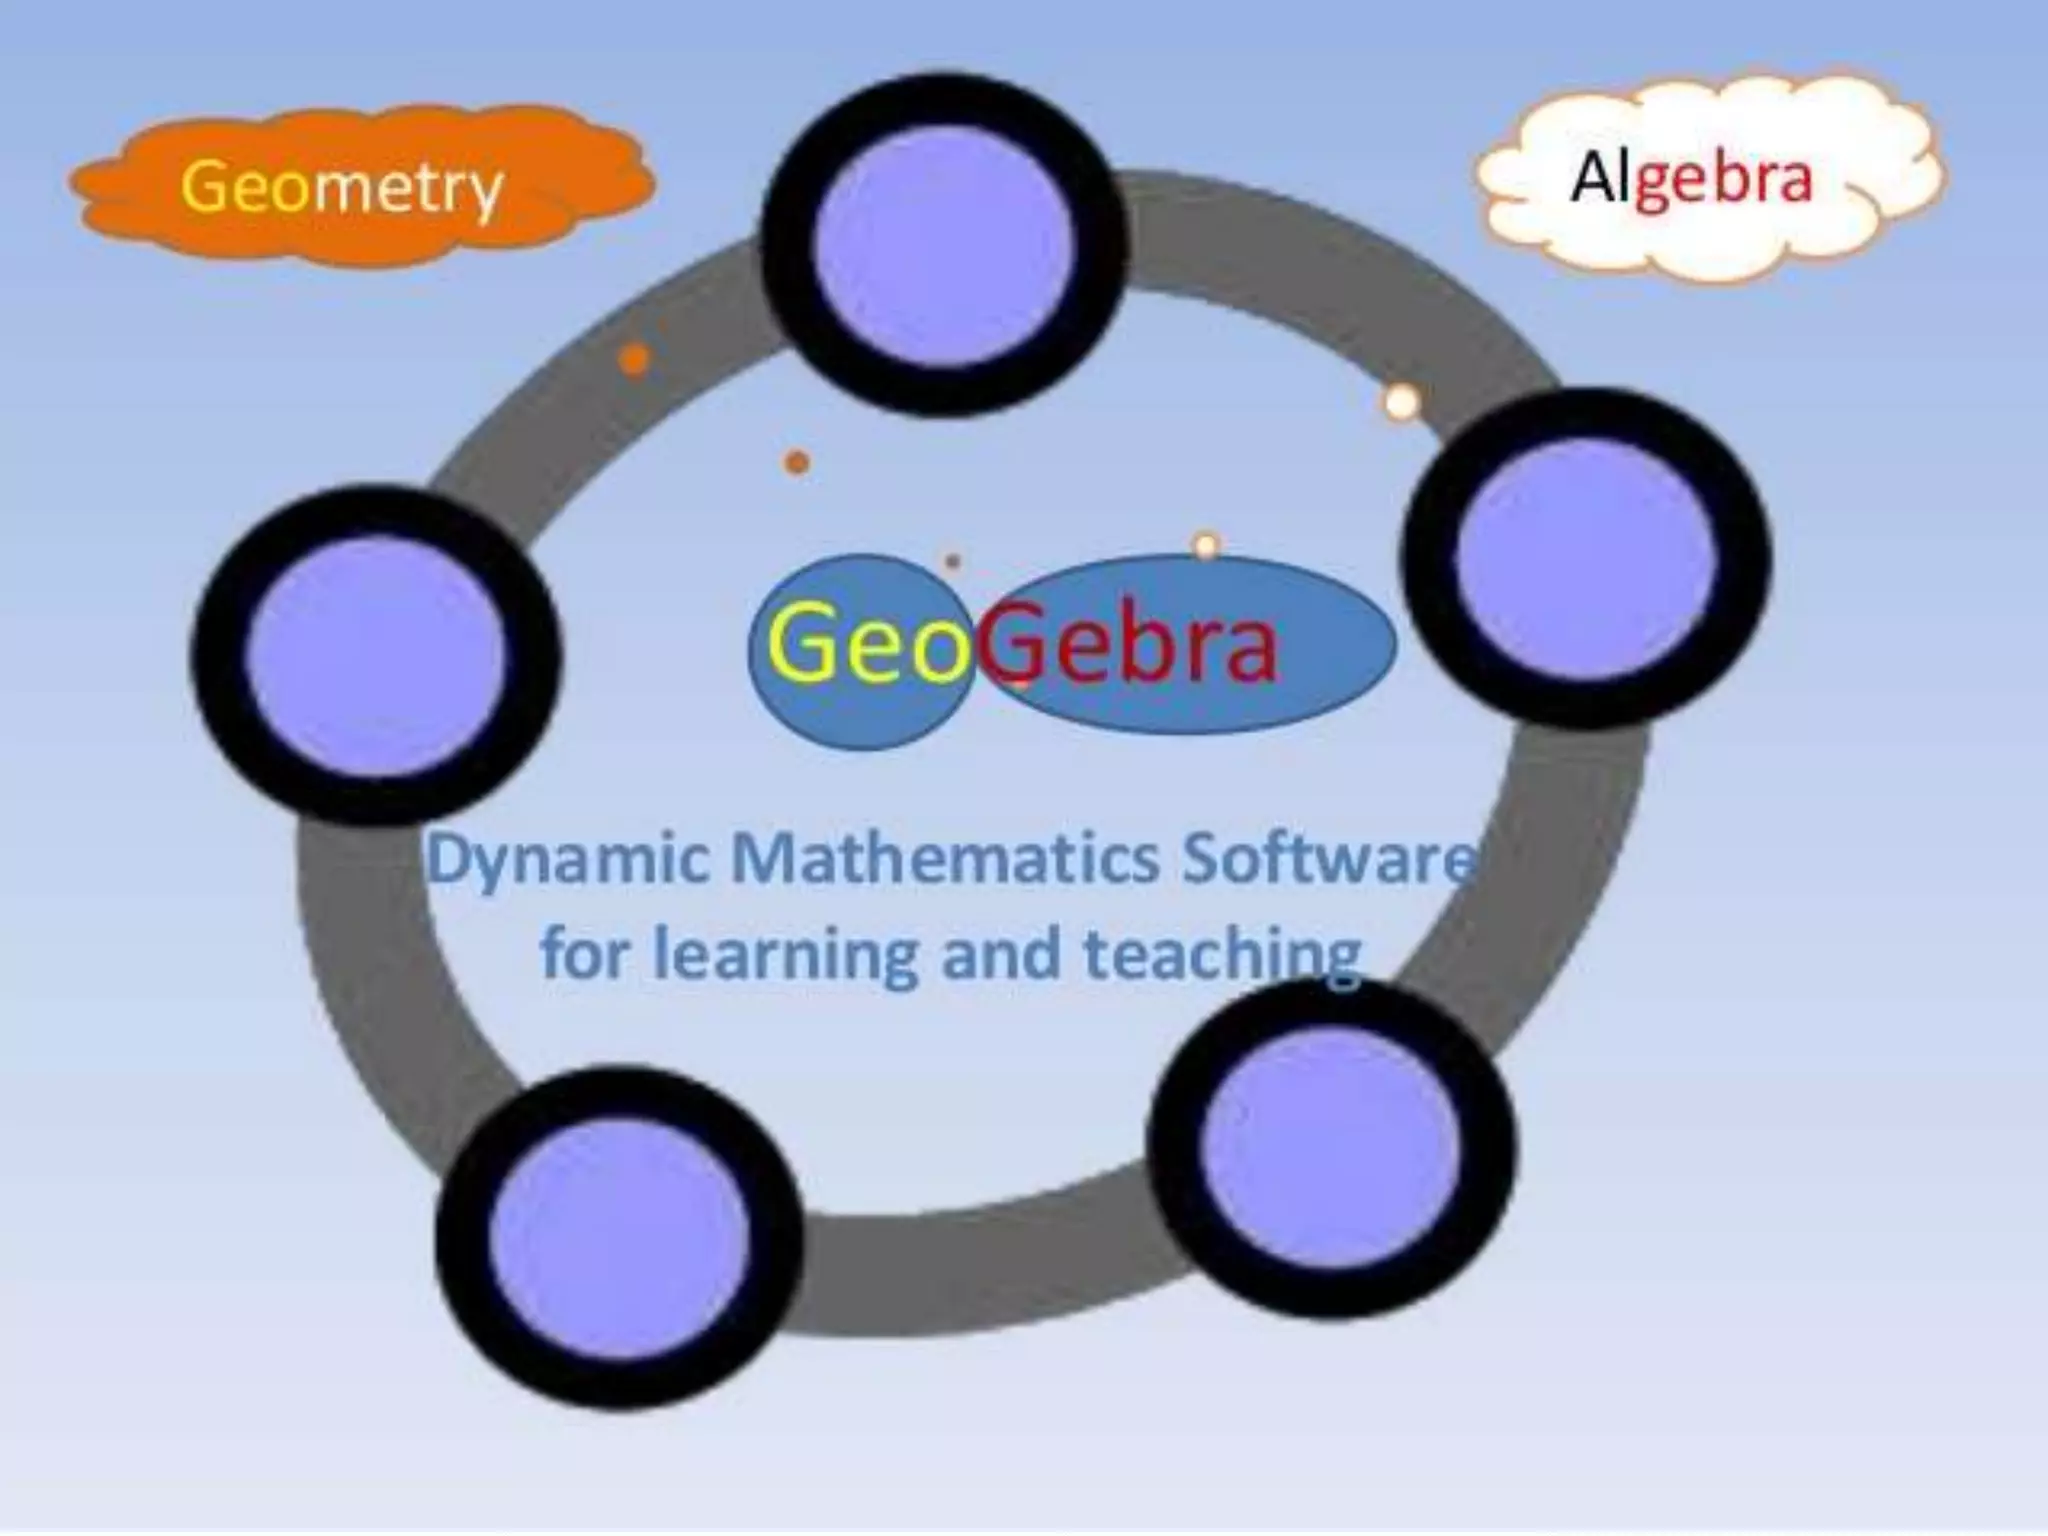
Geo Gebra
GeoGebrais open source dynamic mathematics software for learning and
teaching at all levels.
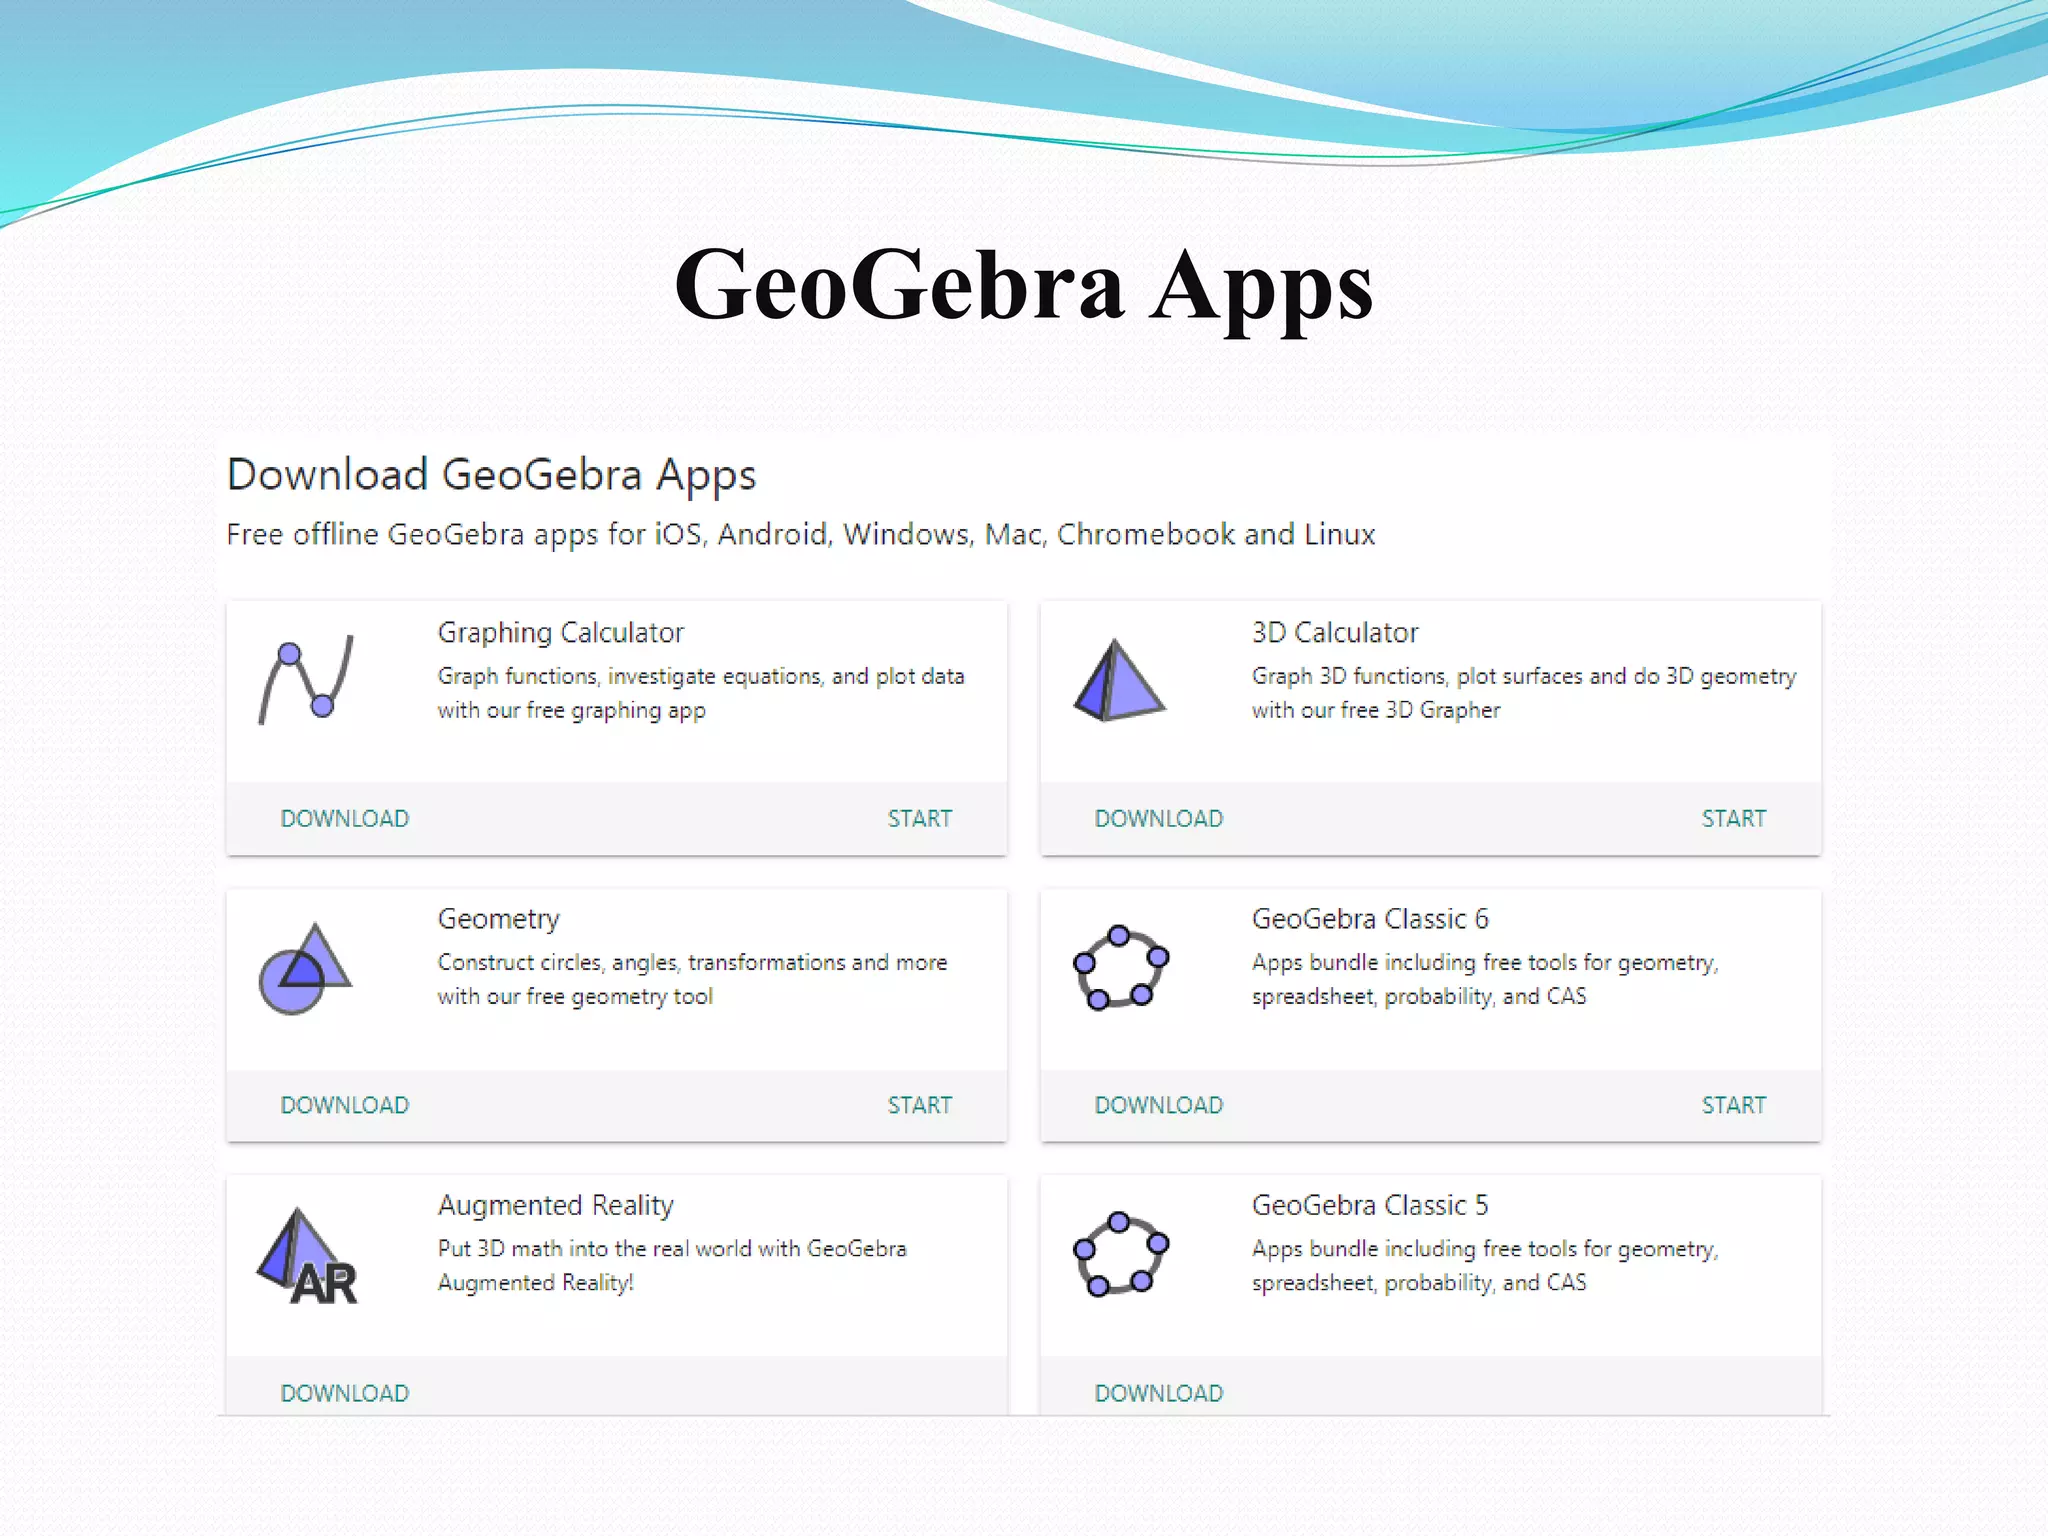
This manual covers the commands and tools of GeoGebra 5.0.
Depending on your hardware and preferences, you can currently choose
between GeoGebra 5.0 Desktop and the GeoGebra 5.0 Web and Tablet App,
which feature minor differences in terms of use and interface design.
65.
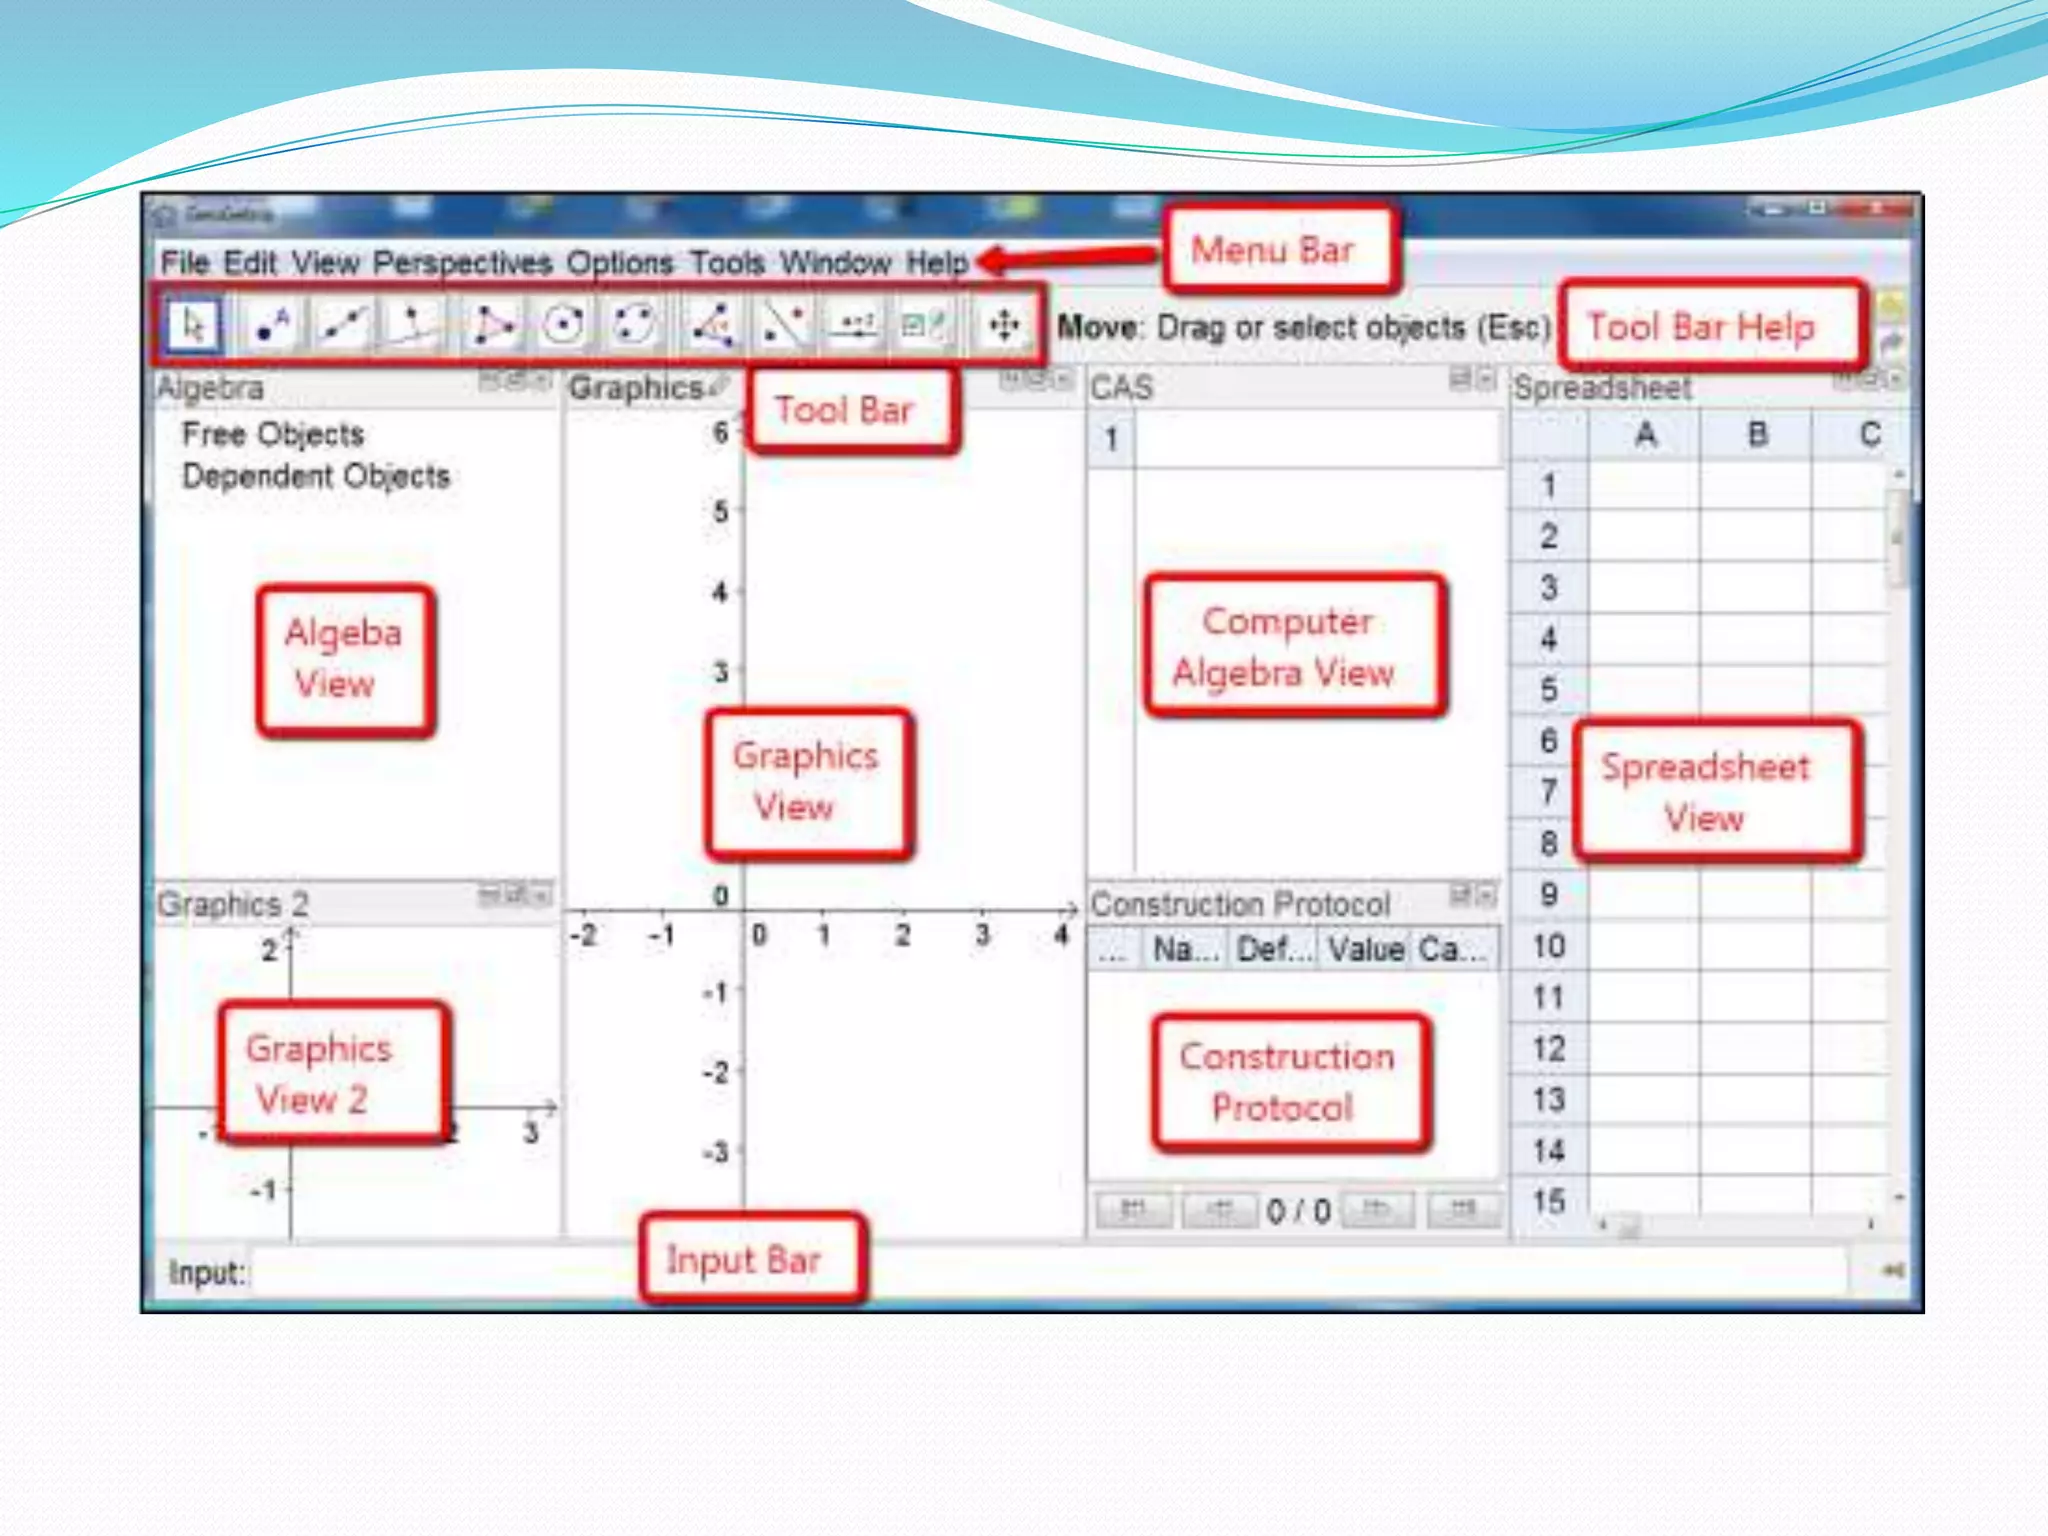
GeoGebra’s User Interface
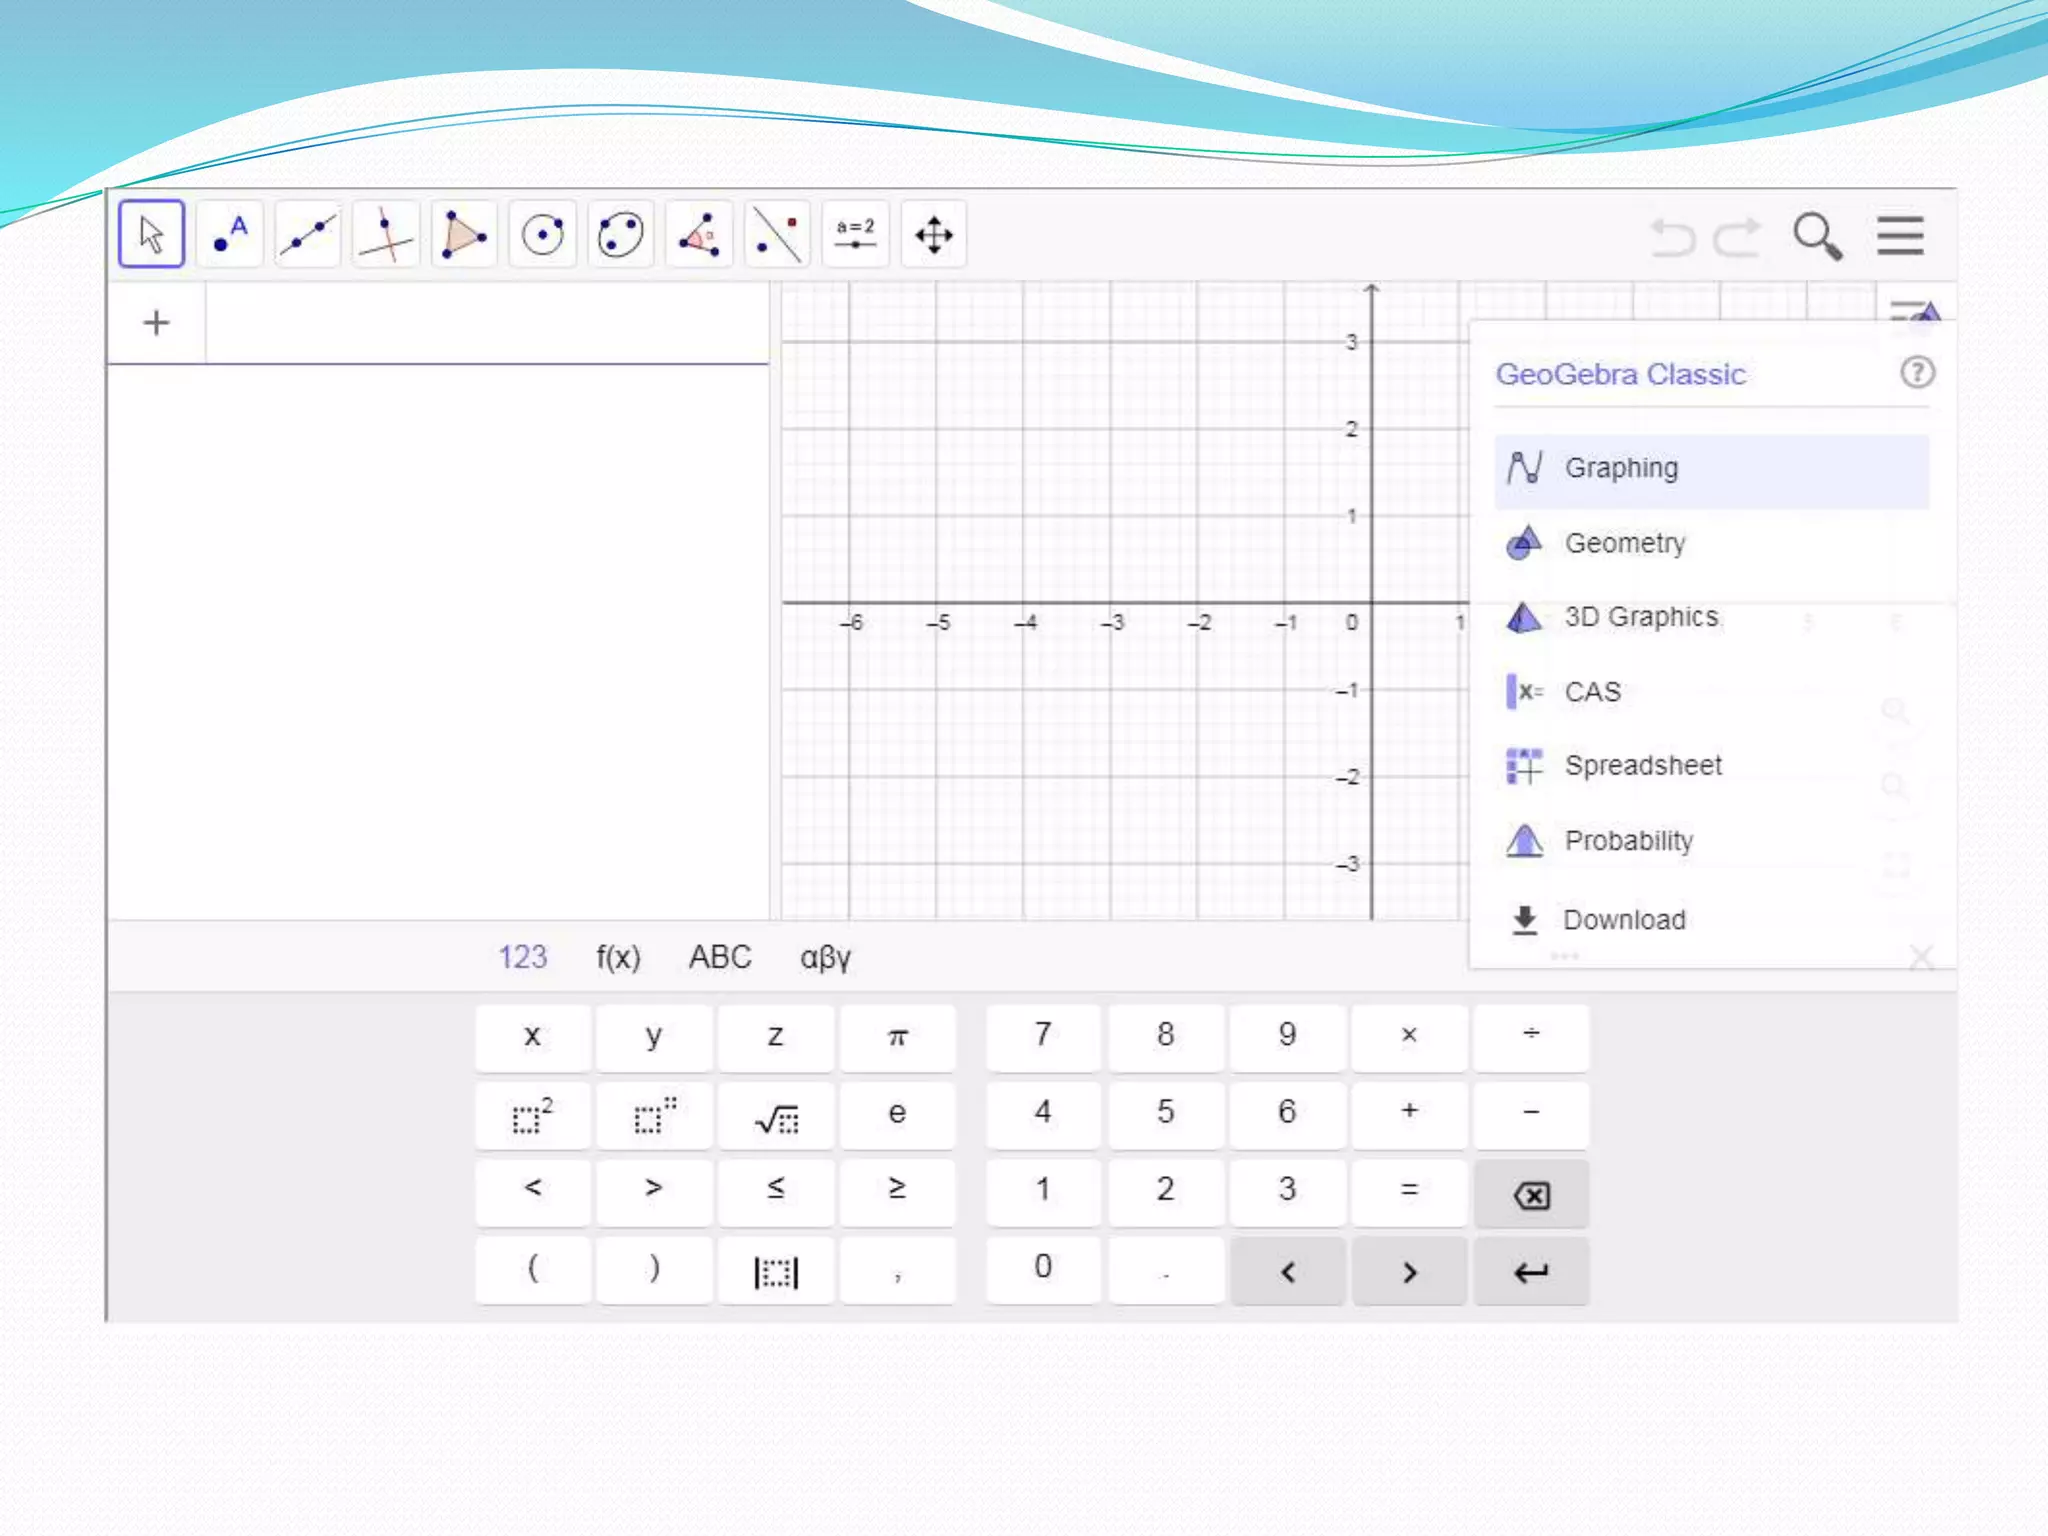
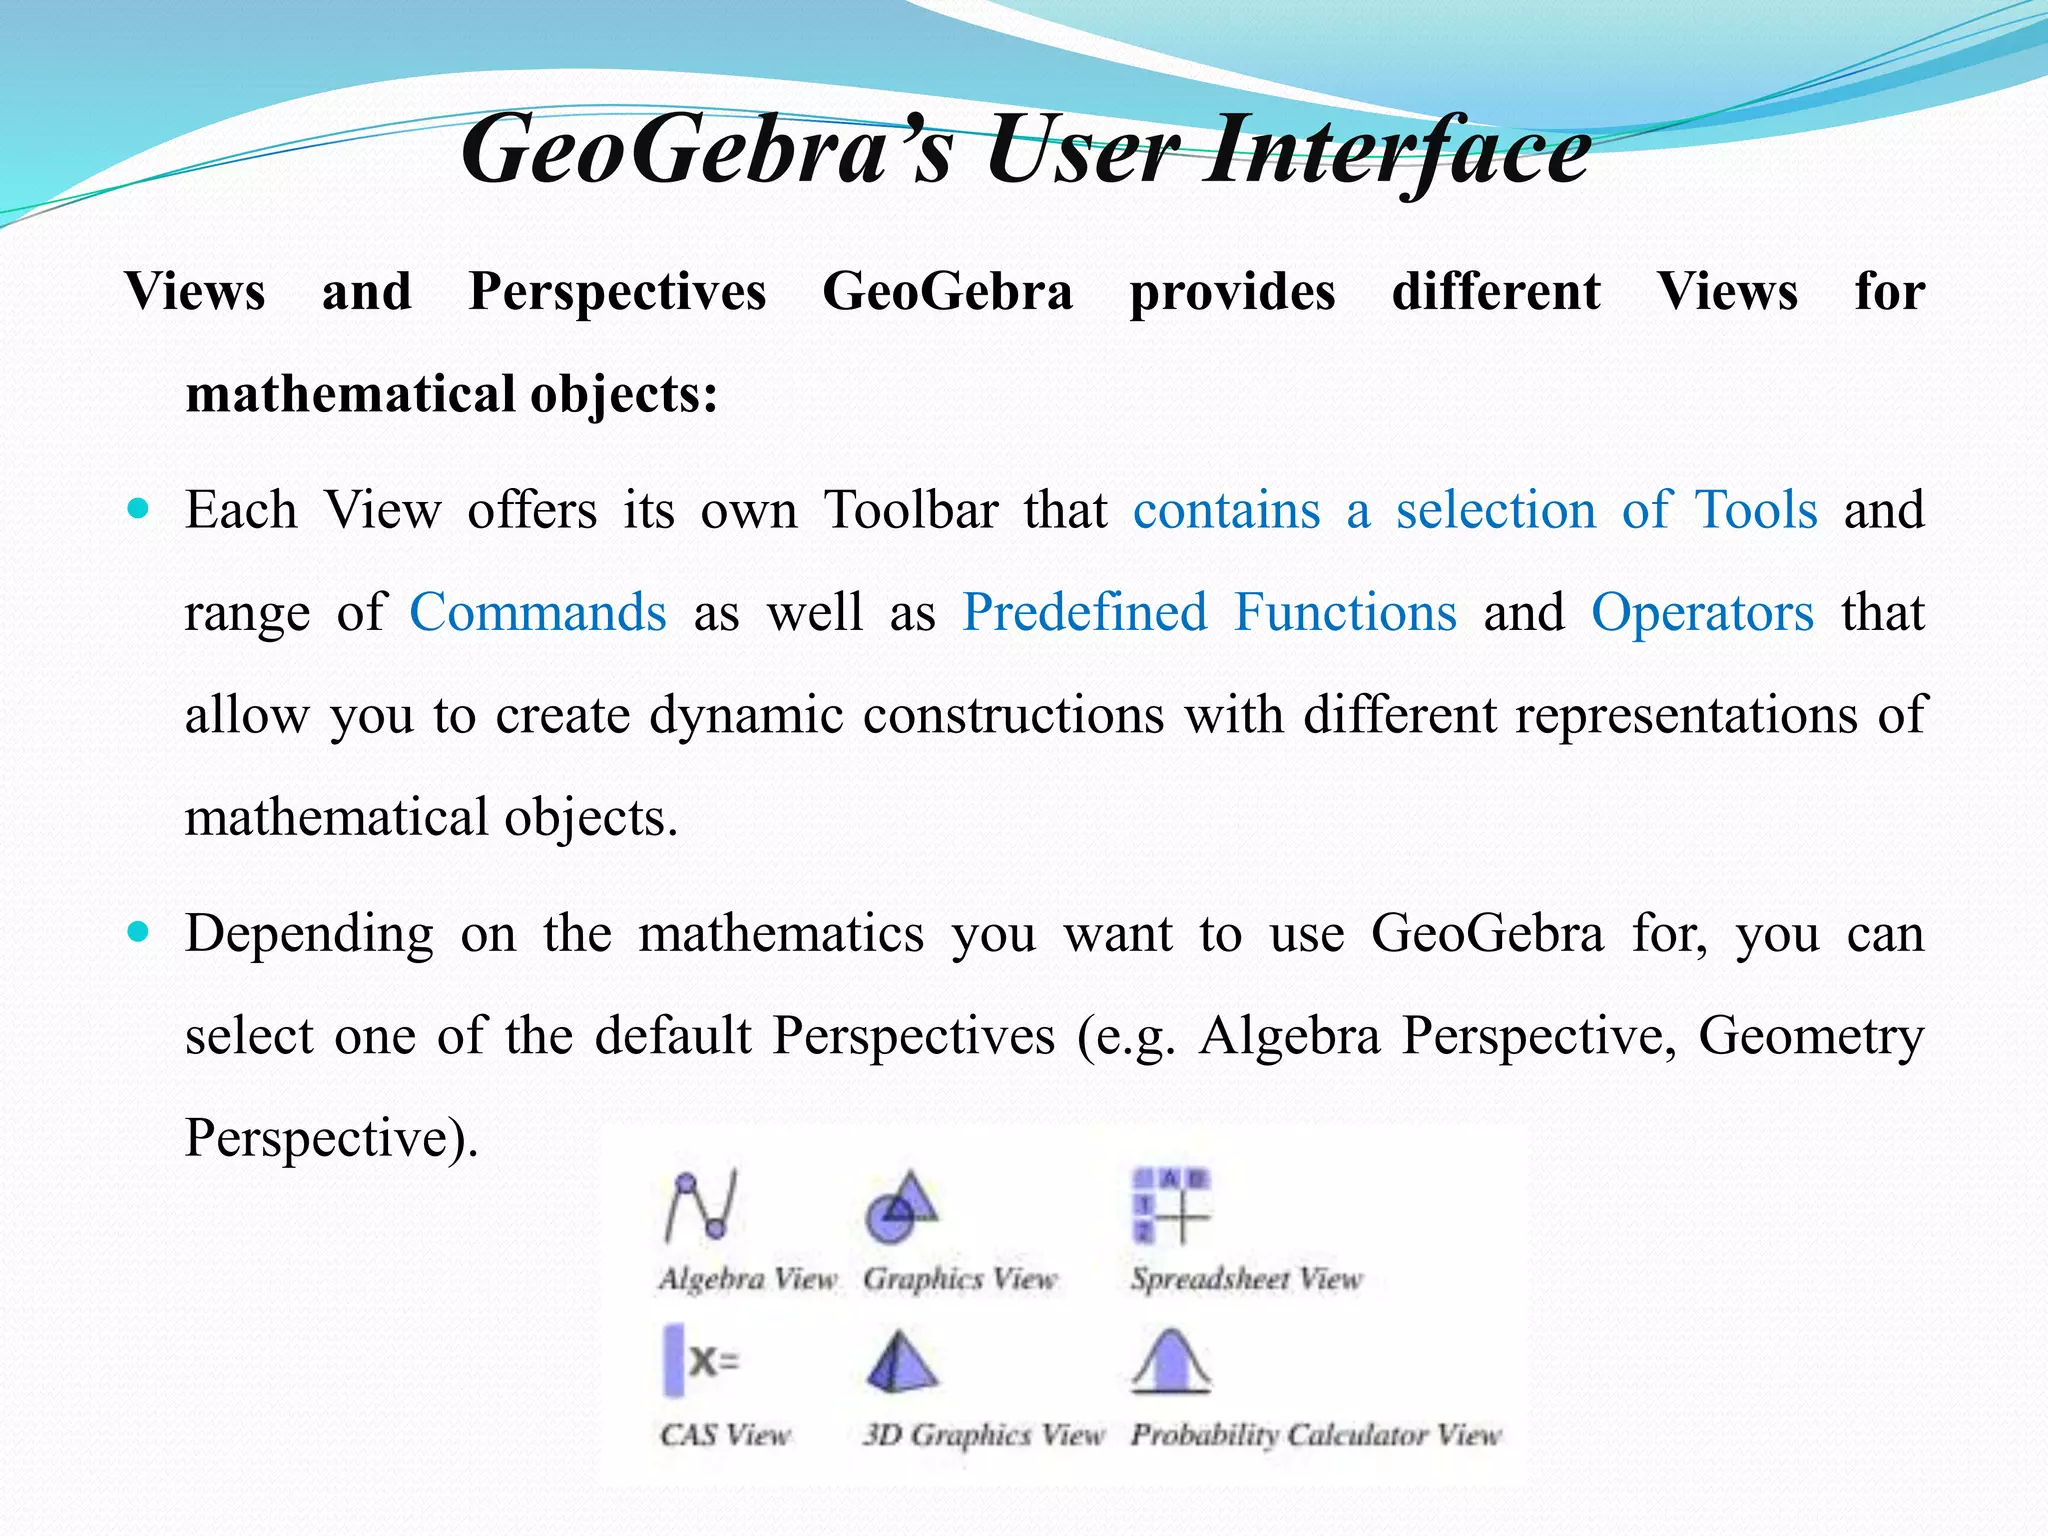
Viewsand Perspectives GeoGebra provides different Views for
mathematical objects:
Each View offers its own Toolbar that contains a selection of Tools and
range of Commands as well as Predefined Functions and Operators that
allow you to create dynamic constructions with different representations of
mathematical objects.
Depending on the mathematics you want to use GeoGebra for, you can
select one of the default Perspectives (e.g. Algebra Perspective, Geometry
Perspective).
67.
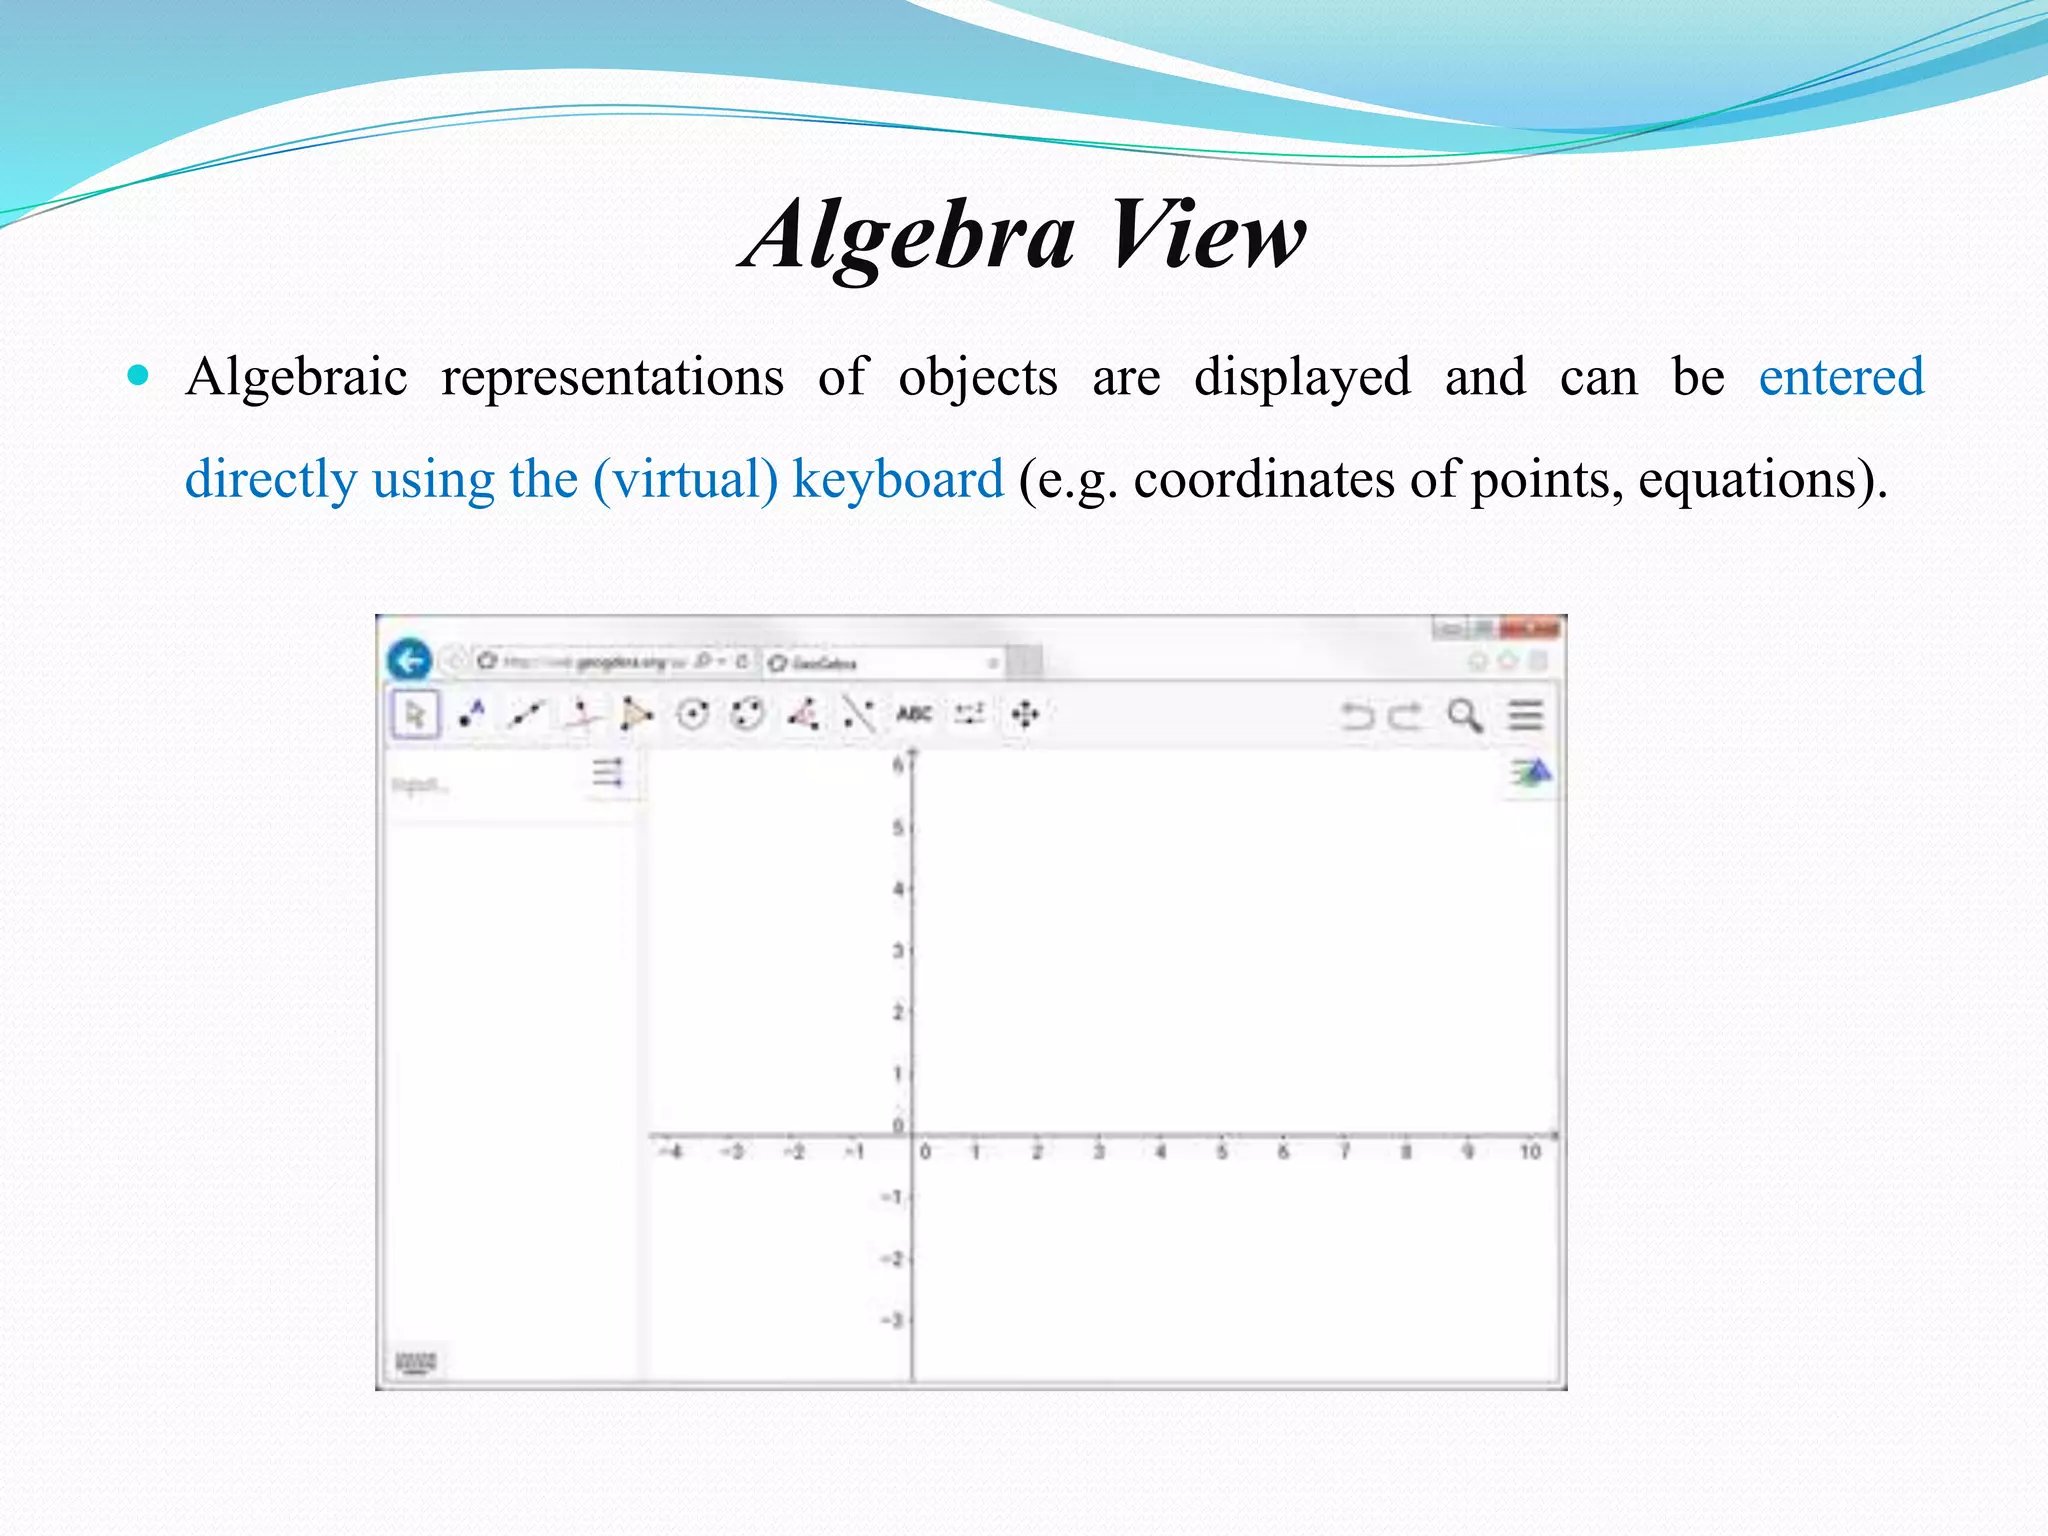
Algebra View
Algebraicrepresentations of objects are displayed and can be entered
directly using the (virtual) keyboard (e.g. coordinates of points, equations).
68.
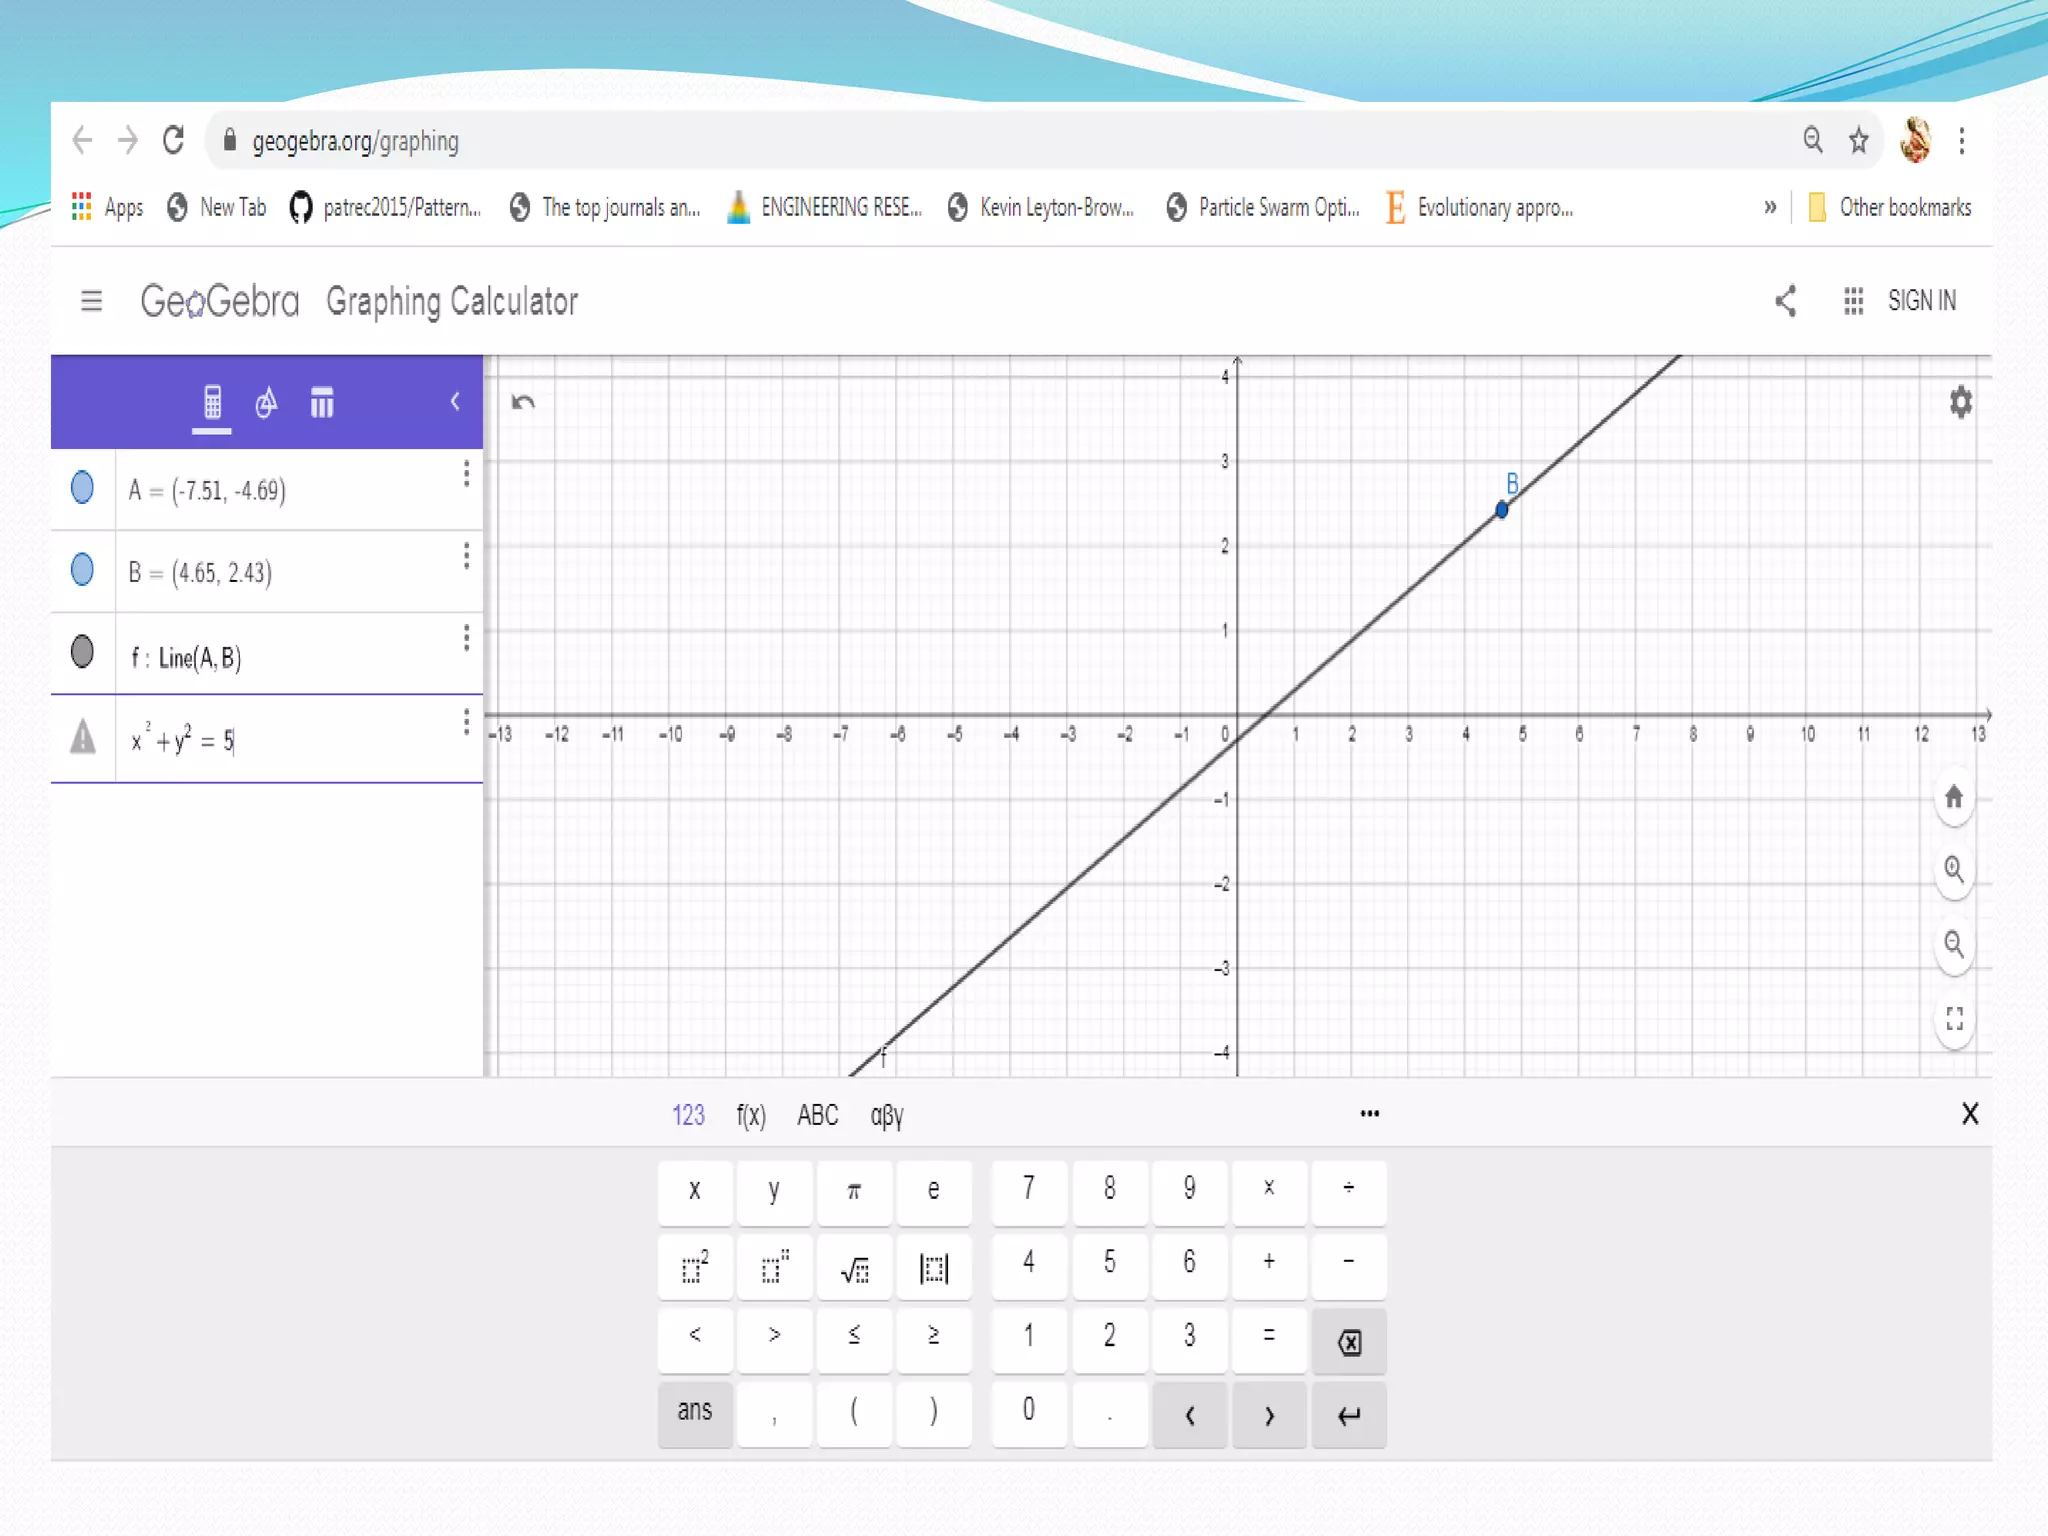
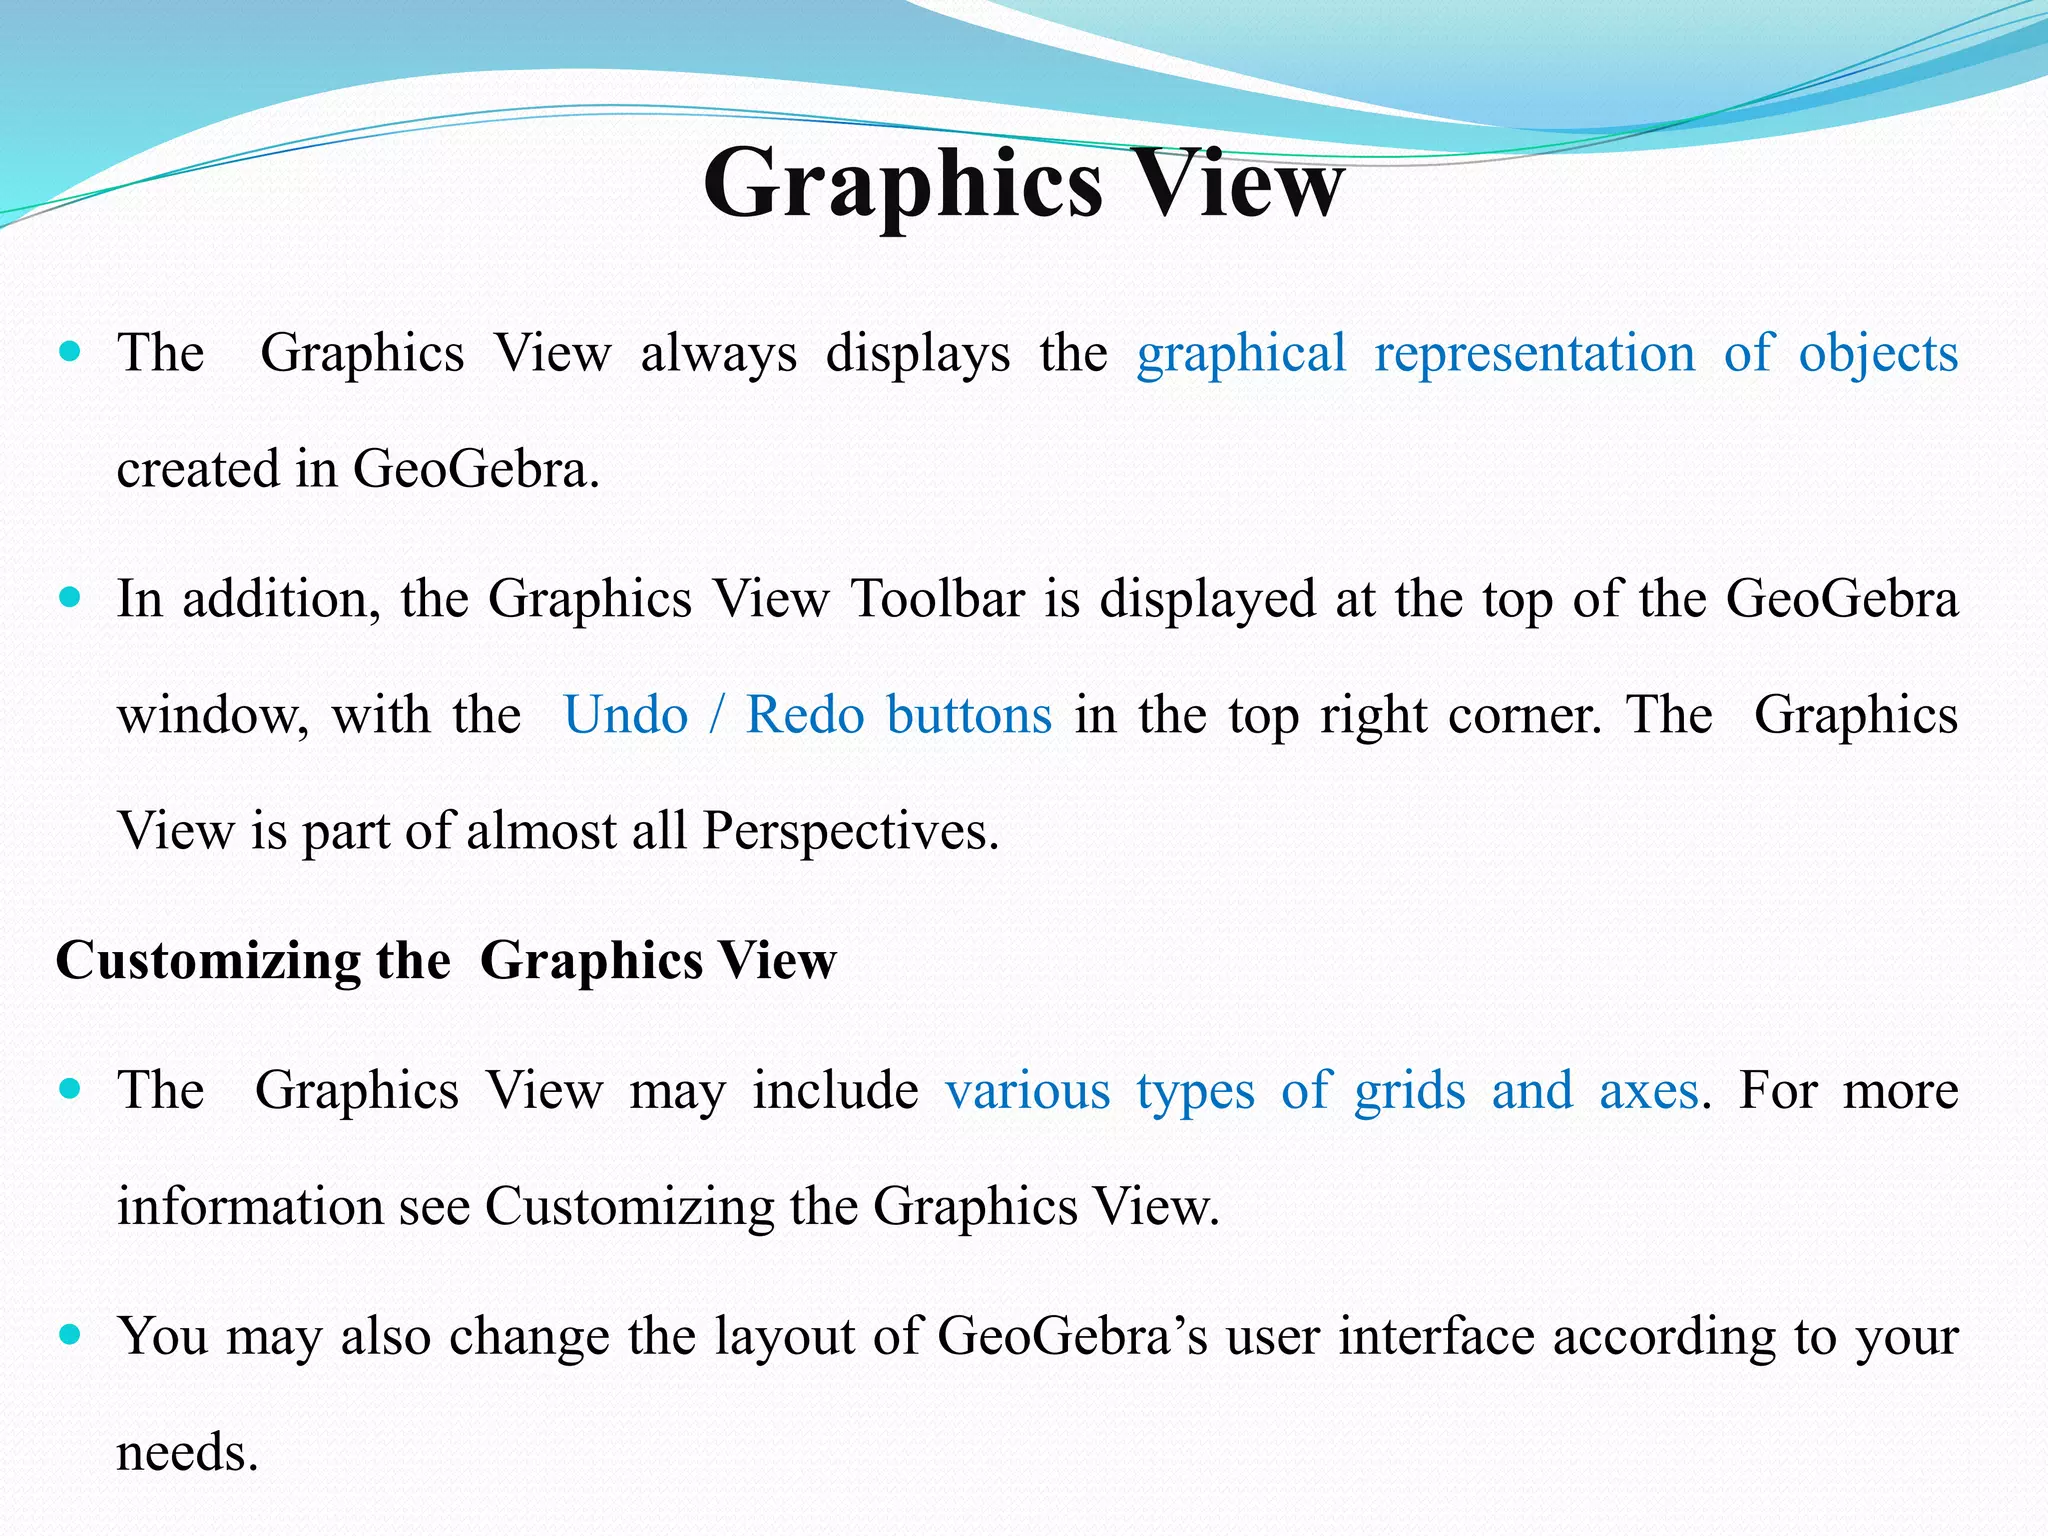
Graphics View
TheGraphics View always displays the graphical representation of objects
created in GeoGebra.
In addition, the Graphics View Toolbar is displayed at the top of the GeoGebra
window, with the Undo / Redo buttons in the top right corner. The Graphics
View is part of almost all Perspectives.
Customizing the Graphics View
The Graphics View may include various types of grids and axes. For more
information see Customizing the Graphics View.
You may also change the layout of GeoGebra’s user interface according to your
needs.
69.
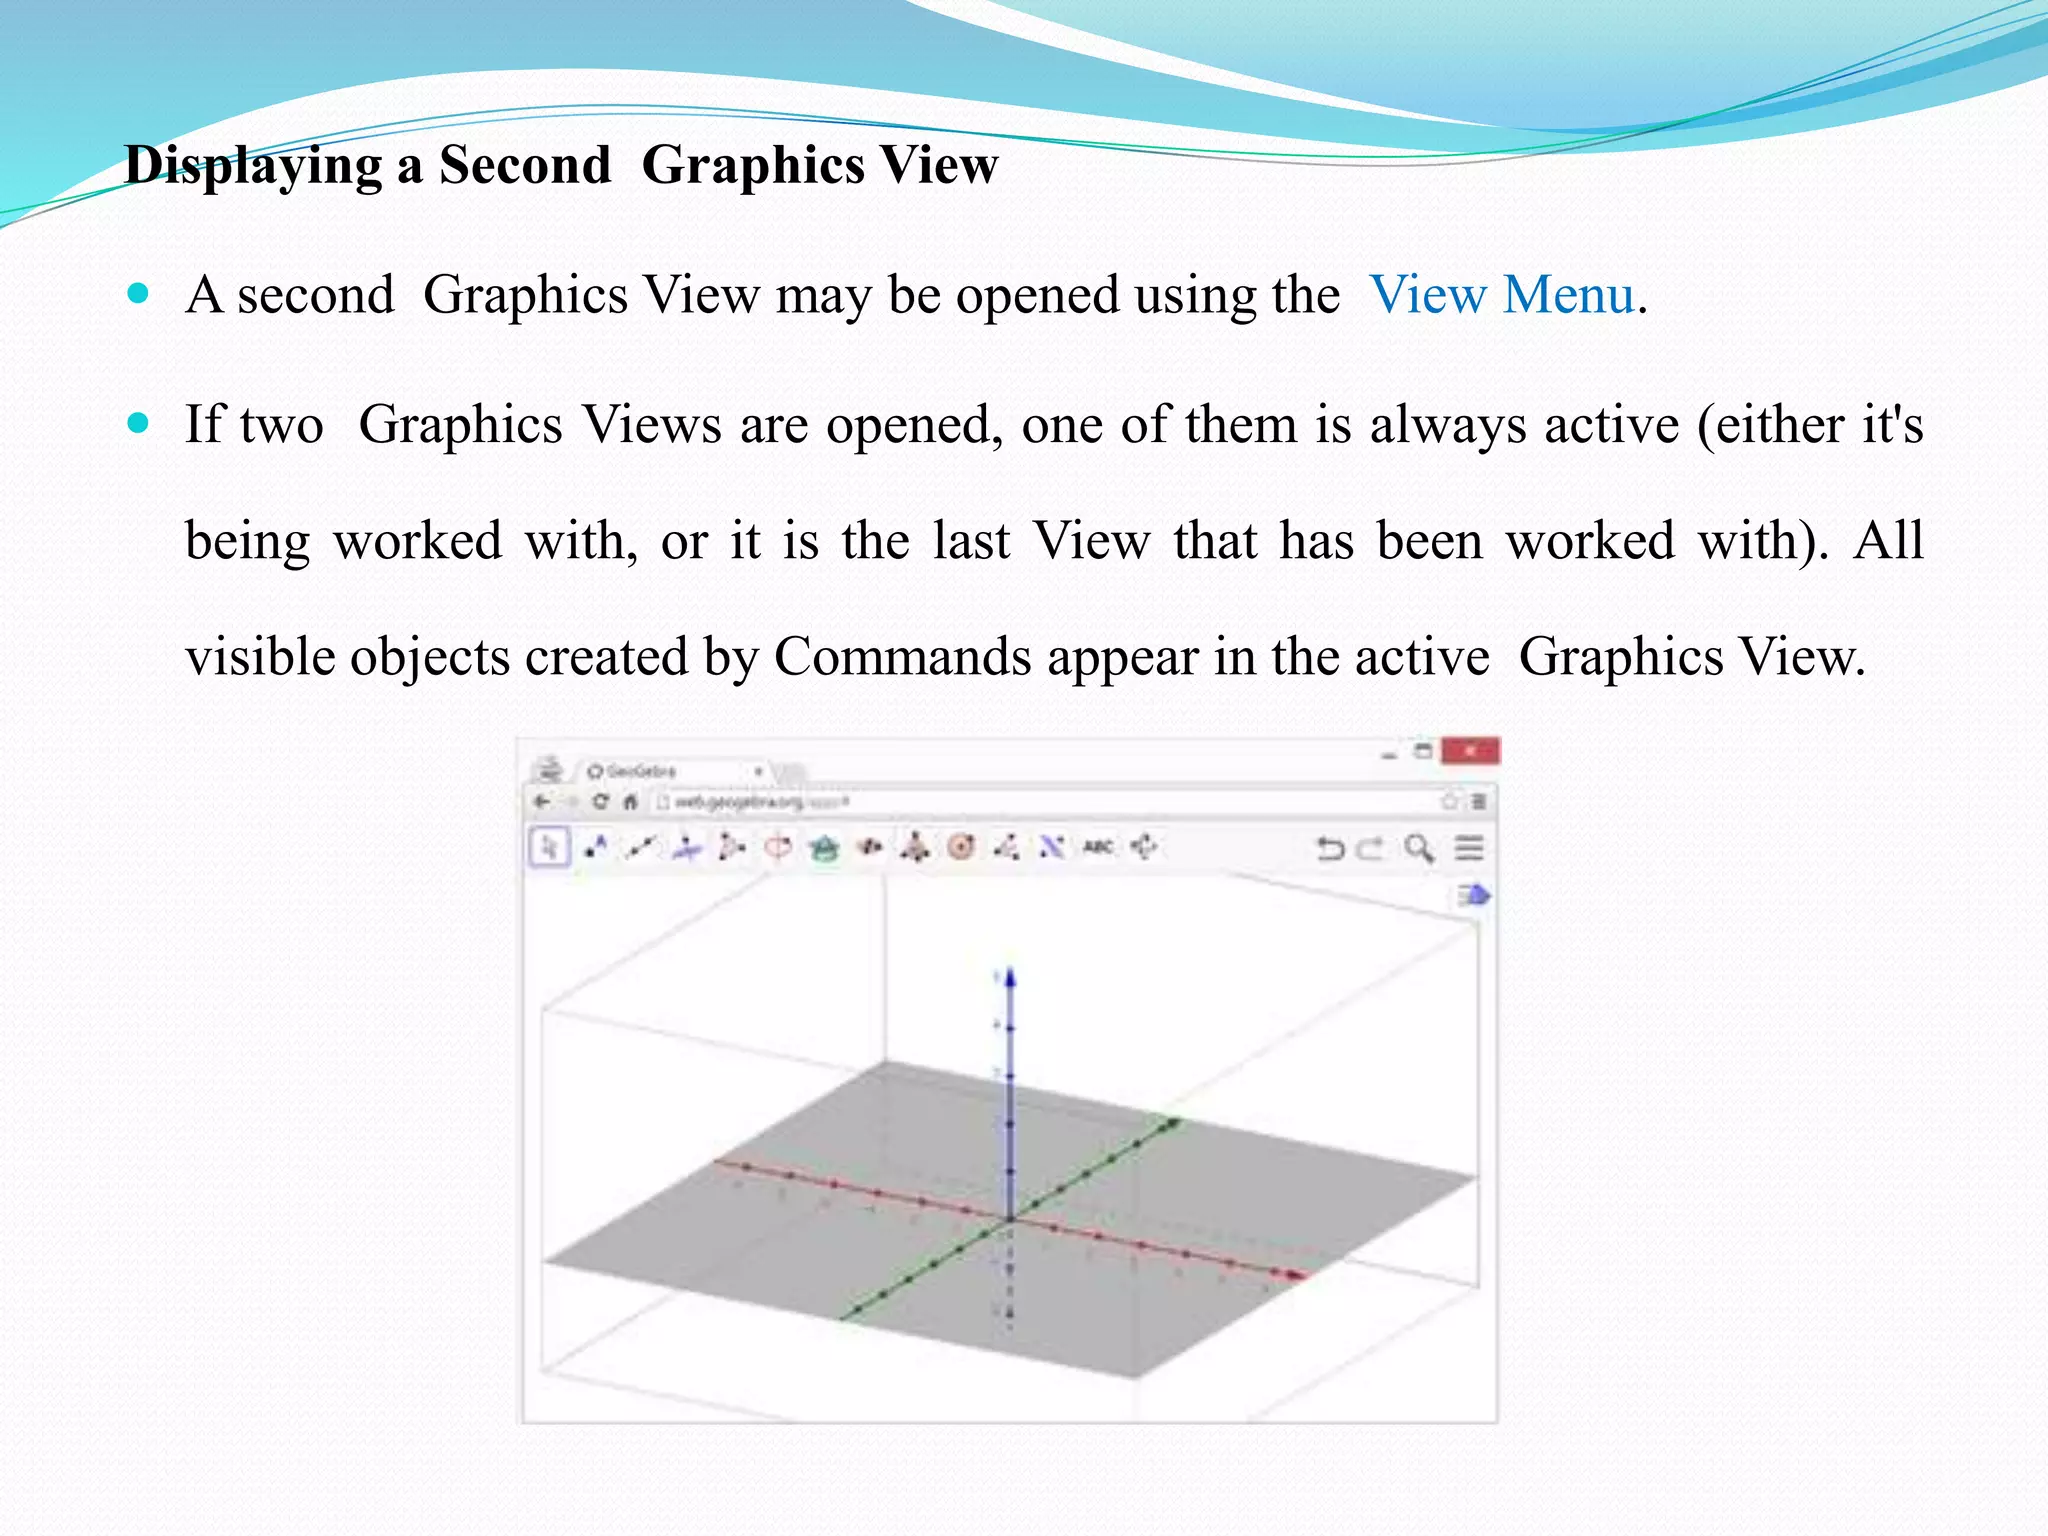
Displaying a SecondGraphics View
A second Graphics View may be opened using the View Menu.
If two Graphics Views are opened, one of them is always active (either it's
being worked with, or it is the last View that has been worked with). All
visible objects created by Commands appear in the active Graphics View.
70.
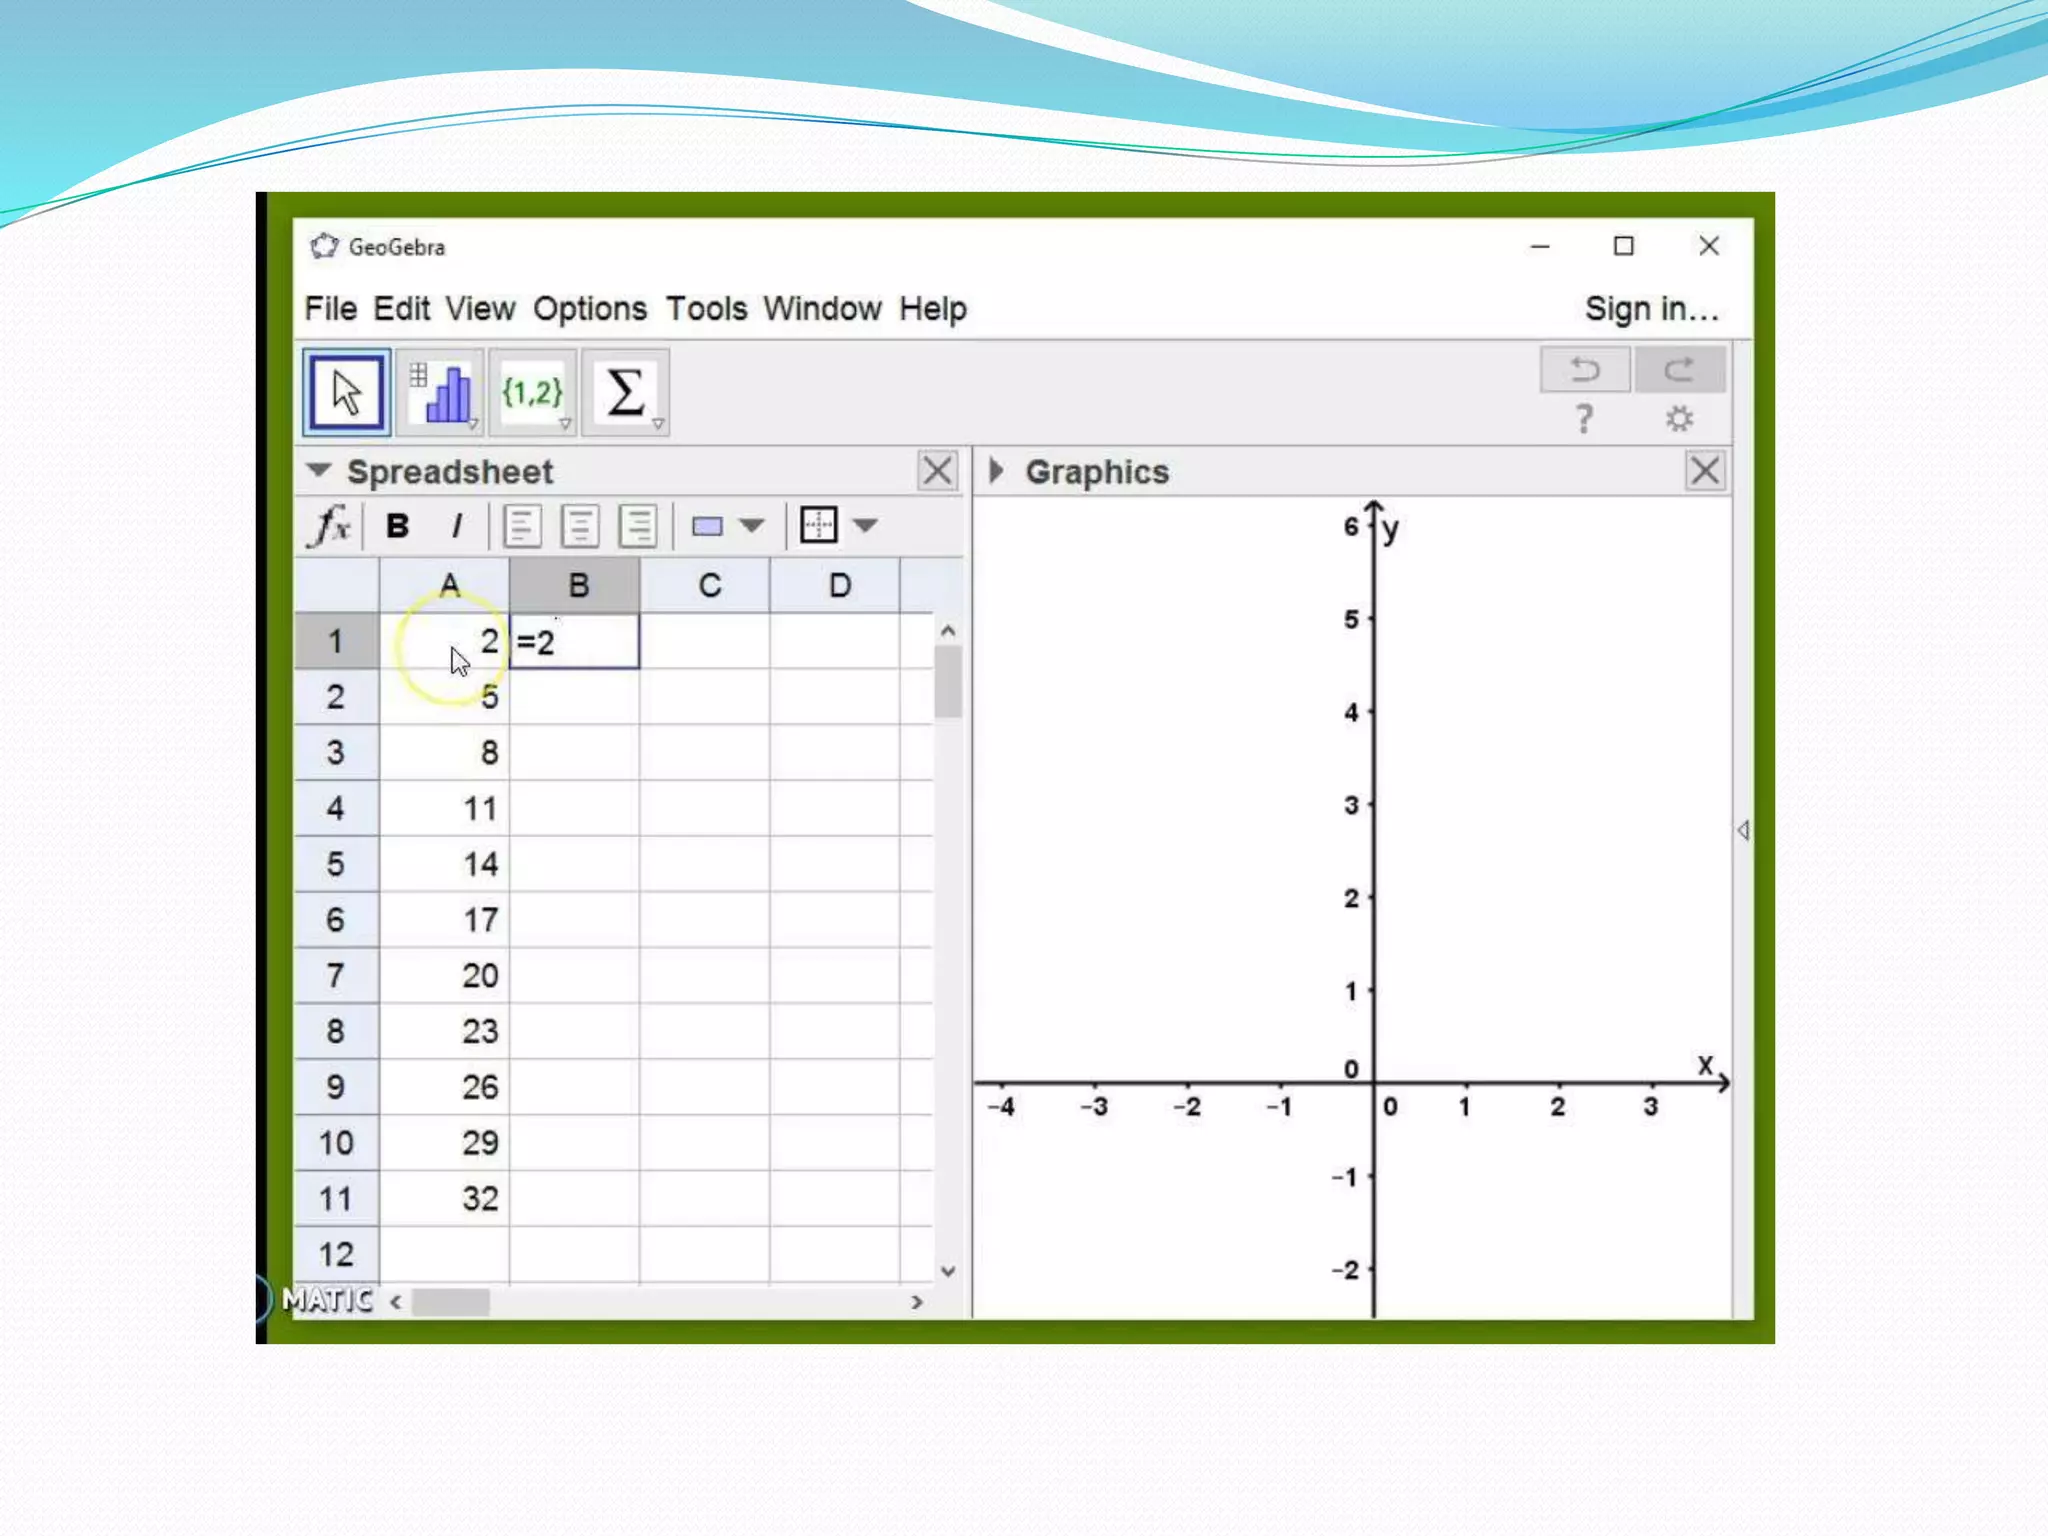
Spreadsheet View UserInterface
To open the spreadsheets view you can either choose View -->
Spreadsheet or press Ctrl + Shift + S.
By highlighting two different numbers and dragging down the black
cross at the bottom right corner, the arithmetic sequence will
automatically be continued.
By selecting numbers in two columns, right-clicking and creating a new
list of points, the points will automatically appear in the graphics view
window.
72.
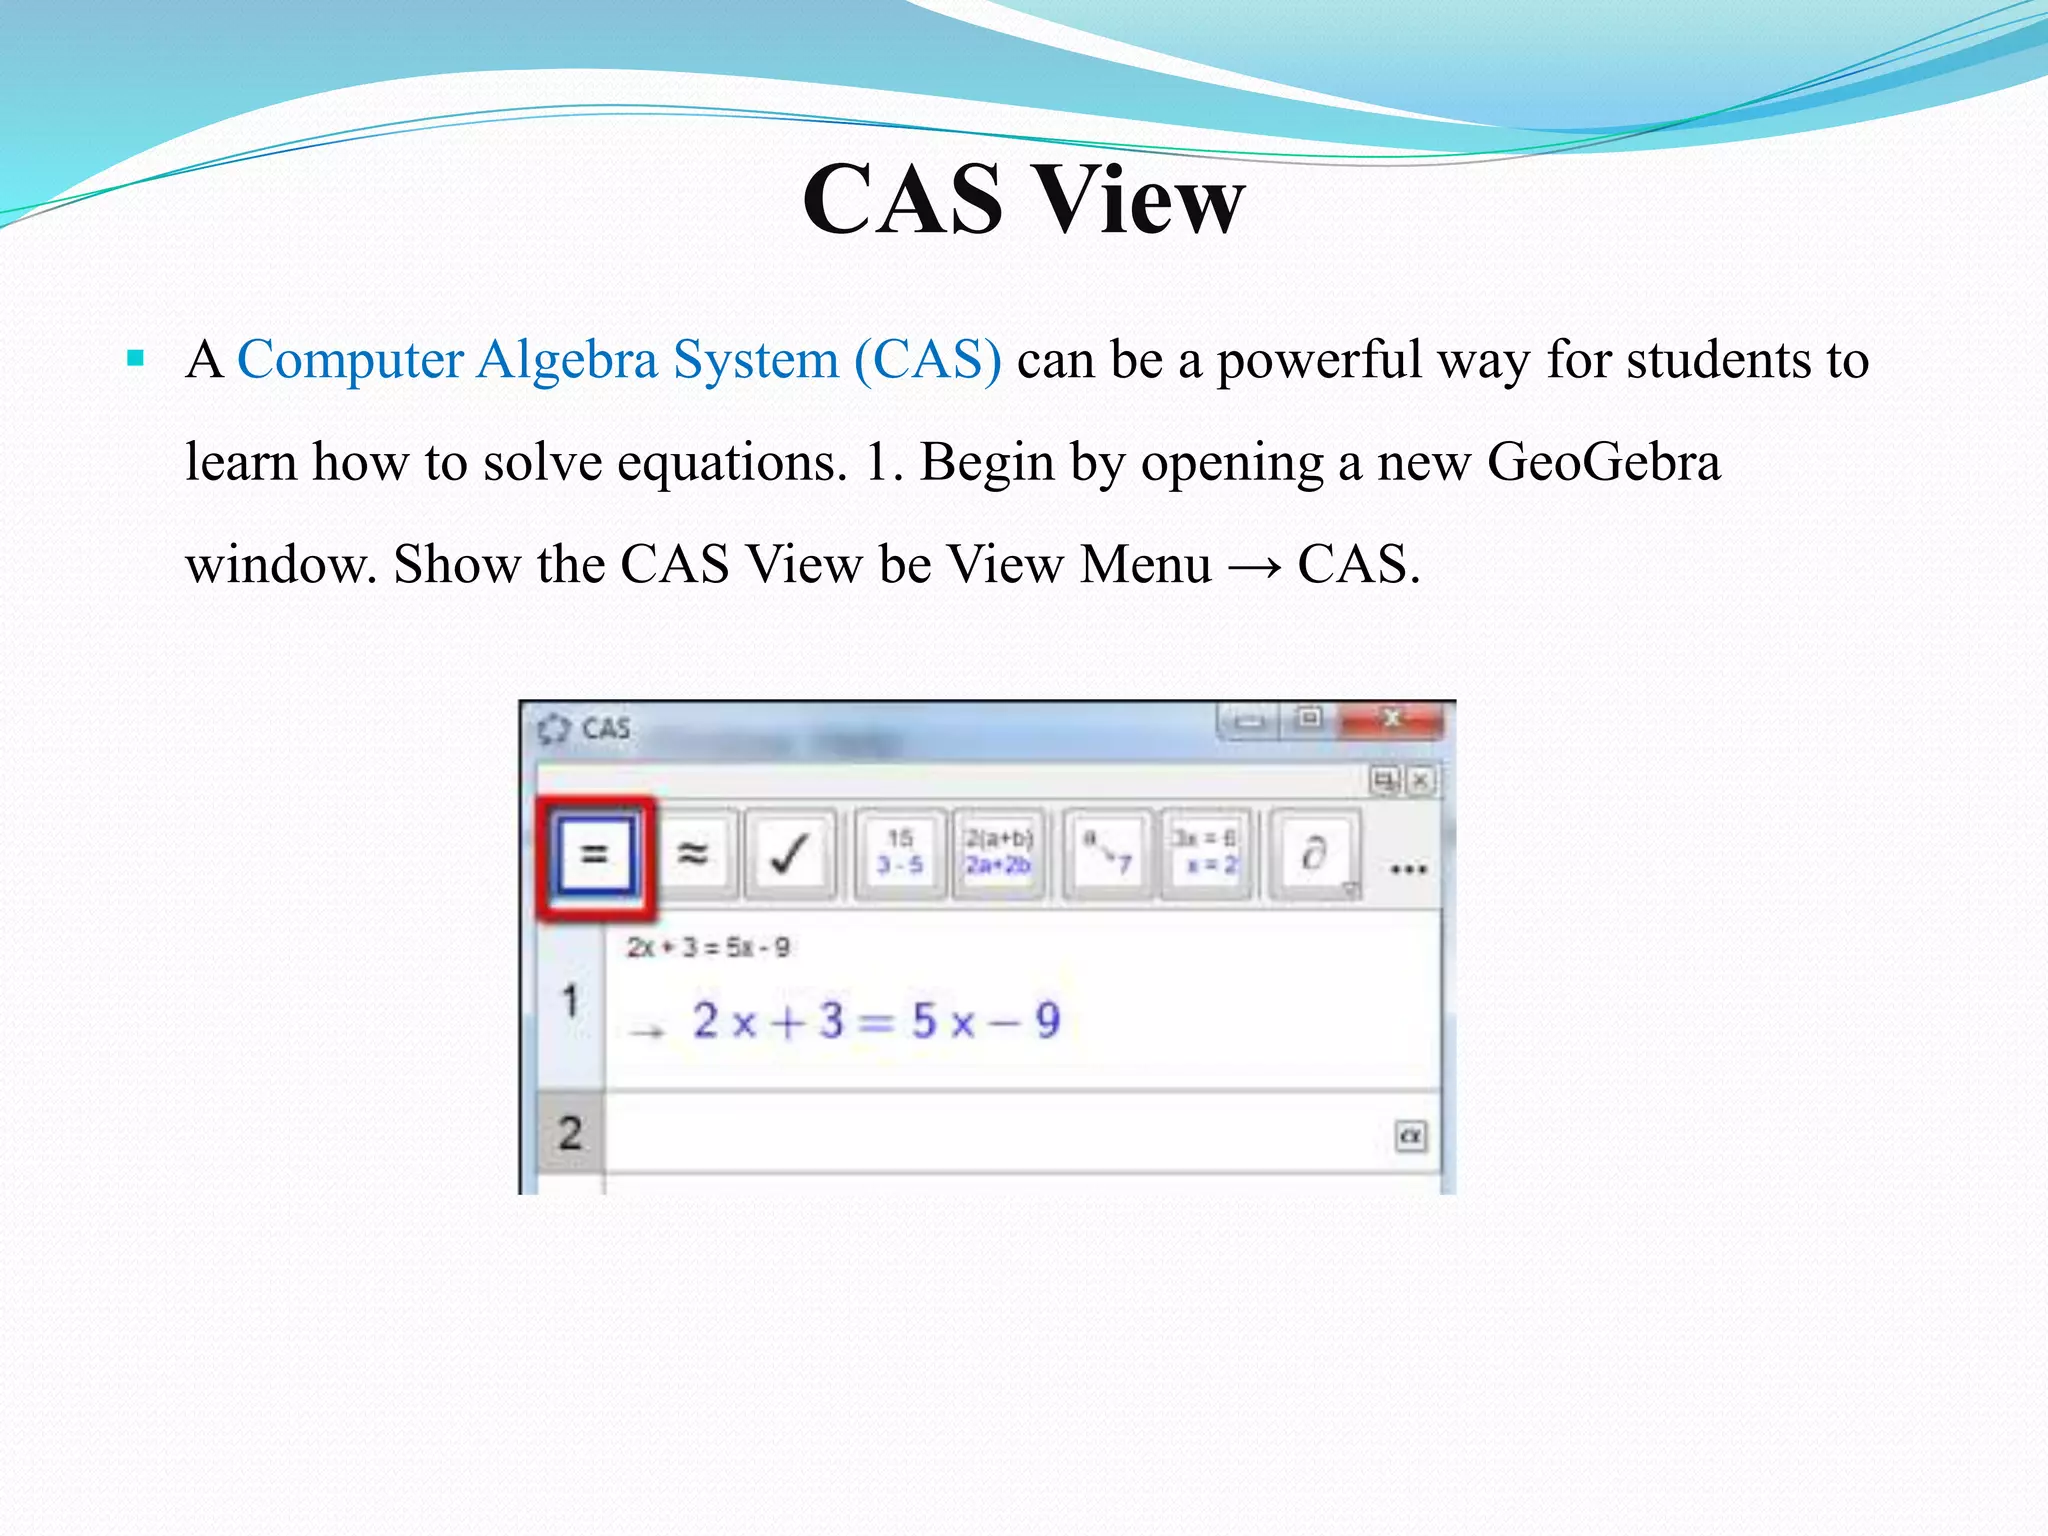
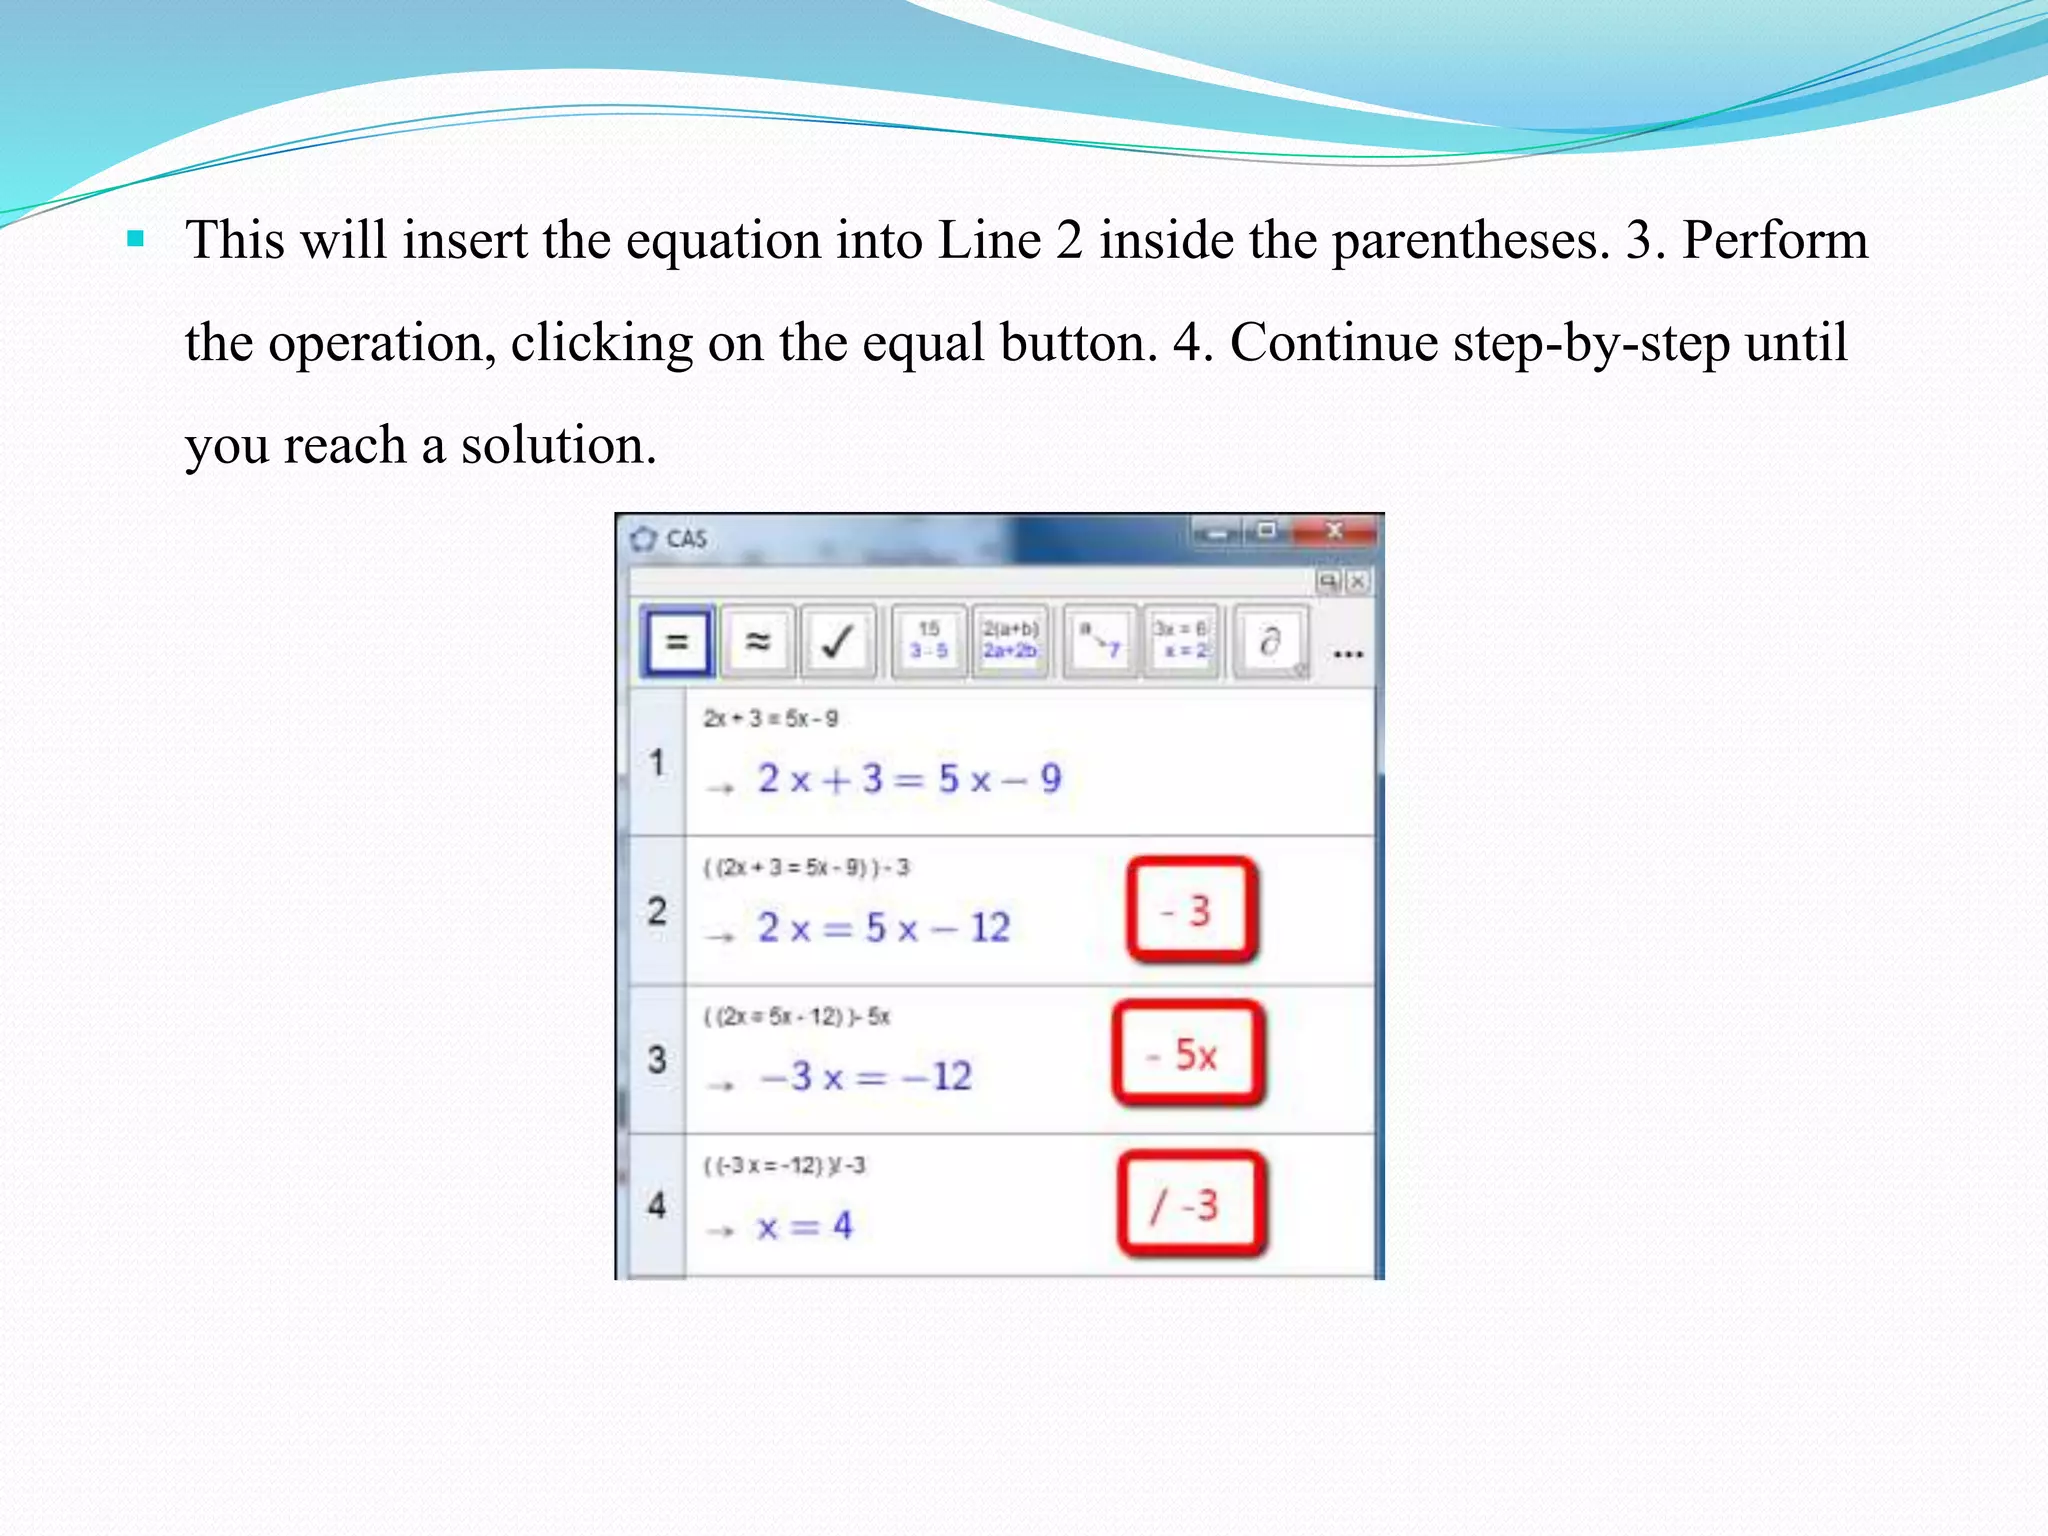
CAS View
AComputer Algebra System (CAS) can be a powerful way for students to
learn how to solve equations. 1. Begin by opening a new GeoGebra
window. Show the CAS View be View Menu → CAS.
73.
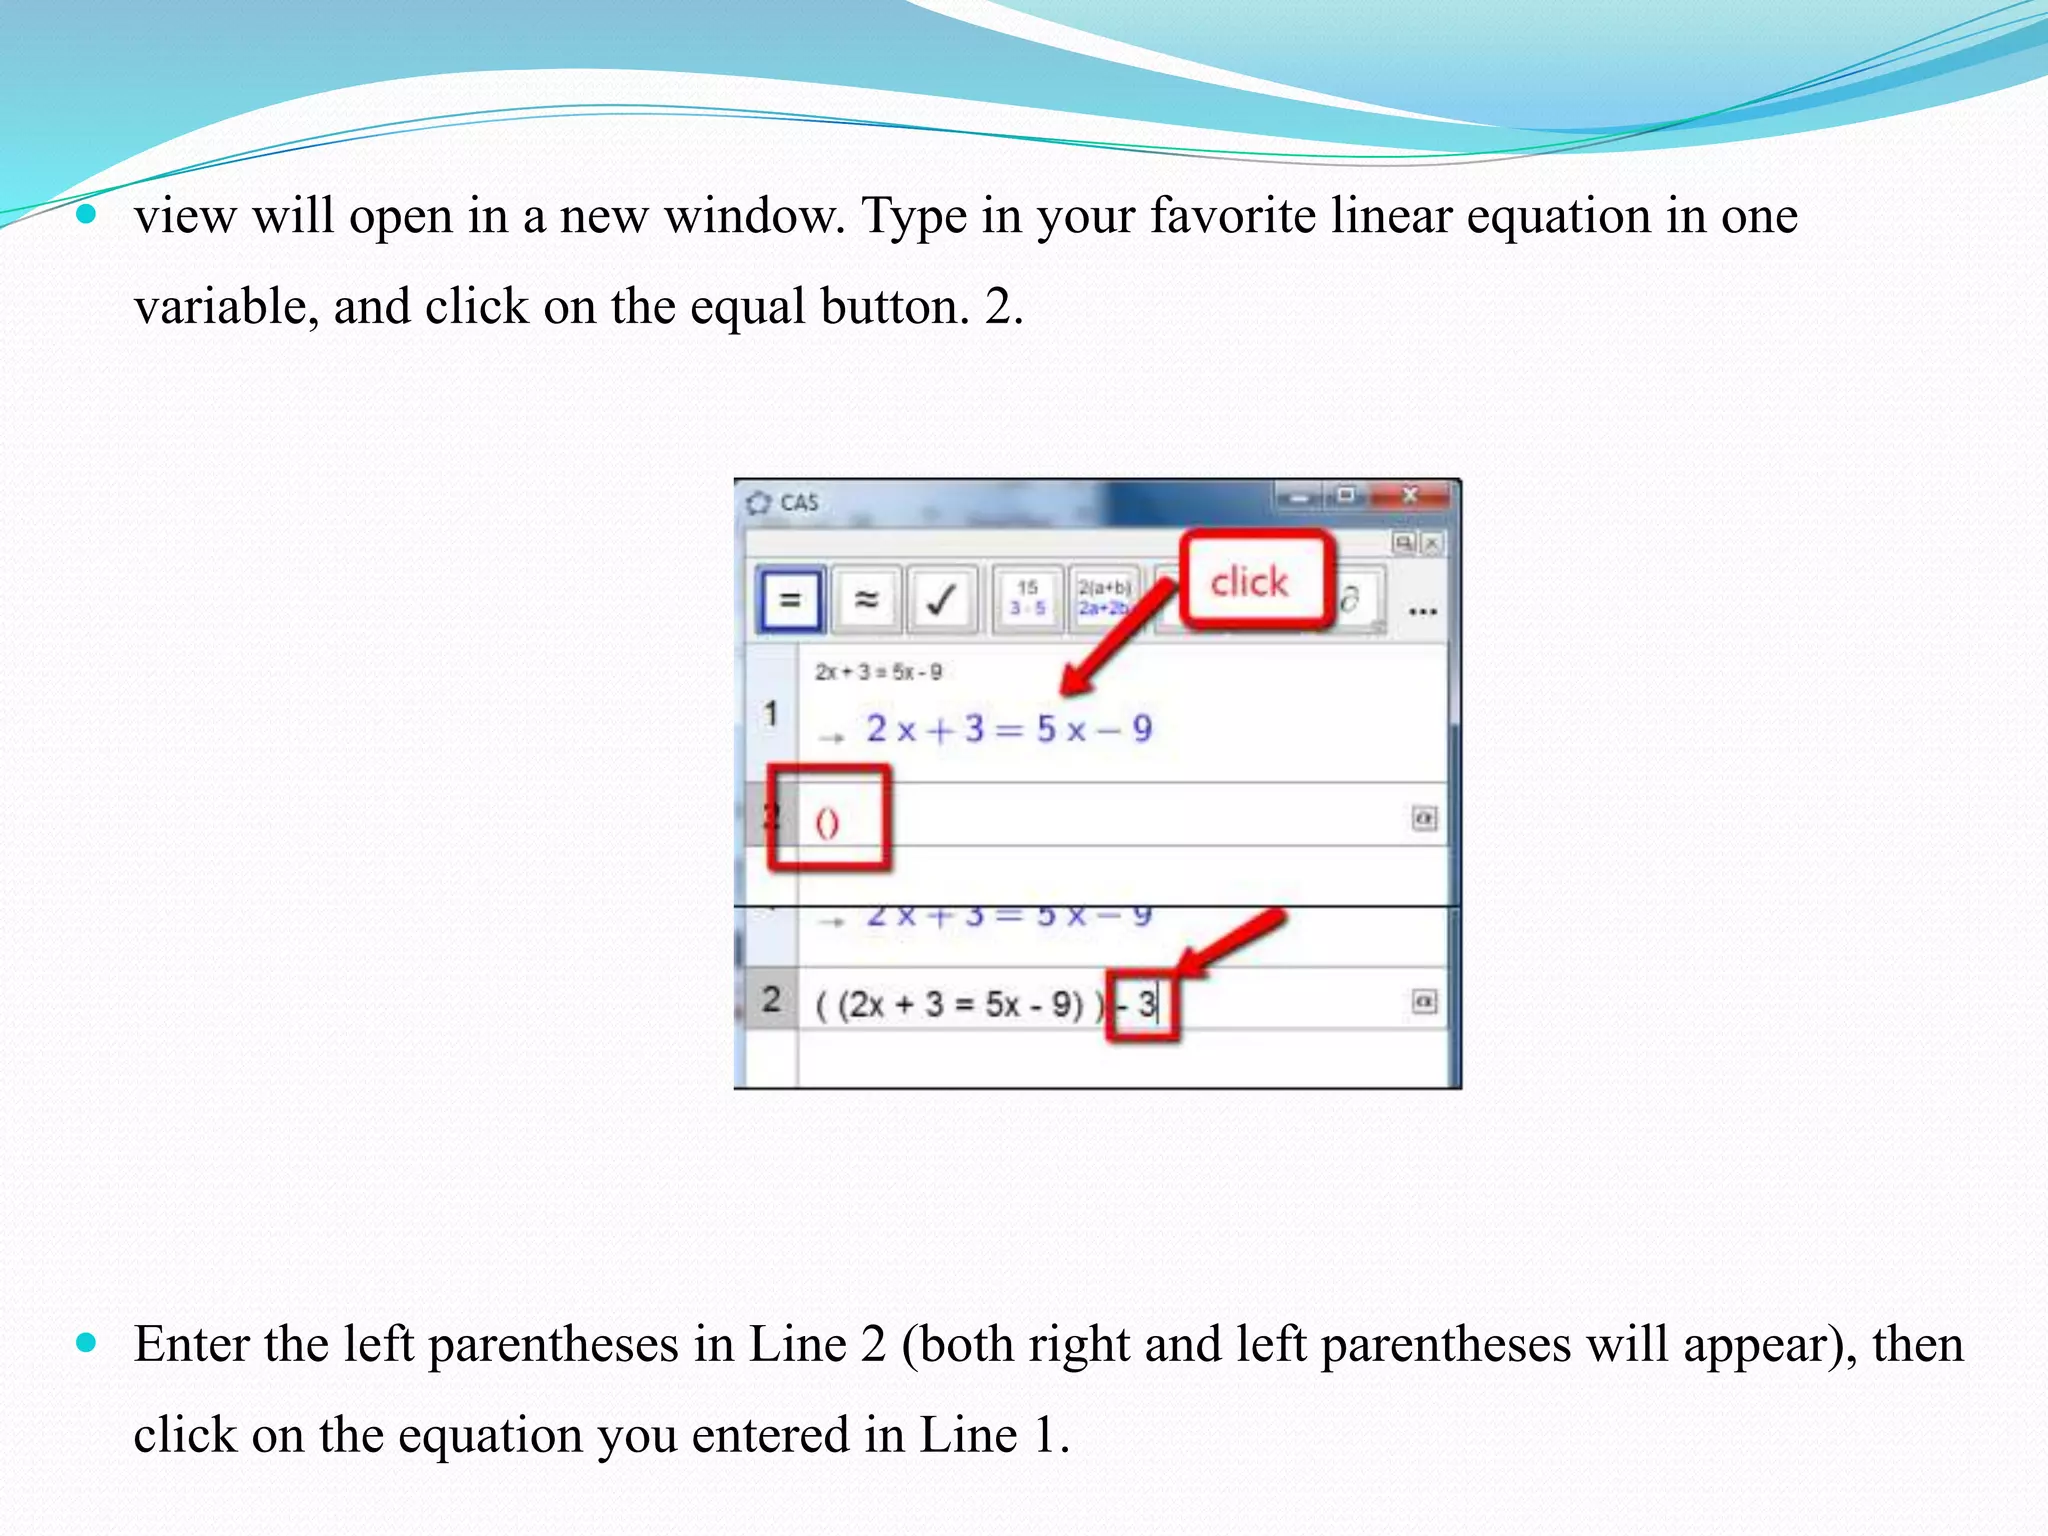
view willopen in a new window. Type in your favorite linear equation in one
variable, and click on the equal button. 2.
Enter the left parentheses in Line 2 (both right and left parentheses will appear), then
click on the equation you entered in Line 1.
74.
This willinsert the equation into Line 2 inside the parentheses. 3. Perform
the operation, clicking on the equal button. 4. Continue step-by-step until
you reach a solution.
75.
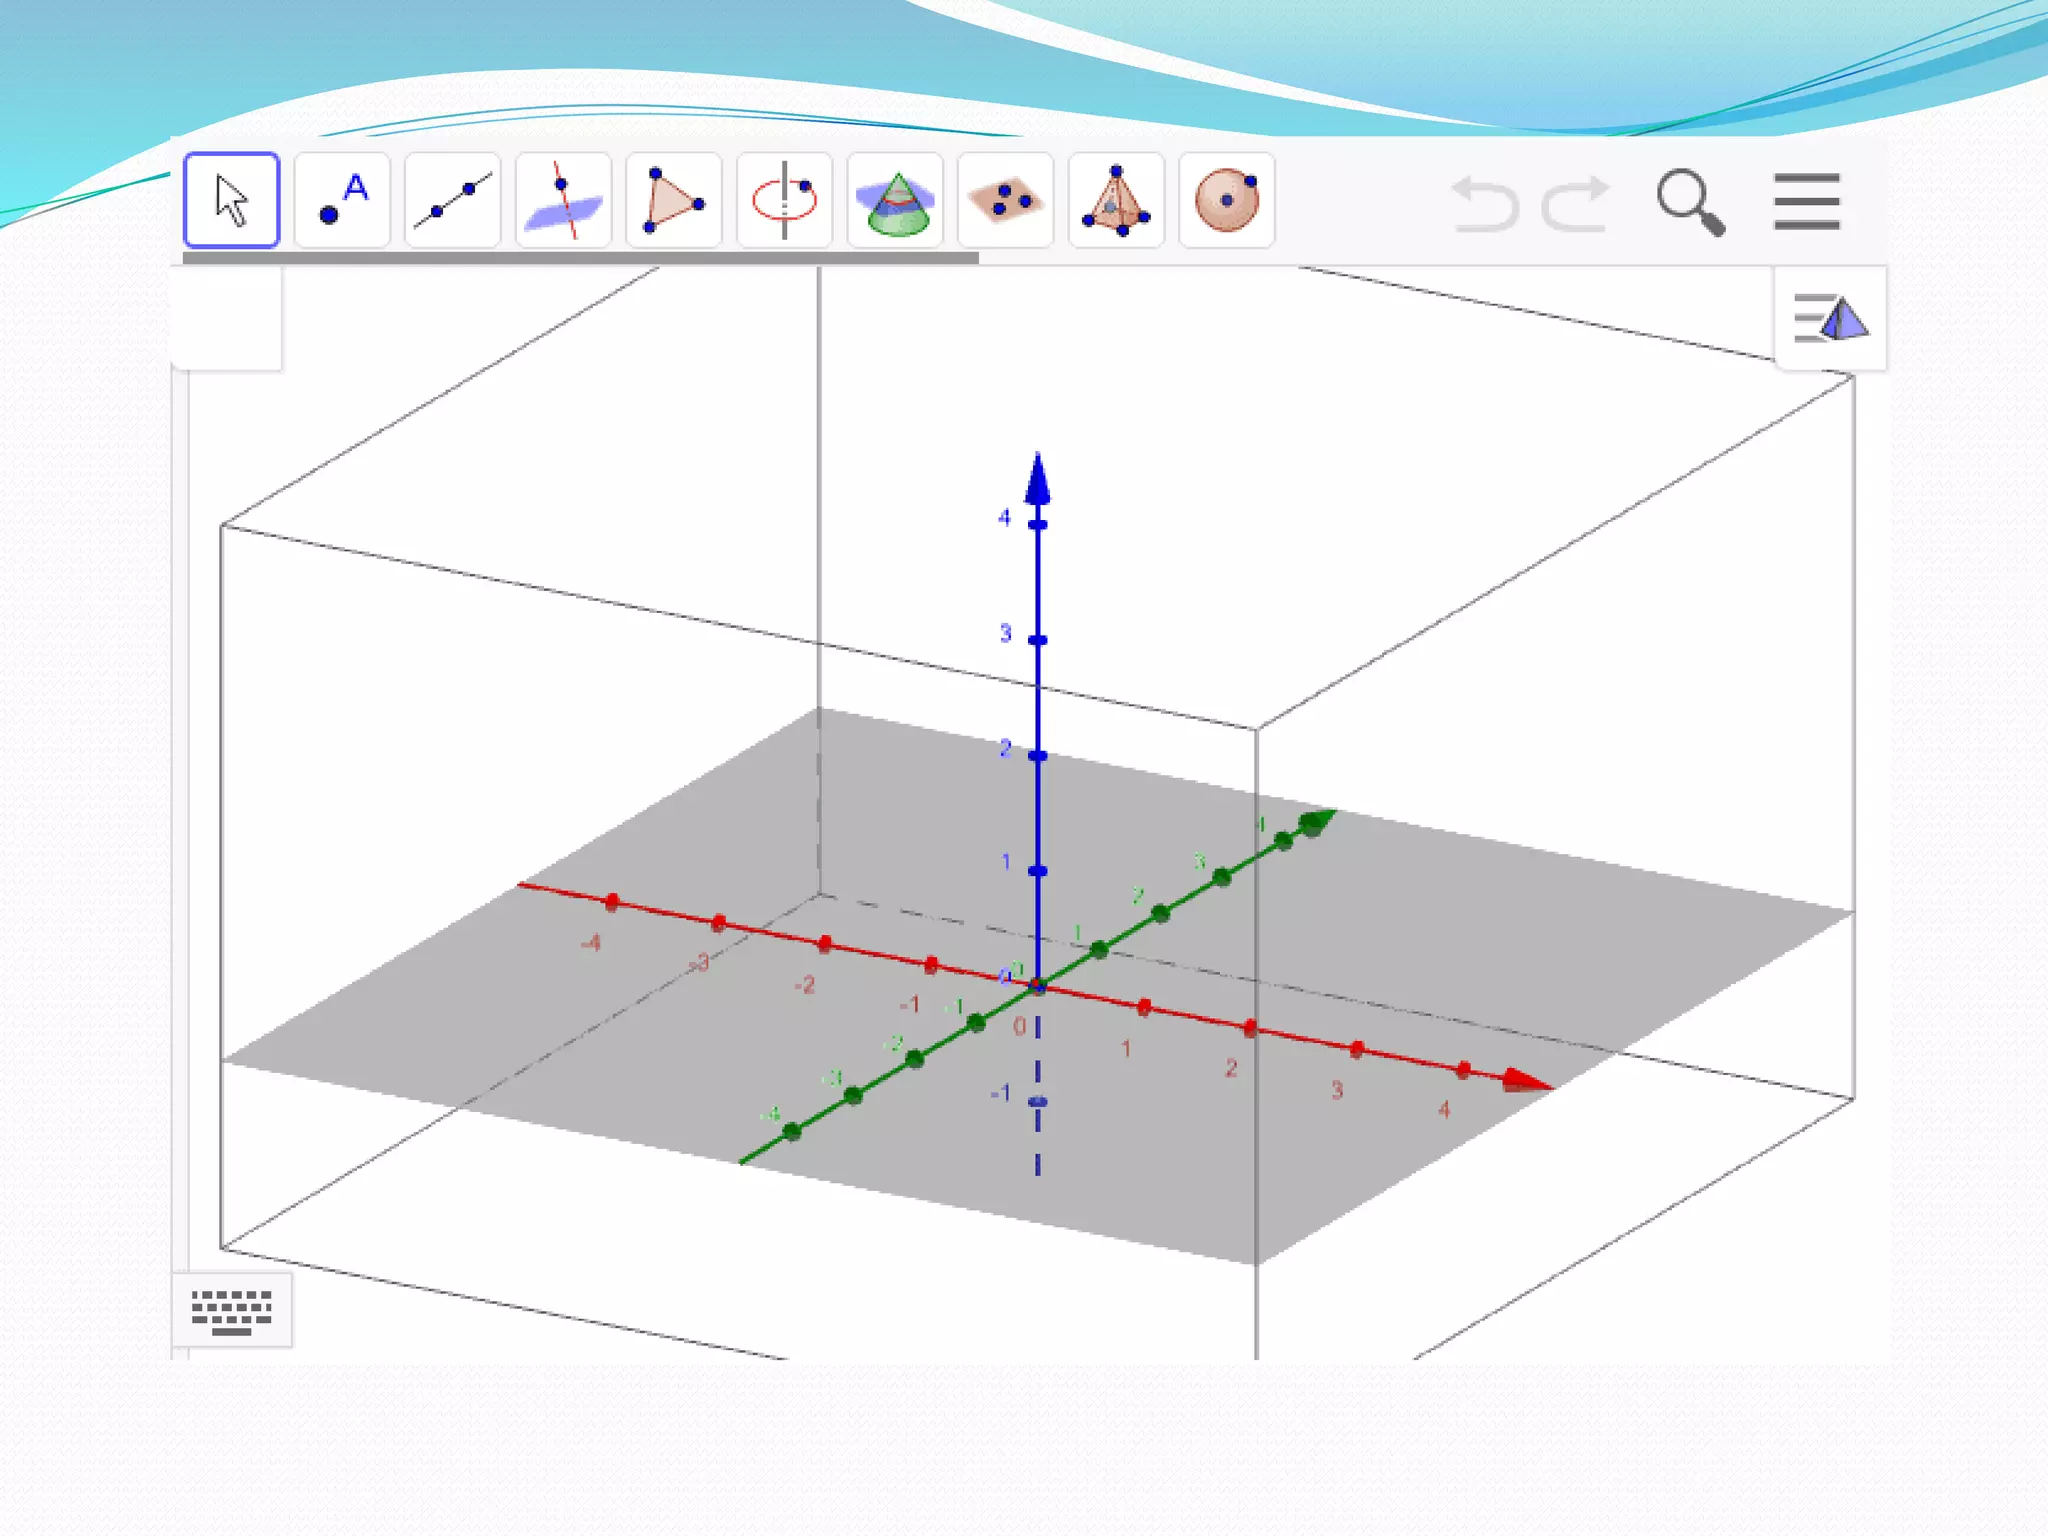
3D Graphics View
You may drag and drop the background of the graphics view to change its
visible area or scale each of the coordinate axes by dragging it with your
pointing device.
You may translate the three dimensional coordinate system by dragging the
background of the 3D graphics view with your pointing device.
Thereby, you can switch between two modes by clicking on the background
of the 3D graphics view
Mode x-y-plane: You may translate the scene parallel to the x-y-plane
Mode z-axis: you may translate the scene parallel to the z-axis
77.
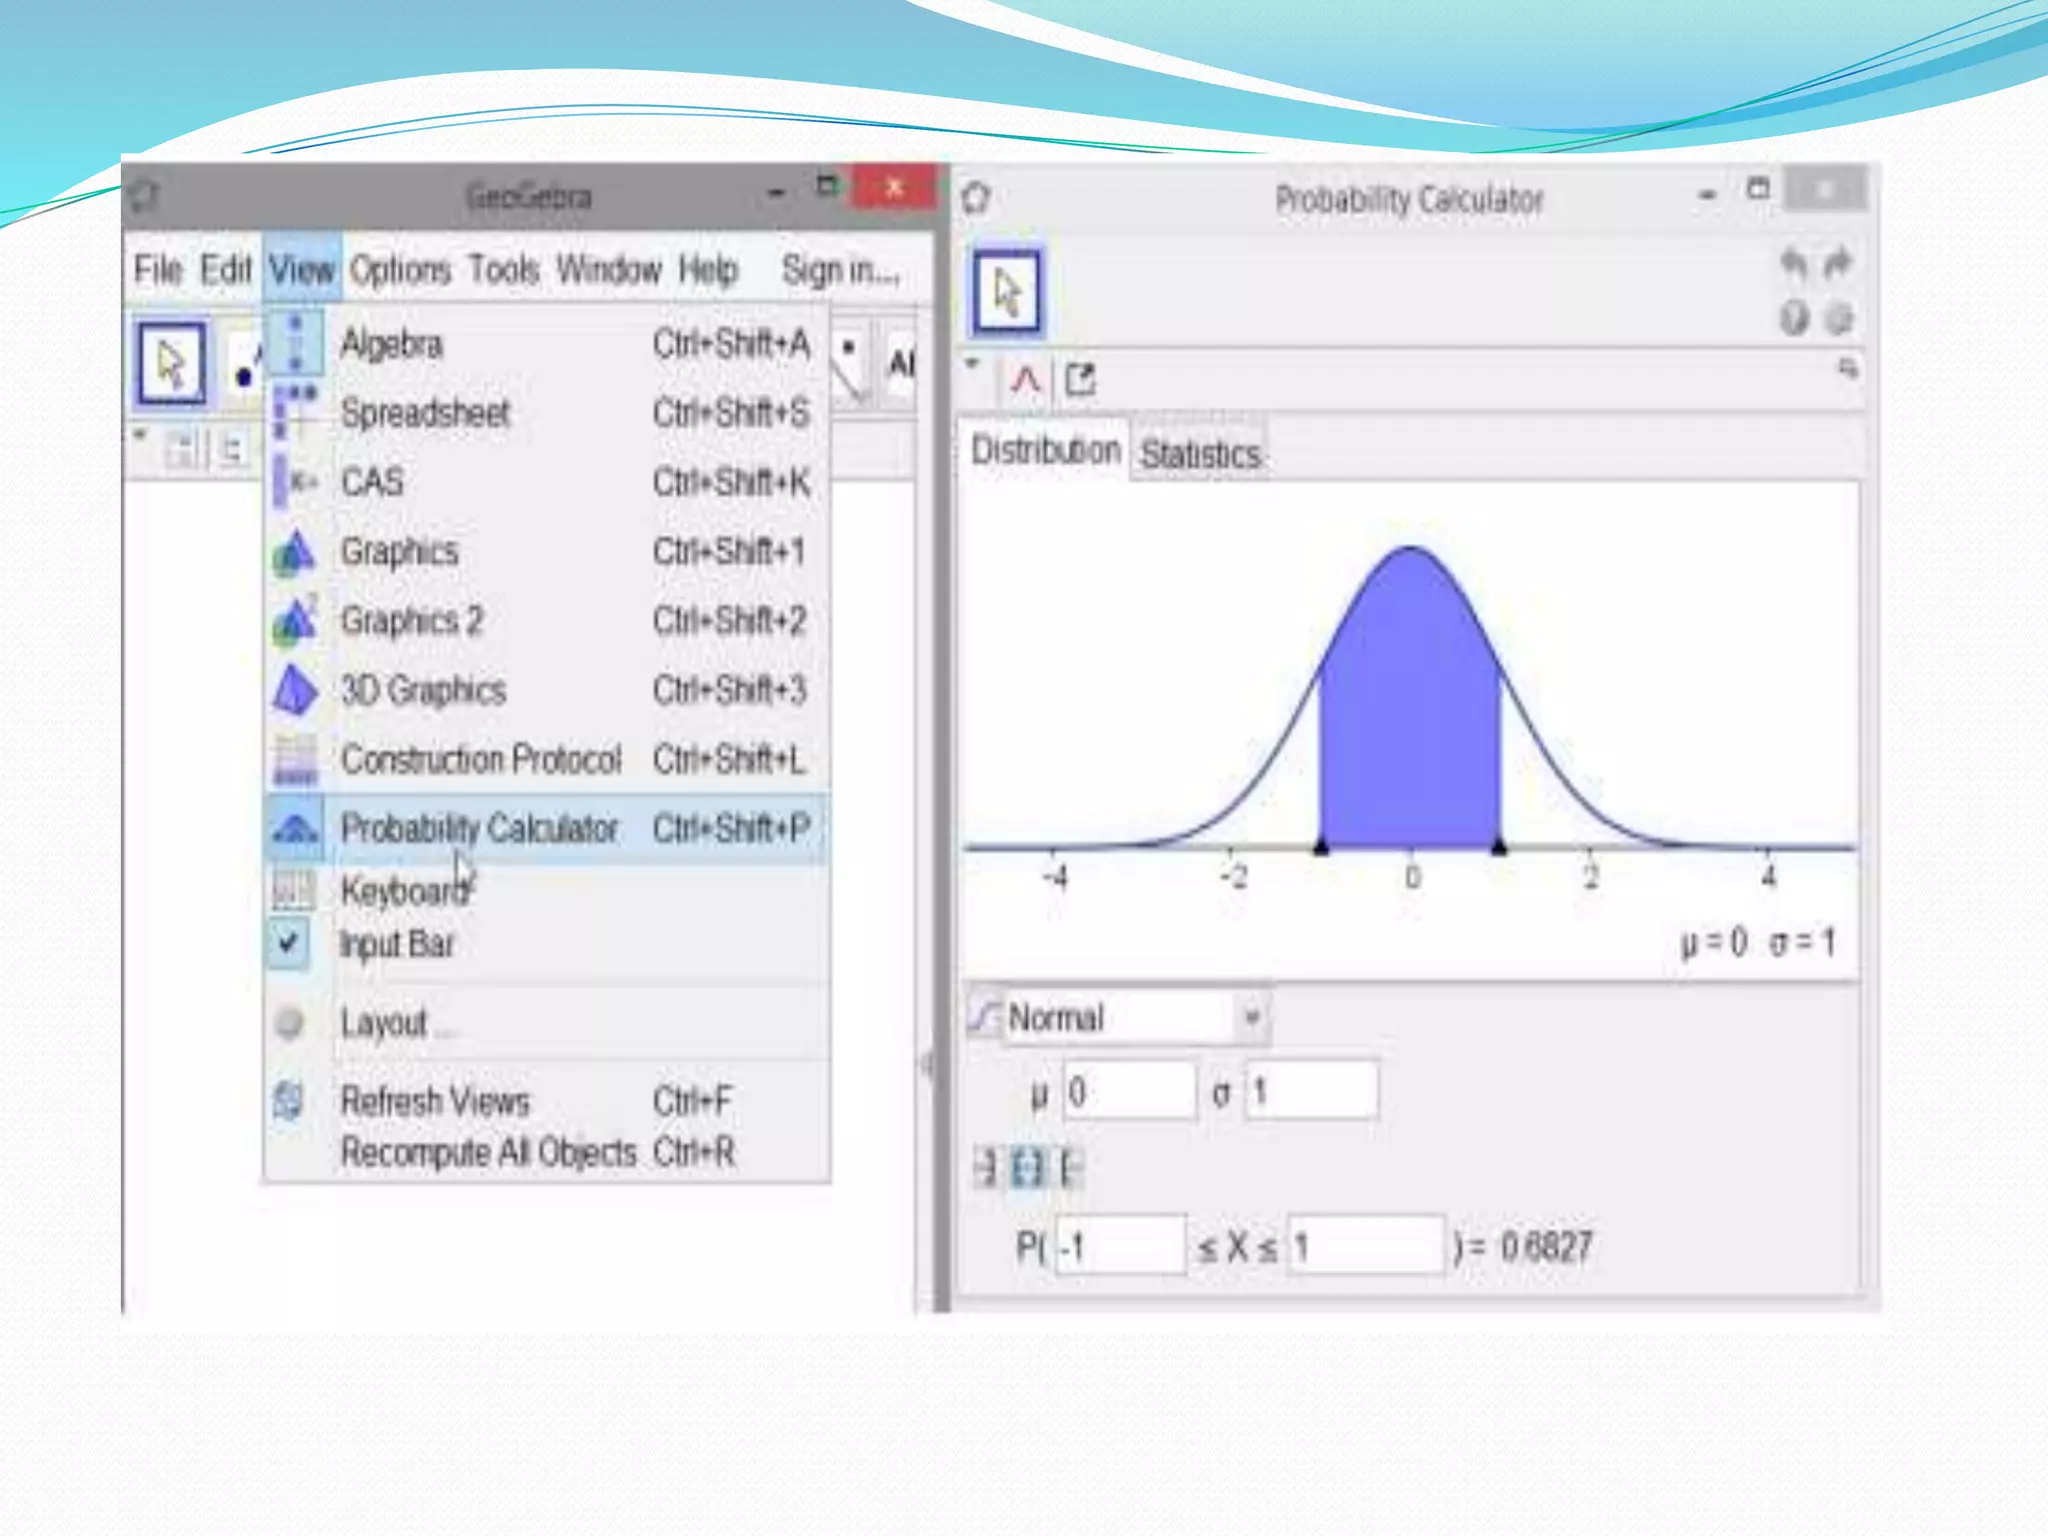
Probability calculator
Thisfeature gives you a calculator that instantly evaluates and displays
probabilities from a selection of inbuilt probability distributions. Open
GeoGebra and then select View->Probability Calculator, or press
Ctrl+Shilt+P.
The default distribution is the standard normal distribution, as shown above,
which demonstrates the rule of thumb that approximately 2/3 of the data lies
within 1 standard deviation of the mean.
80.
Contribution of Mathematicians
inComputer Technology
In 1642 AD, Blaise Pascal , a French mathematician invented a calculating
machine named as Adding Machine.
This machine was capable of doing Addition and Subtraction. This device
is known as the First Calculator of the world.
In 1671 AD, Gotfried Leibnitz, a German Mathematician improved the
Adding machine and made a new machine capable of performing
multiplication and division also.
81.
Charles Babbagewas a British mathematician. In 1822, he designed a
machine called Difference Engine. It aimed at calculating mathematical
tables.
In 1833, Charles Babbage designed a machine called Analytical Engine.
It had almost all the parts of a modern computer.
Hollerith, a Mathematician, invented a fast counting machine named
Tabulating Machine in 1880.
82.
Introduction
Binary mathis at the core of how any computer operates. Binary is used to
represent each number in the computer.
Standard arithmetic is used in many functions of programming. Addition,
subtraction, multiplication and division is used in almost every program
written.
Computer Science is an umbrella term that contains many disciplines like
Operating Systems, Databases, Networking, Artificial intelligence,
Embedded systems, Data analytics….need I go on?!!! And while there are
some disciplines that you can handle with minimal knowledge of
Mathematics, most of them require at least some level of competency.
83.
Contd….
For example,fields like Artificial Intelligence and Machine Learning
require a thorough knowledge of Mathematical concepts like Linear
algebra, Multivariable Calculus, Probability Theory, etc.
The application for the program being created will often dictate the specific
type of math techniques required.
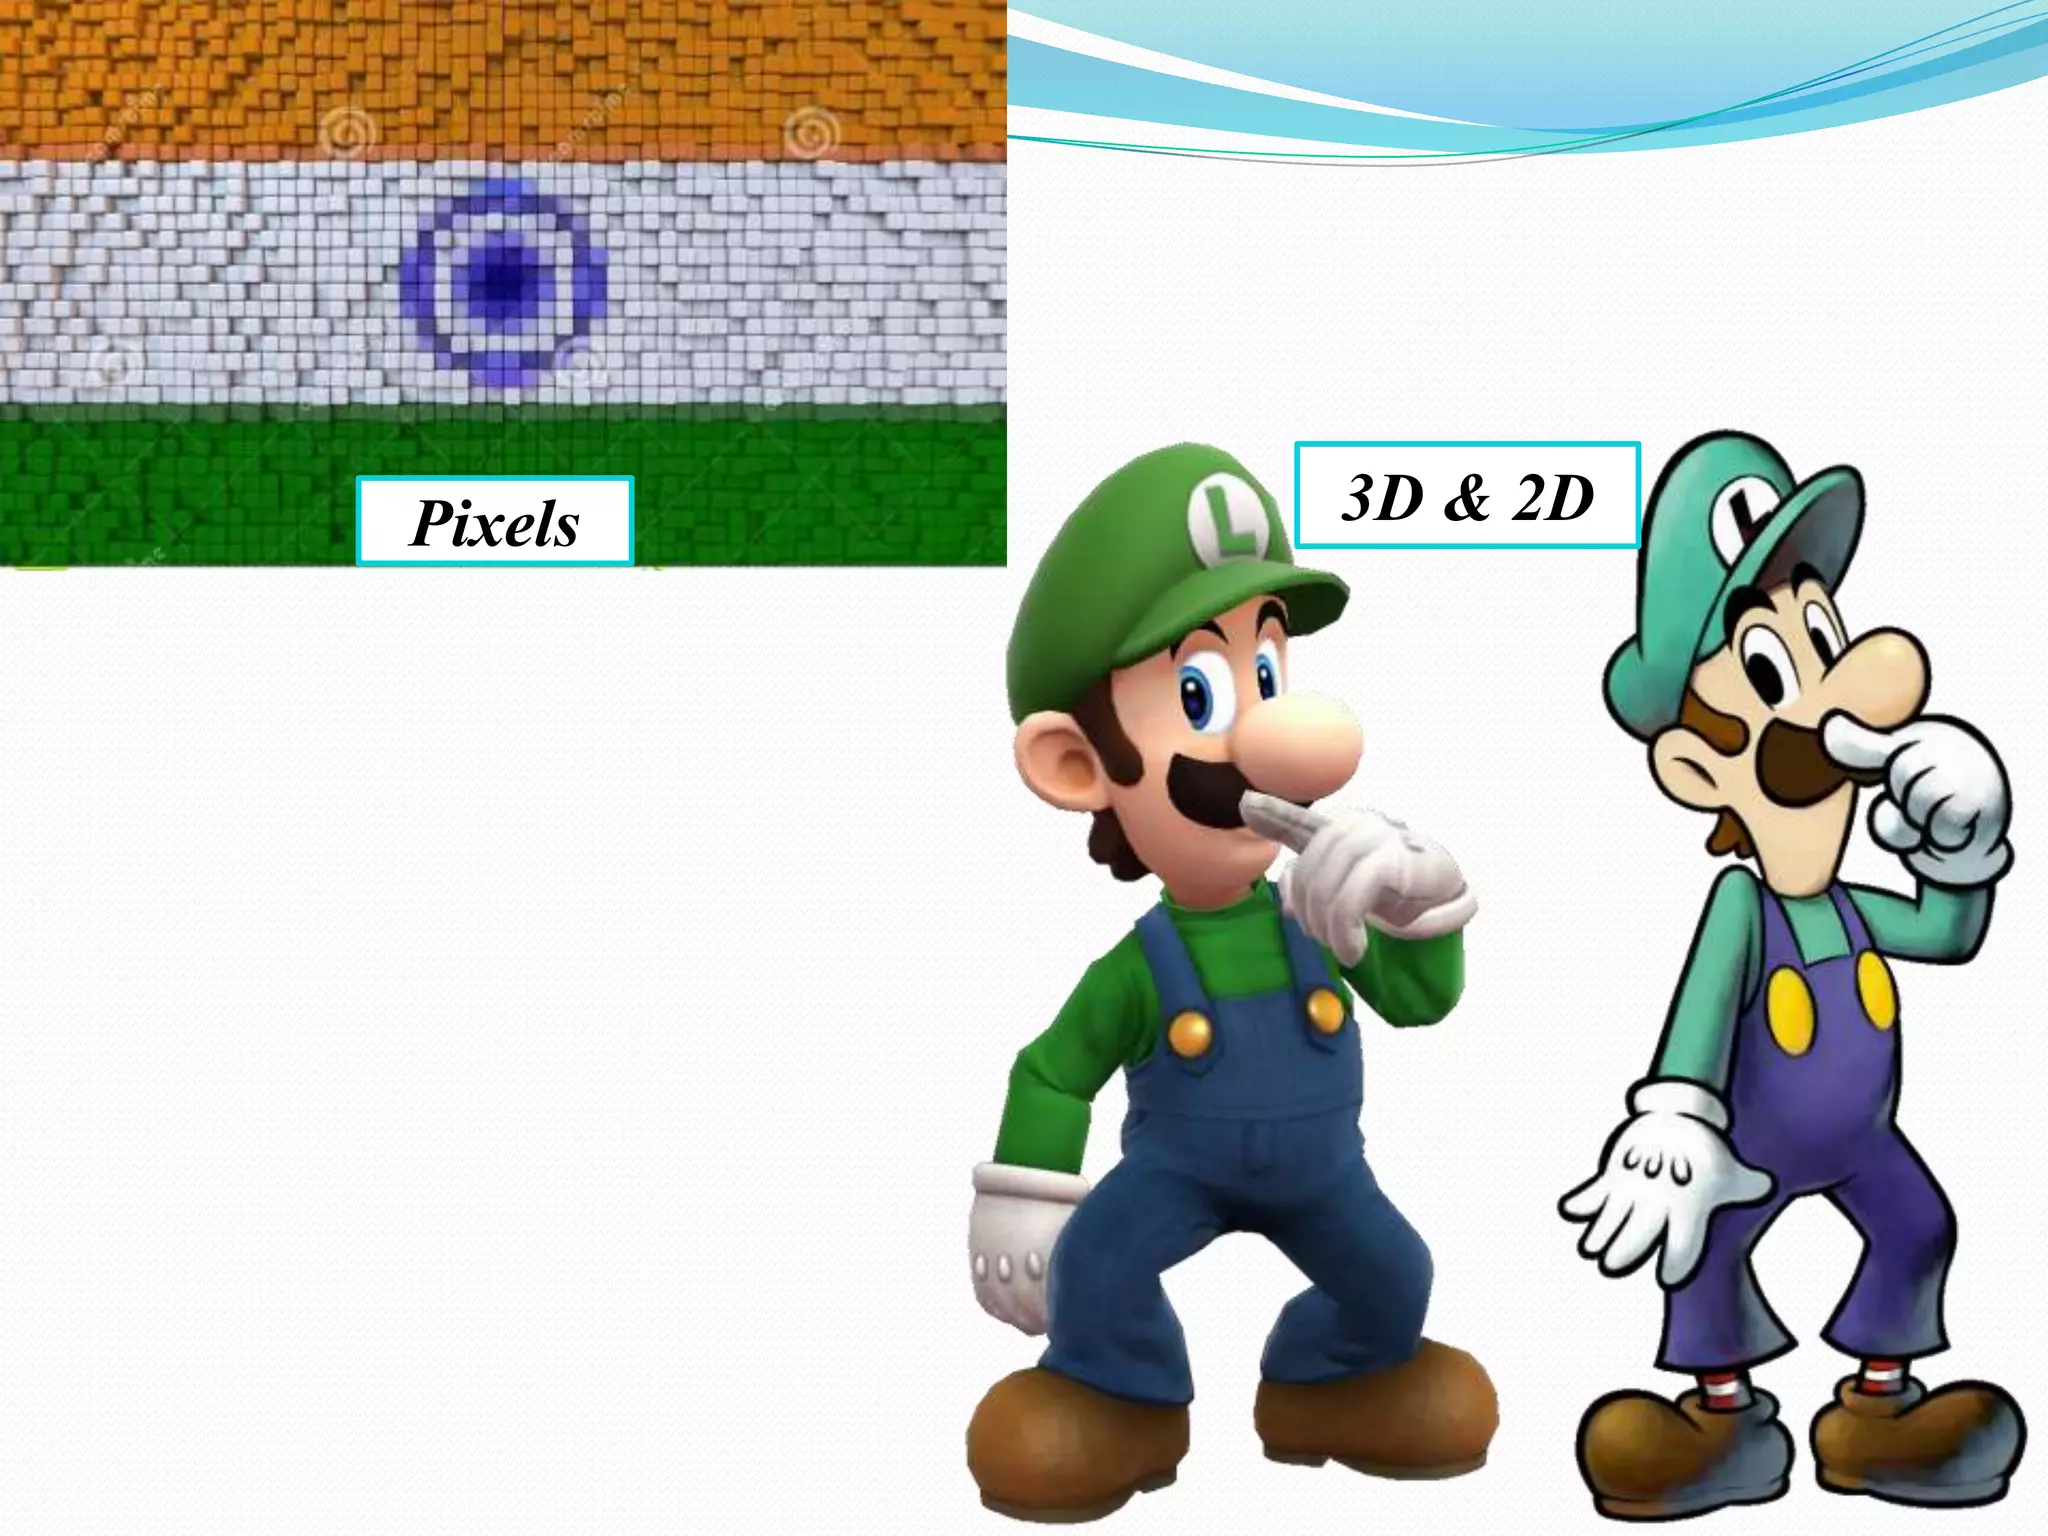
Linear algebra is often used for transformation of matrices. Matrix
transformation is found in both 2D and 3D modeling as seen in computer-
aided design and photo editing software.
84.
Electronic Journal inEnglish and other local languages should be available
simultaneously with collaborations among institutions.
Are traditional textbooks too expensive?
New technological tools will push more dynamic contents.
The eJMT.
Distance Education is crucial.
– Are universities too expensive?
– Delivering Mathematics contents through the web will include videos.
– Lectures on demands.
Collaborations among universities/individuals:
Internet will make our communications in research and teaching more
efficient->more collaborations.
85.
Uses of Logarithmsin Computers
Logarithms have been an important part of mathematics since 1614.
Mathematicians and computer programmers use logarithmic exponents
because it simplifies complex mathematical calculations.
For example, 1000 = 10^3 is the same as 3 = log101000.
Computer developers use logarithms in computer function formulas to
create specific software program outcomes, such as the creation of graphs
that compare statistical data.
86.
Computer Imaging
Logarithmsused in computer imaging align pixels, organize colors and help
computers manipulate photographs for enhancement, merging or
comparison.
After the creation of a digital image, the photographed information converts
into small sections of color called pixels.
For a computer to recreate an image, it organizes the red (R) green (G) blue
(B) values for each pixel and transforms them into two dimensional color
pairs, such as G/R, B/R.
Each pairing signifies a specific mathematical logarithm that allows the
computer to translate and align each pixel into the photographed image.
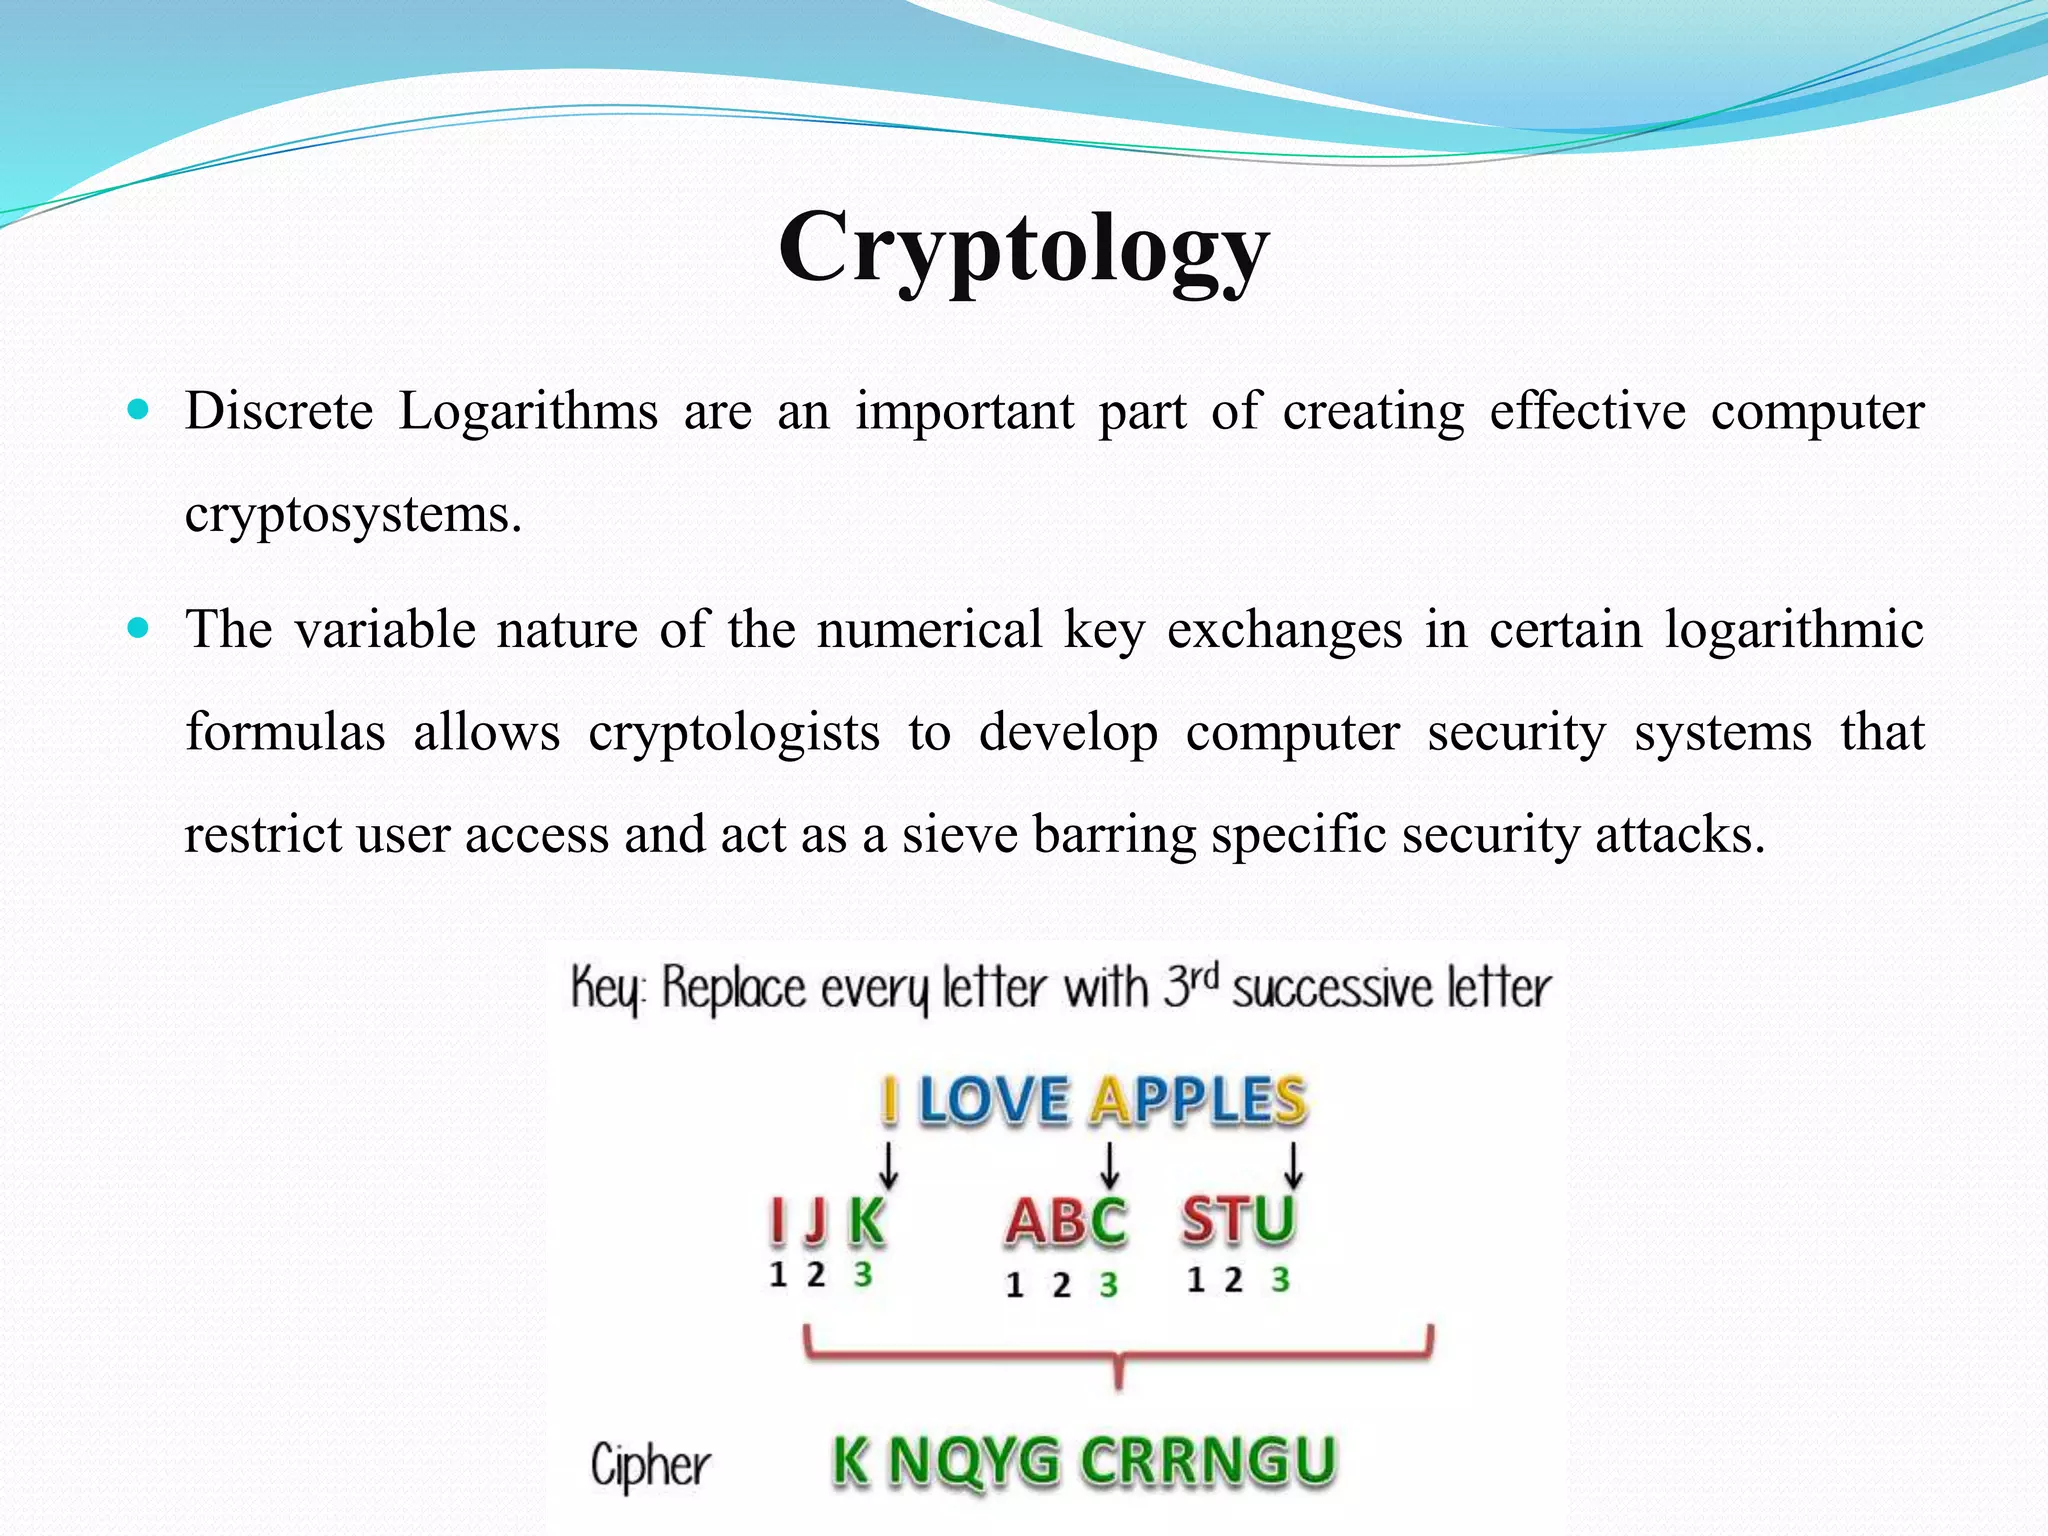
Cryptology
Discrete Logarithmsare an important part of creating effective computer
cryptosystems.
The variable nature of the numerical key exchanges in certain logarithmic
formulas allows cryptologists to develop computer security systems that
restrict user access and act as a sieve barring specific security attacks.
89.
Boolean Algebra
Atthe most fundamental level, all of a computer’s data is represented as bits
(zeros and ones).
Computers make calculations by modifying these bits in accordance with
the laws of Boolean algebra, which form the basis of all digital circuits
(which are represented as graphs).
Low-level programming languages rely directly on logical operators such
as and, not, and or.
Programmers also use Boolean logic to control program flow -- that is,
which instructions are executed under certain conditions.
90.
Induction and recursion
These are the key concepts in understanding the functional paradigm for
programming, which is seeing increased adoption in industry with companies
such as
Apple (Swift),
Microsoft (F#),
Microsoft Research (F*, Haskell),
Oracle (Java 8, Javascript),
Facebook (Haskell), and
Amazon adopting the paradigm both for niche tasks and general use.
91.
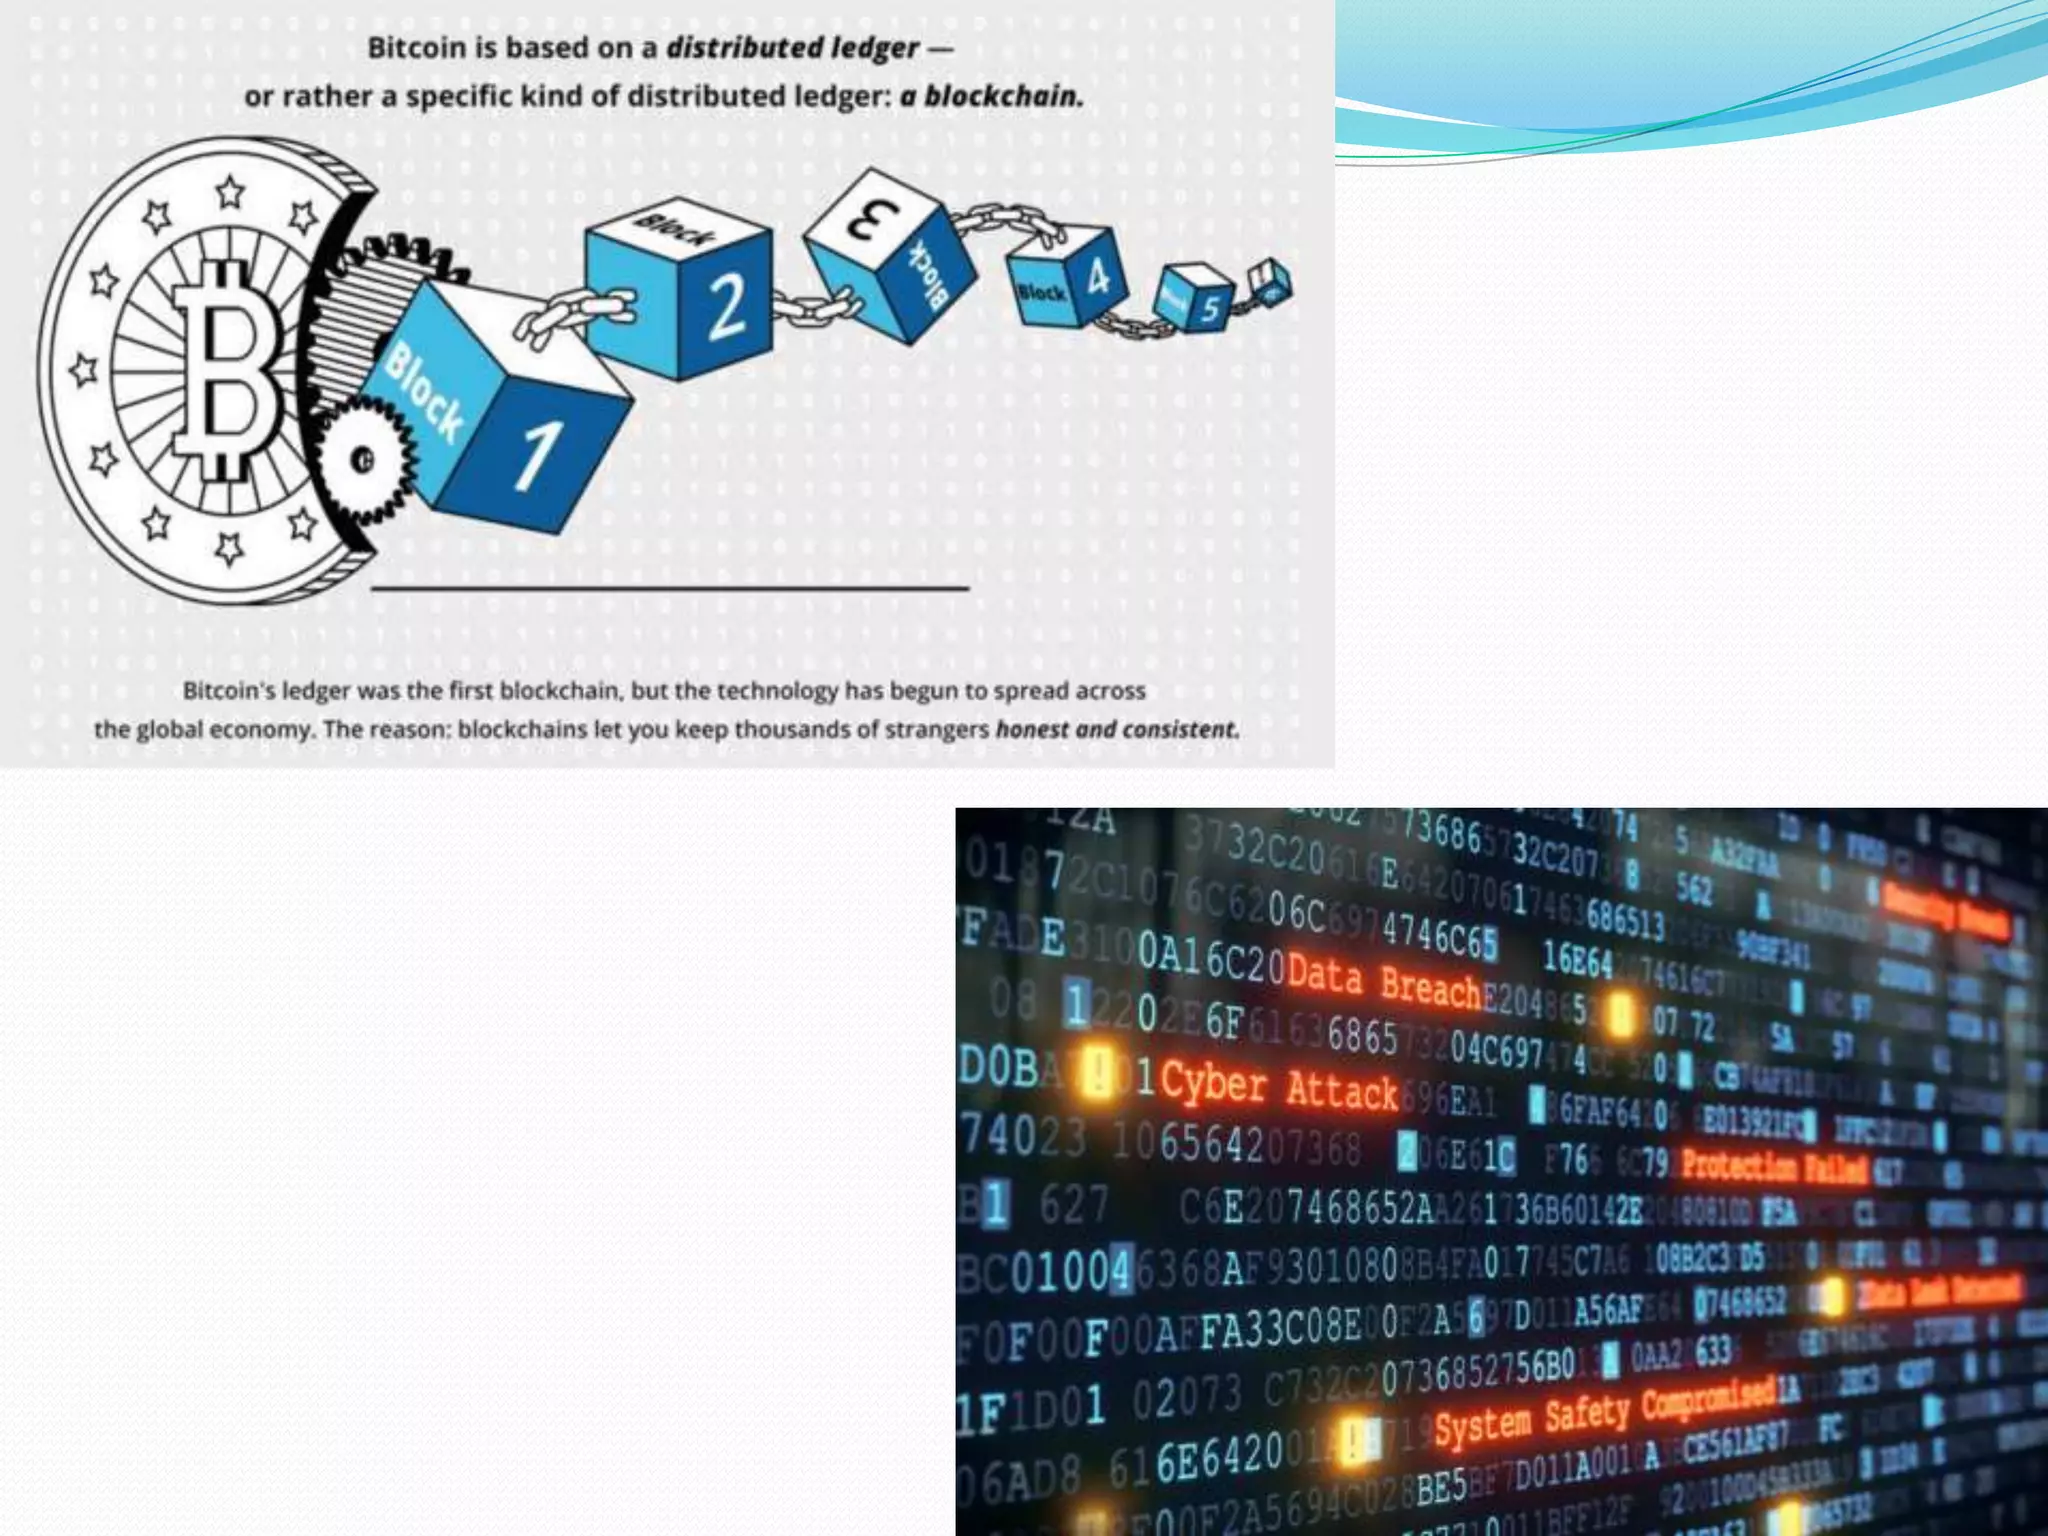
Number theory
Ithas critical applications across block chain, cryptography, and computer
security.
Modern cryptographic systems must be mathematically correct in order to
secure users’ data from malicious adversaries.
Checksums, based on hashing, can verify that files transferred over the
internet do not contain errors.
Data structures such as hash maps rely on modular arithmetic for efficient
operations.
Number theory also has memory-related uses in computer architecture and
operating systems.
93.
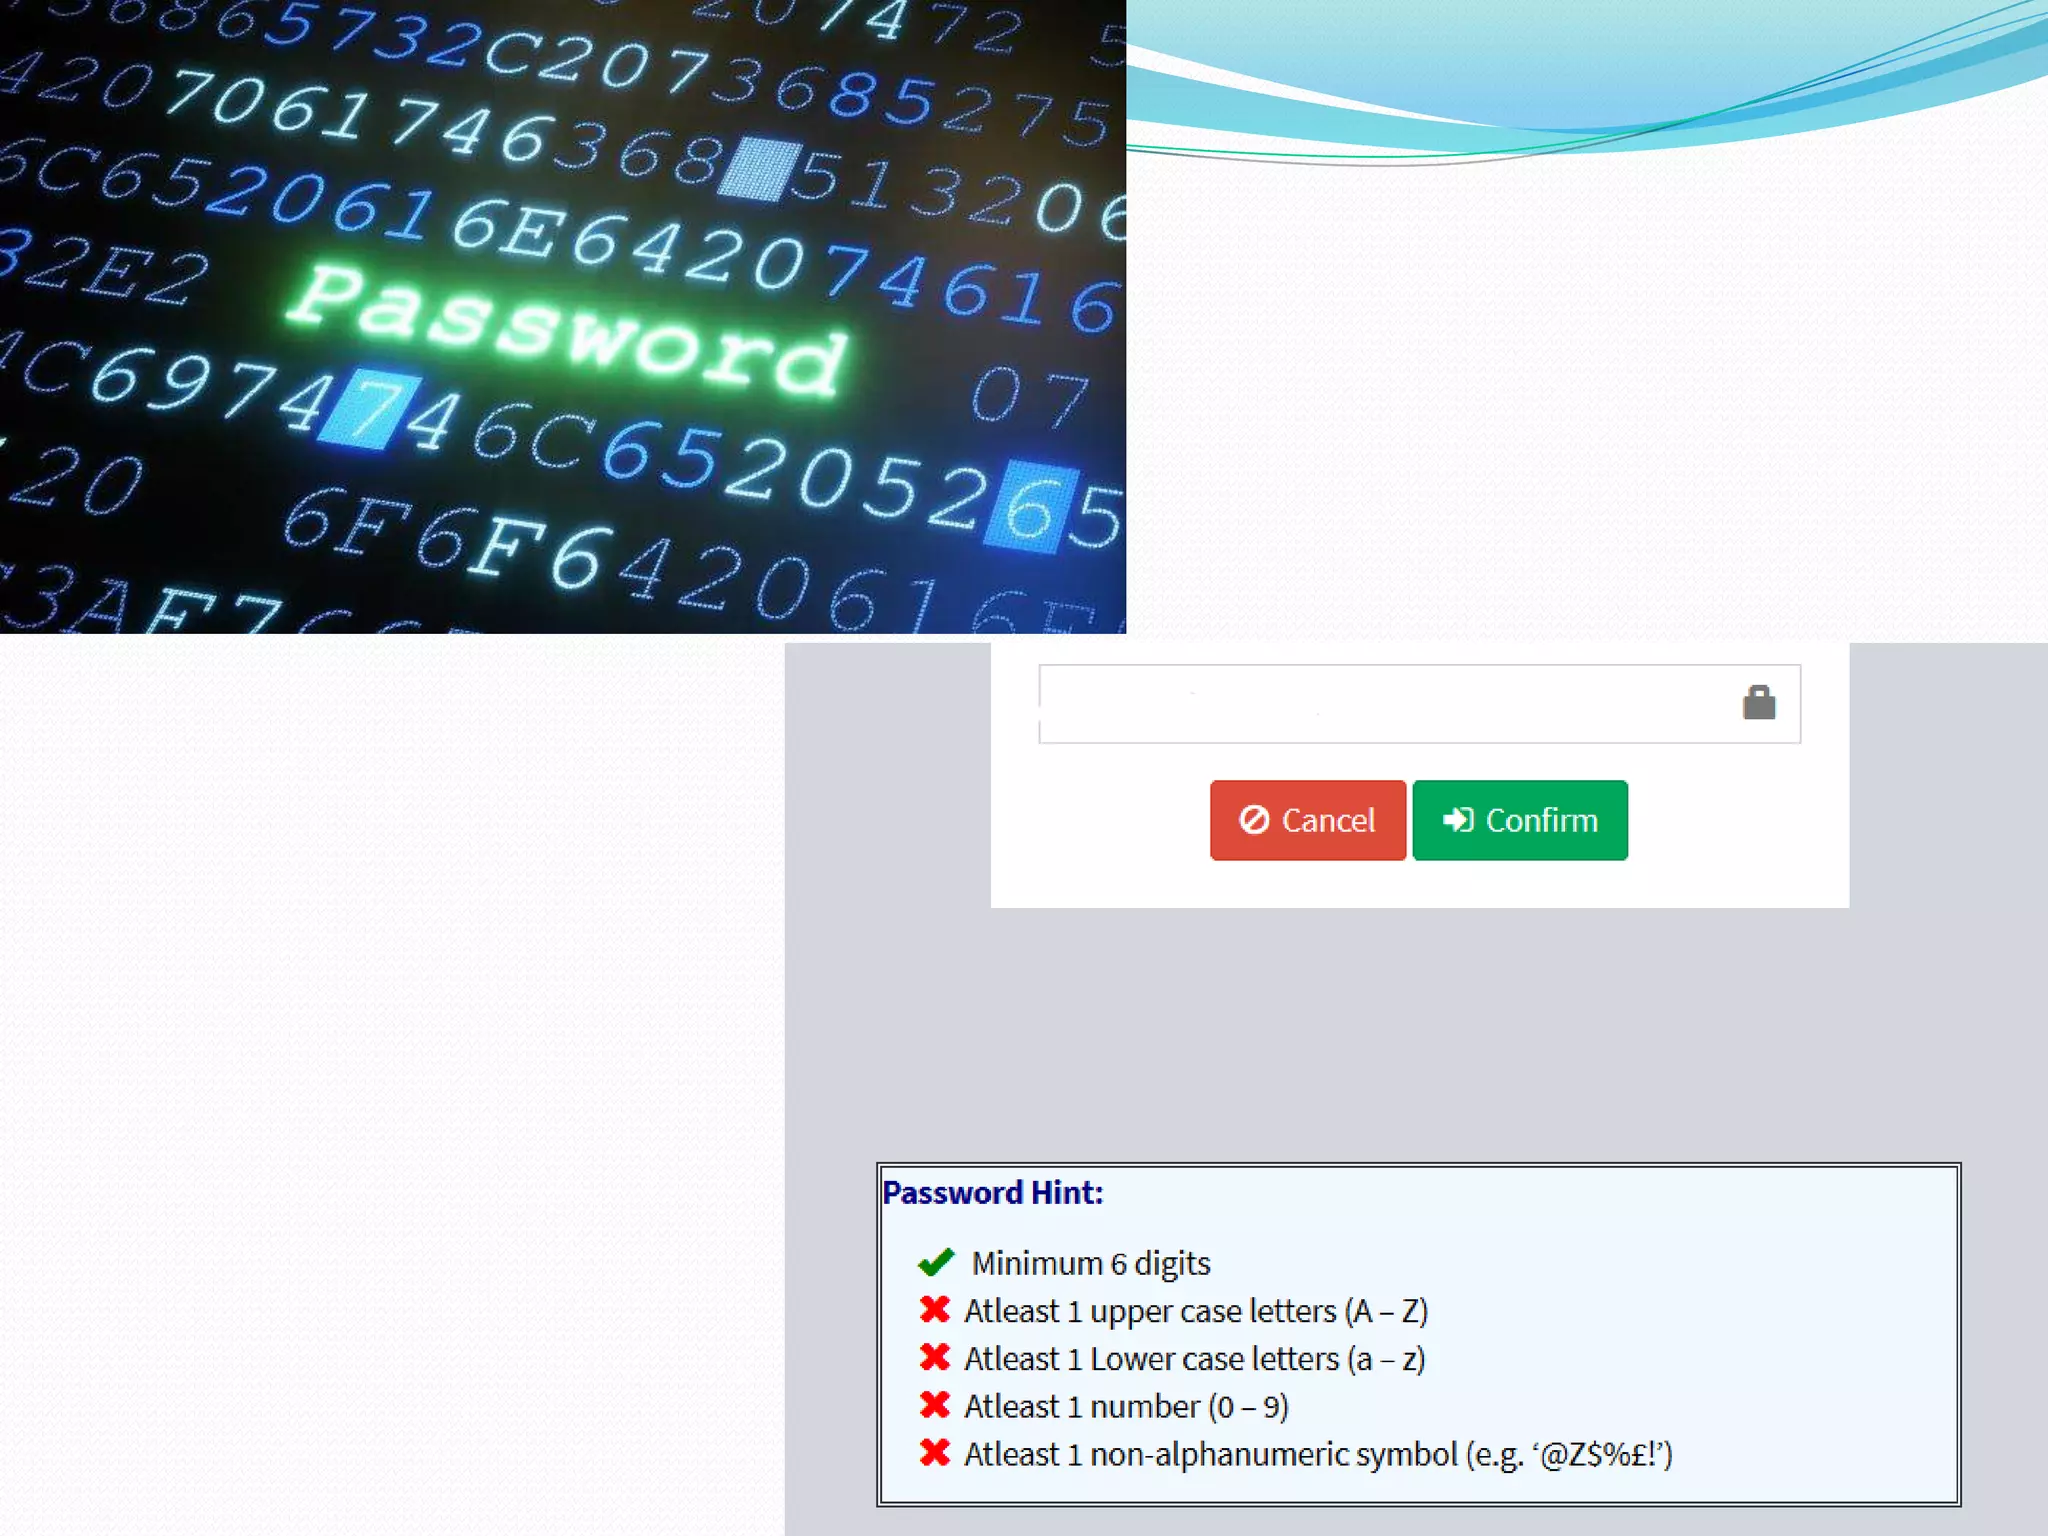
Counting
Counting techniquesare used to develop quantitative intuition.
For example, they can be used to determine the number of valid passwords
which can be formed from a given set of rules, and how long it would take for
an attacker to brute force all of them.
lossless compression algorithm: every compression algorithm must make
certain files smaller and others larger. Counting is helpful in analyzing the
complexity of compression.
95.
Graphs
Graphs arepowerful data structures which are used to model relationships and
answer questions about said data:
for example, your navigation app uses a graph search algorithm to find the
fastest route from your house to your workplace.
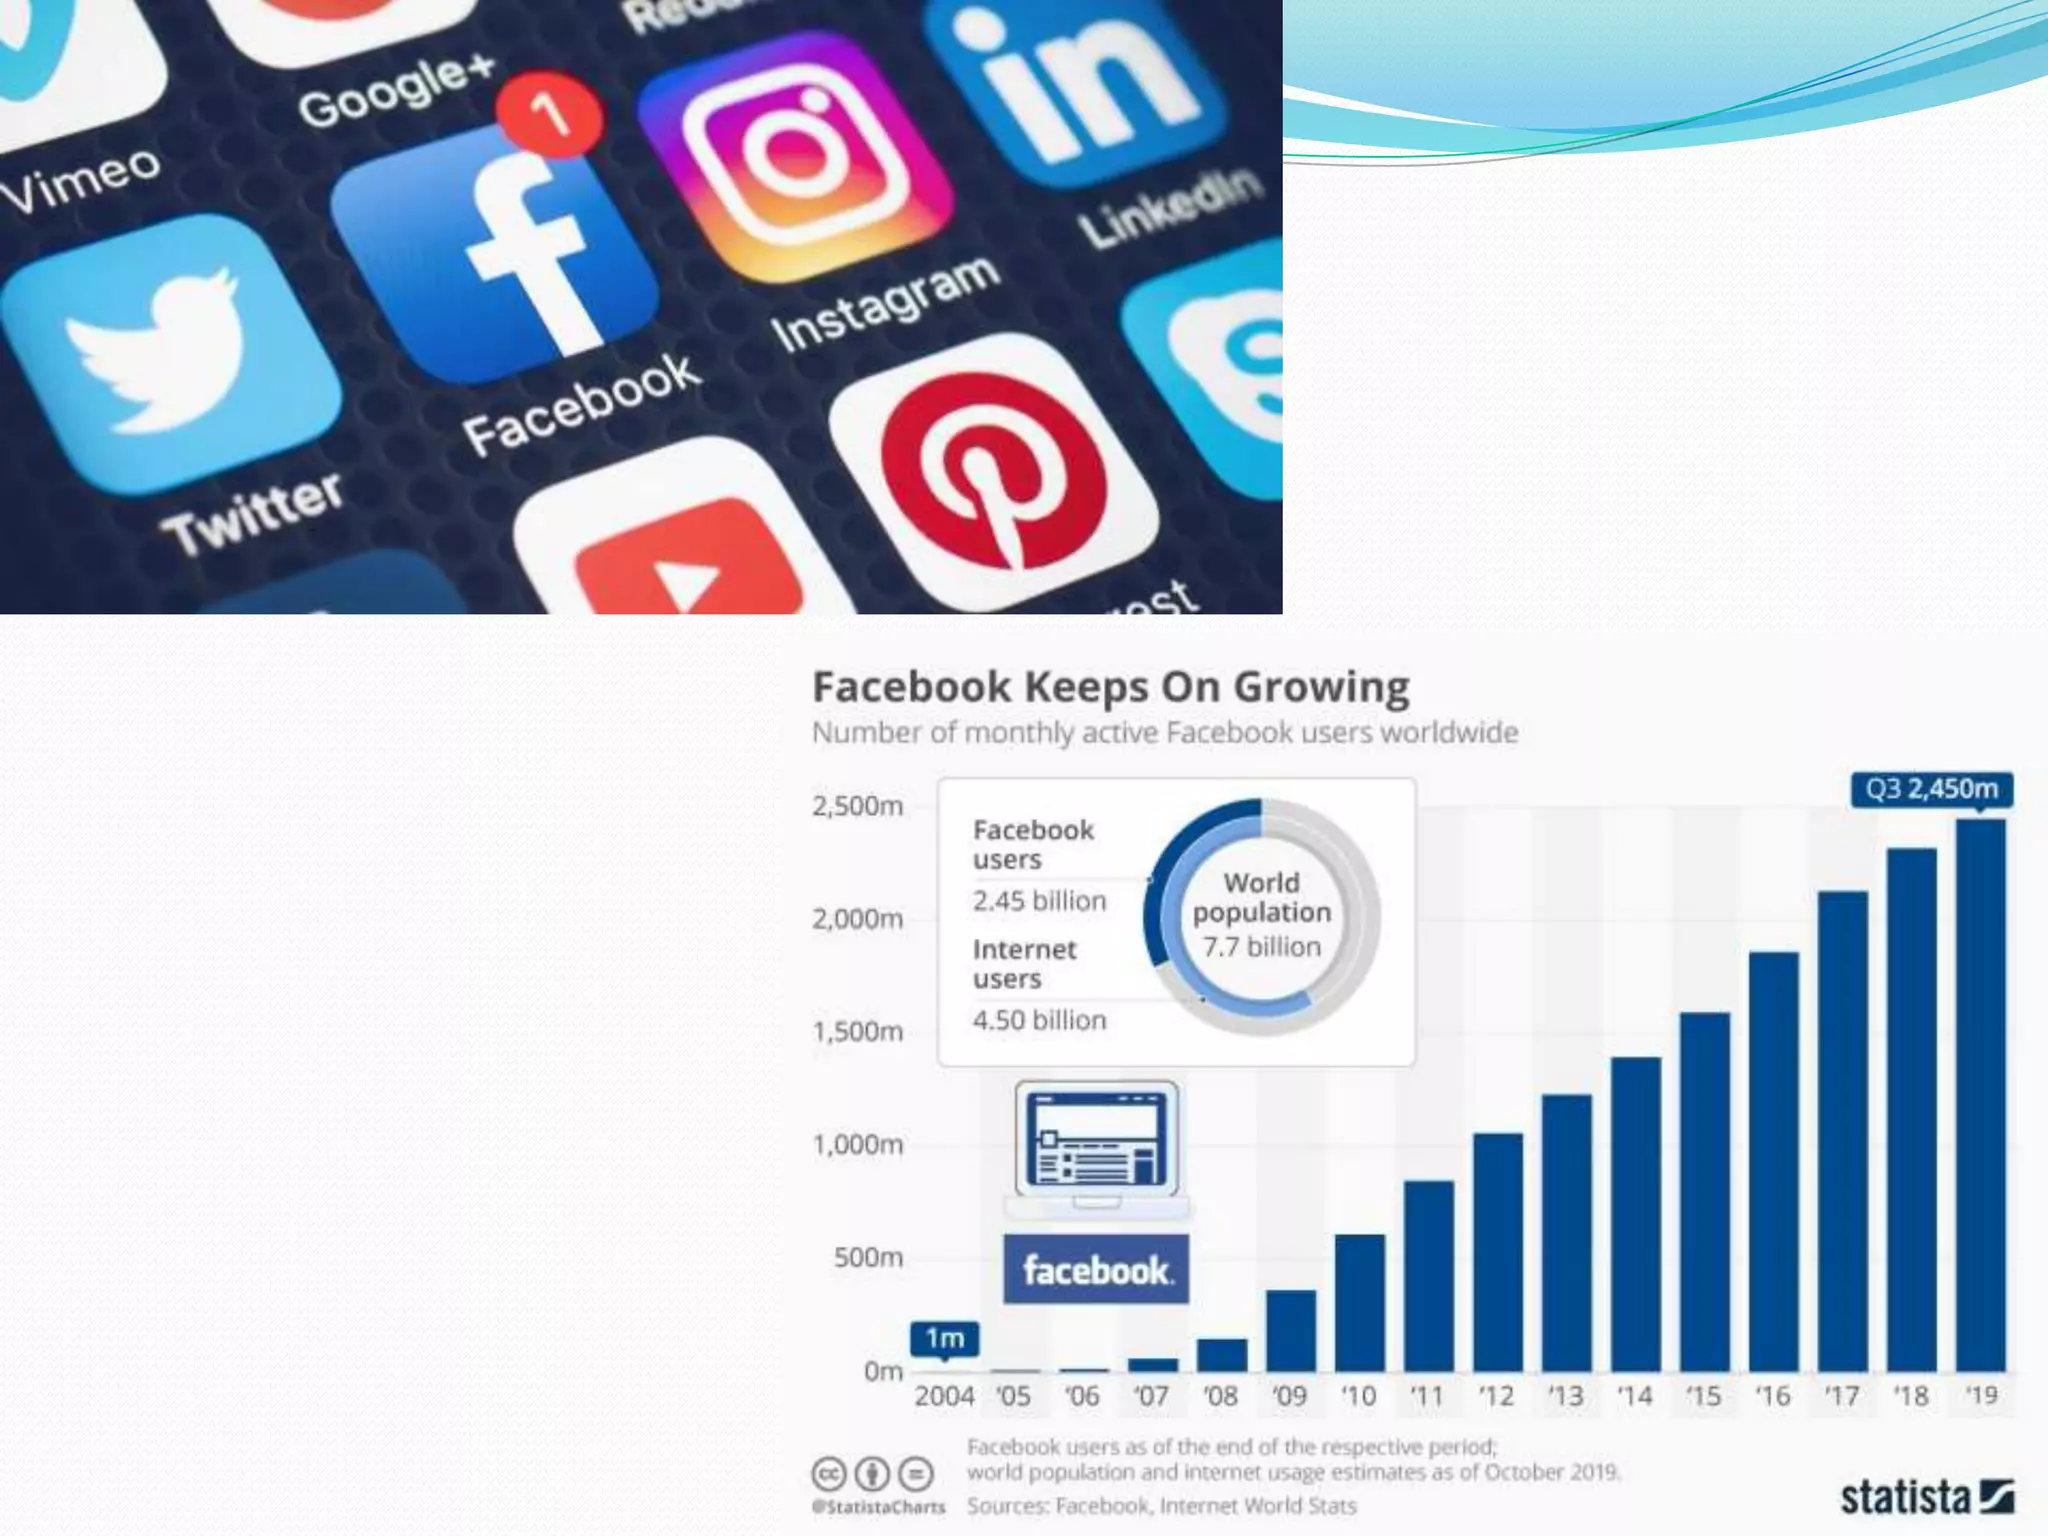
Linked-In uses a graph to model your professional network, as does your
telecommunications company for its cellular network (in fact, network is an
alternate name for a graph).
Computer scientists use graphs extensively: to represent file systems, for
version control, and in functional programming, deep learning, databases, and
many more applications.
98.
Linear Algebra
Asscience and engineering disciplines grow so the use of mathematics
grows as new mathematical problems are encountered and new
mathematical skills are required.
In this respect, linear algebra has been particularly responsive to computer
science as linear algebra plays a significant role in many important
computer science undertakings.
A few well-known examples are:
Internet search • Graph analysis • Machine learning • Graphics •
Bioinformatics • Scientific computing • Data mining Computer vision •
Speech recognition • Compilers • Parallel computing
99.
Google and LinearAlgebra
Google and Linear Algebra, Google set itself apart from other search
engines by its ability to quantify “relevance” with the help of mathematics.
100.
Games
Many computergames use 3D graphics. Moving and animating these on a
two-dimensional screen, as well as rendering colors, light and shadows,
requires vectors, matrices and many other concepts from linear algebra and
3D geometry.
Computer games also have to create realistic water and animate moving and
colliding physical objects.
Finally, computer programs have to generate random numbers to make the
game more interesting, and model the artificial intelligence of virtual
players.
This would not be possible without advanced mathematics.
101.
Angry Bird (Game)
Math is everything when it comes to video games.
From having the ability to calculate the trajectory of an Angry Bird flying
through the sky to ensuring the character jumps and lands back on the
ground.
102.
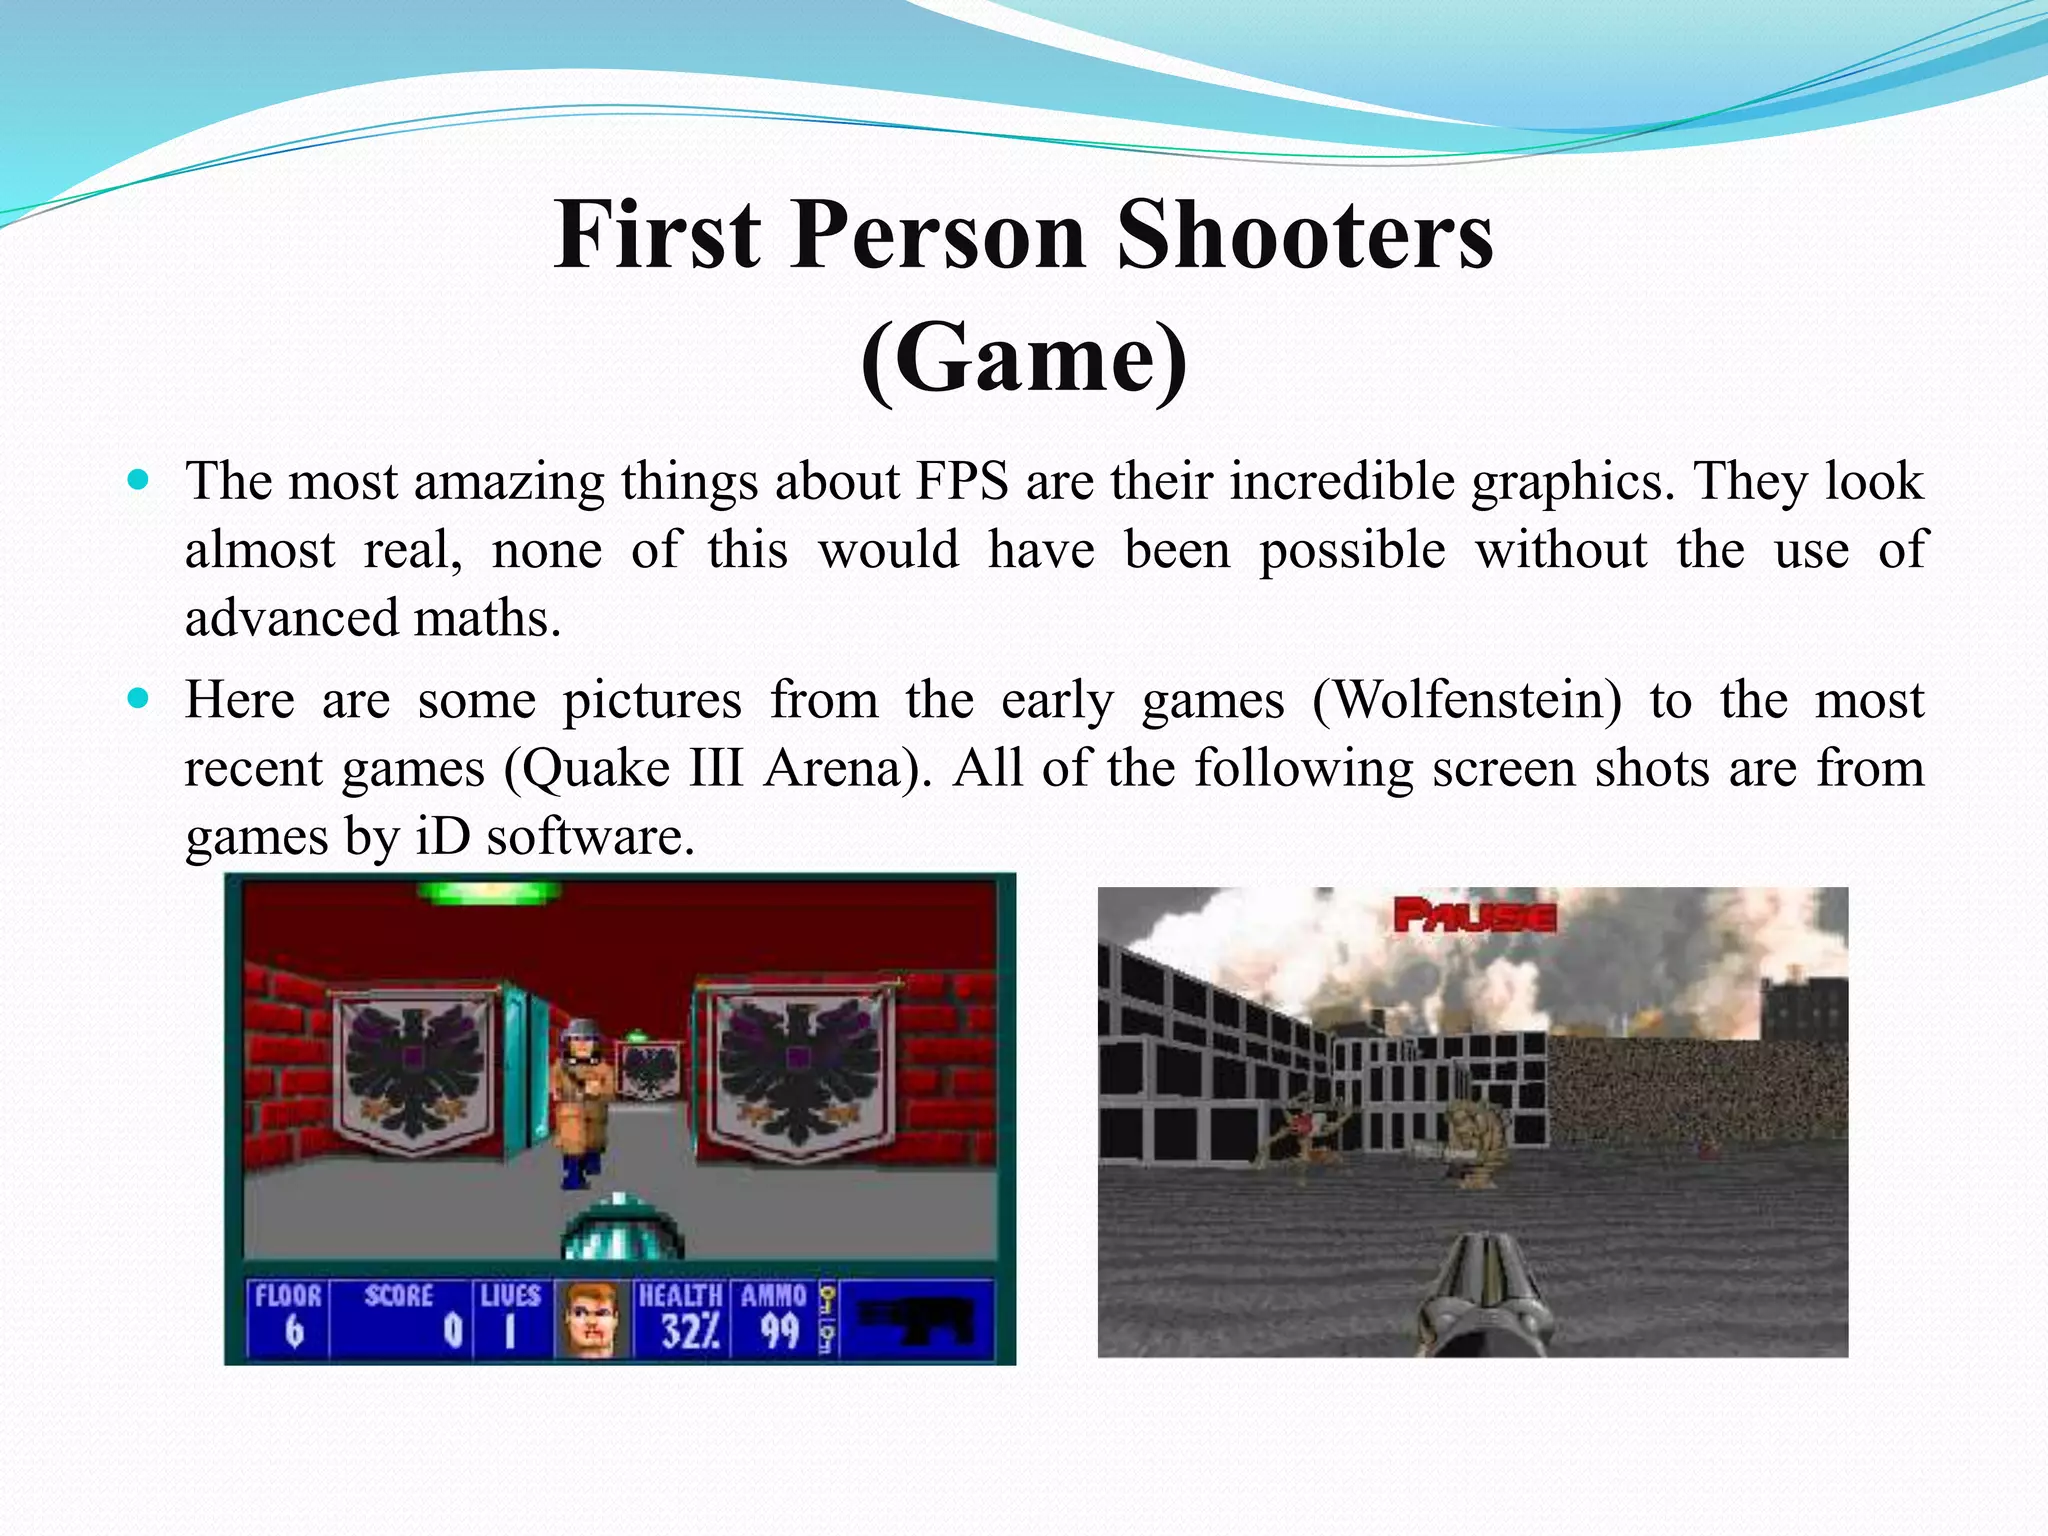
First Person Shooters
(Game)
The most amazing things about FPS are their incredible graphics. They look
almost real, none of this would have been possible without the use of
advanced maths.
Here are some pictures from the early games (Wolfenstein) to the most
recent games (Quake III Arena). All of the following screen shots are from
games by iD software.
103.
Most ofthe time the math you learned in high school and college is no
different than what was used to design a game.
To name a few, some of the common branches of math utilized in game
development include:
Algebra
Trigonometry
Linear Algebra
Discrete Mathematics
And more …
More specific elements of math almost always used in games include:
Matrices
Delta time
Unit and scaling vectors
Dot and cross products
And scalar manipulation
105.
Maths In Biotechnology
Like calculus , linear algebra , graph geometry ,equation and coding theory
is used for finding the estimation of DNA , there is use of maths Calculate
the composition of any culture
Big role in bioinformatics , matching deleting sequence of DNA during the
process , biostatistics are used in respect to maths like finding the previous
data of any research or stored data , we can find mean, median , statistics
“Mathematics is biology’s next microscope” and “Biology is Mathematics
next Physics”.
107.
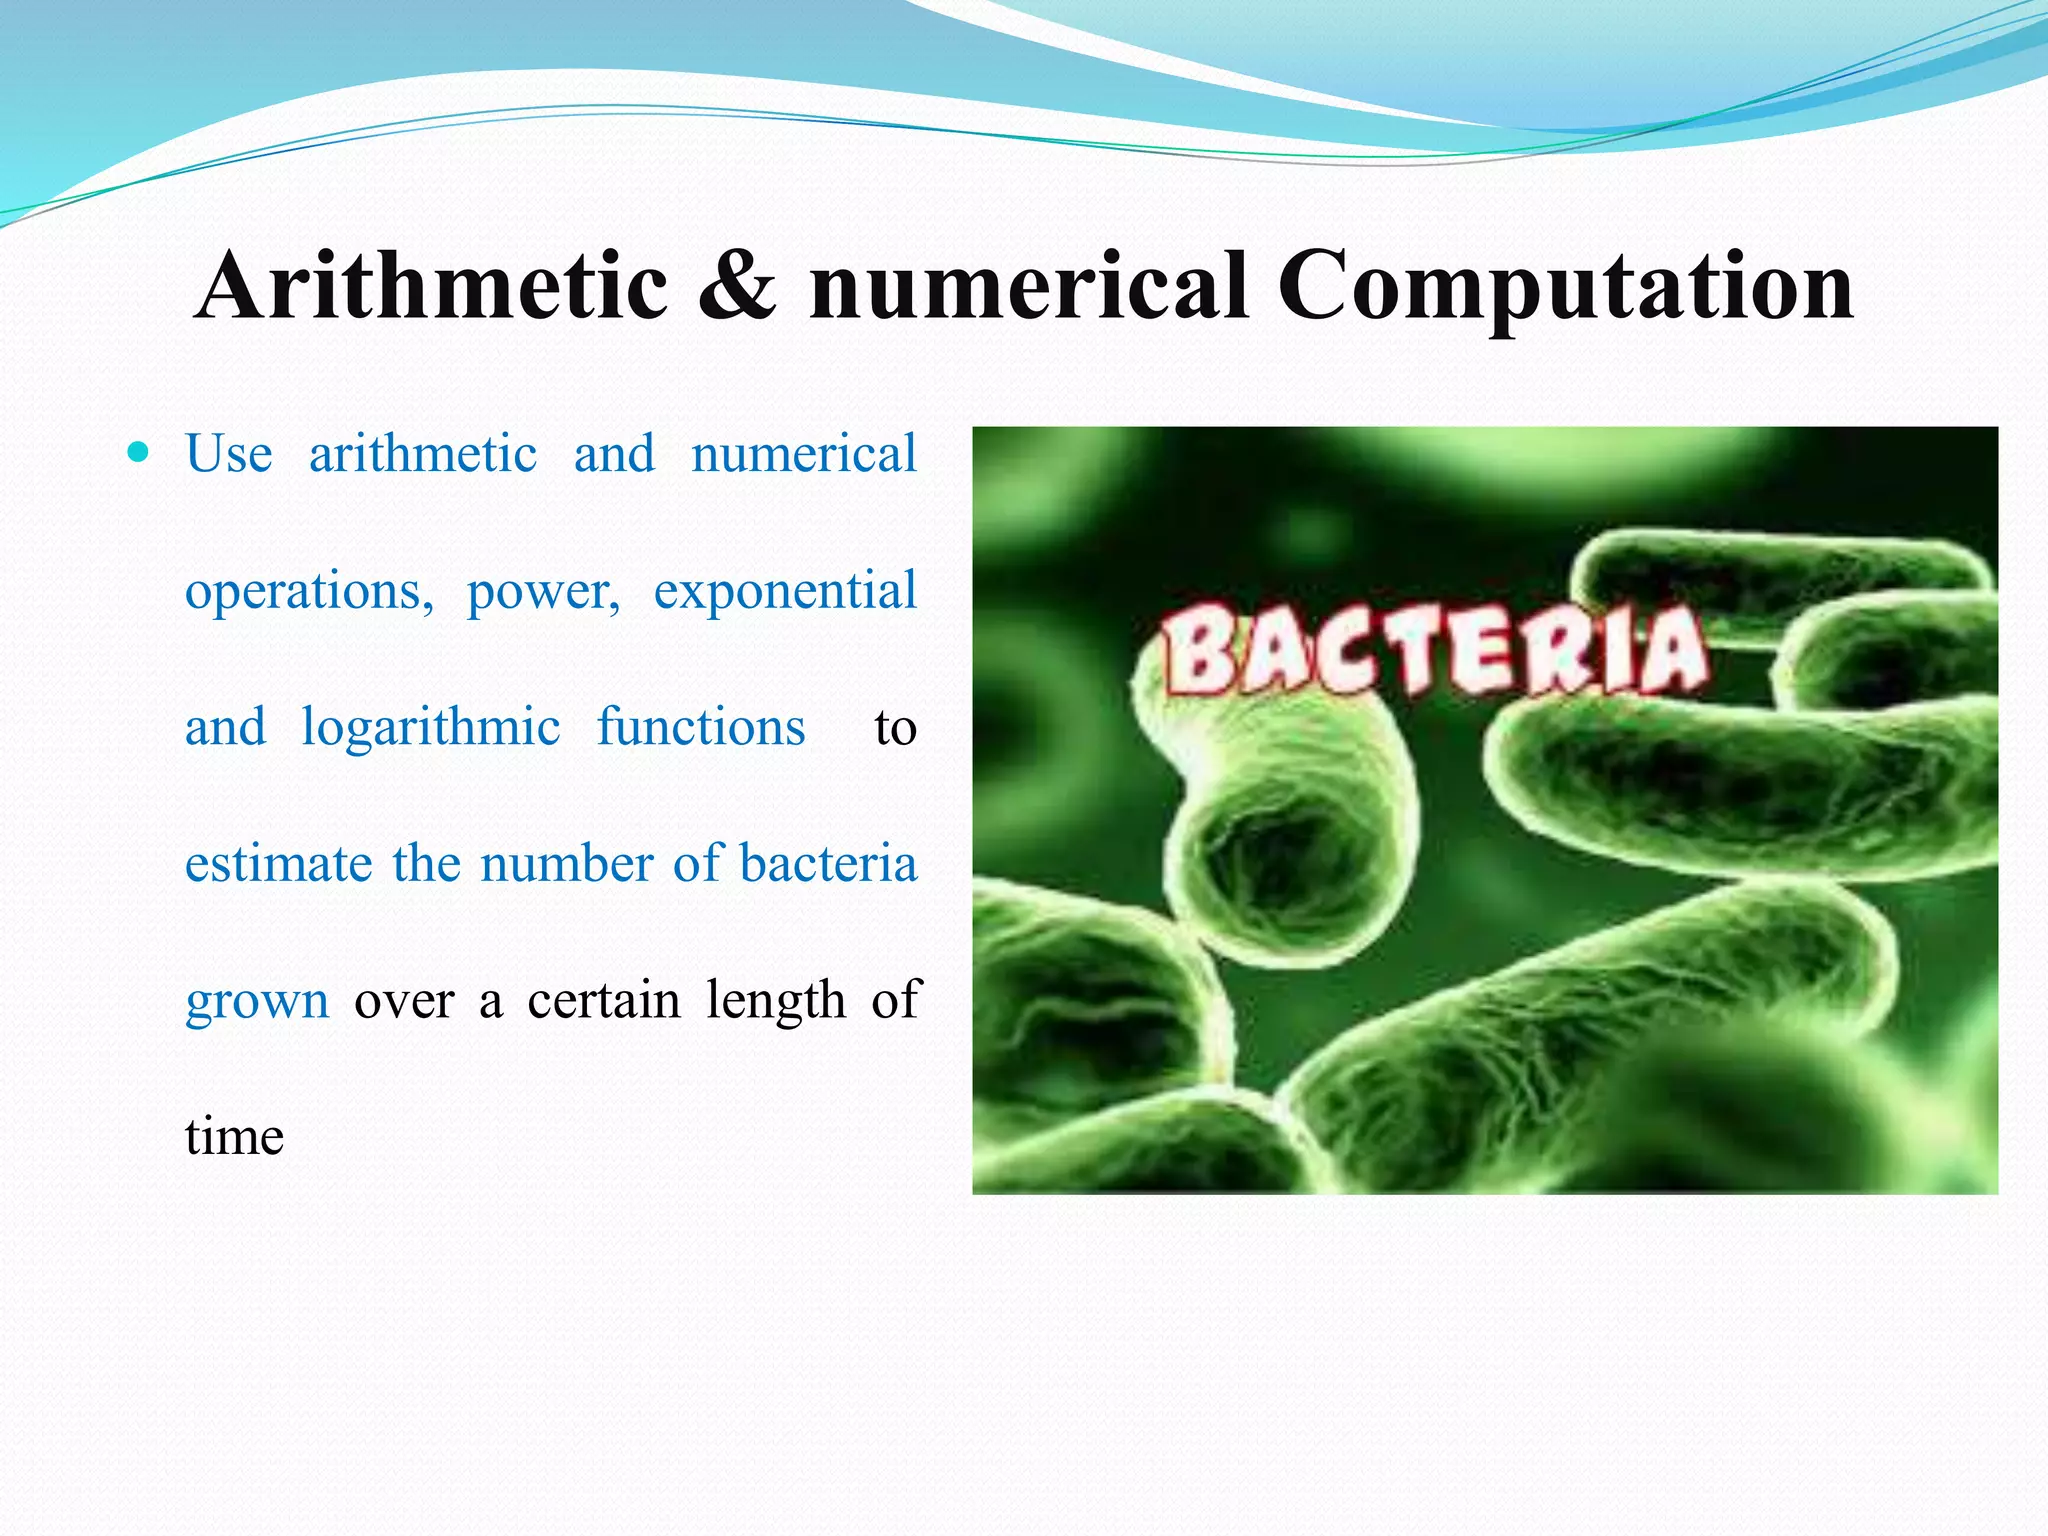
Arithmetic & numericalComputation
Use arithmetic and numerical
operations, power, exponential
and logarithmic functions to
estimate the number of bacteria
grown over a certain length of
time
108.
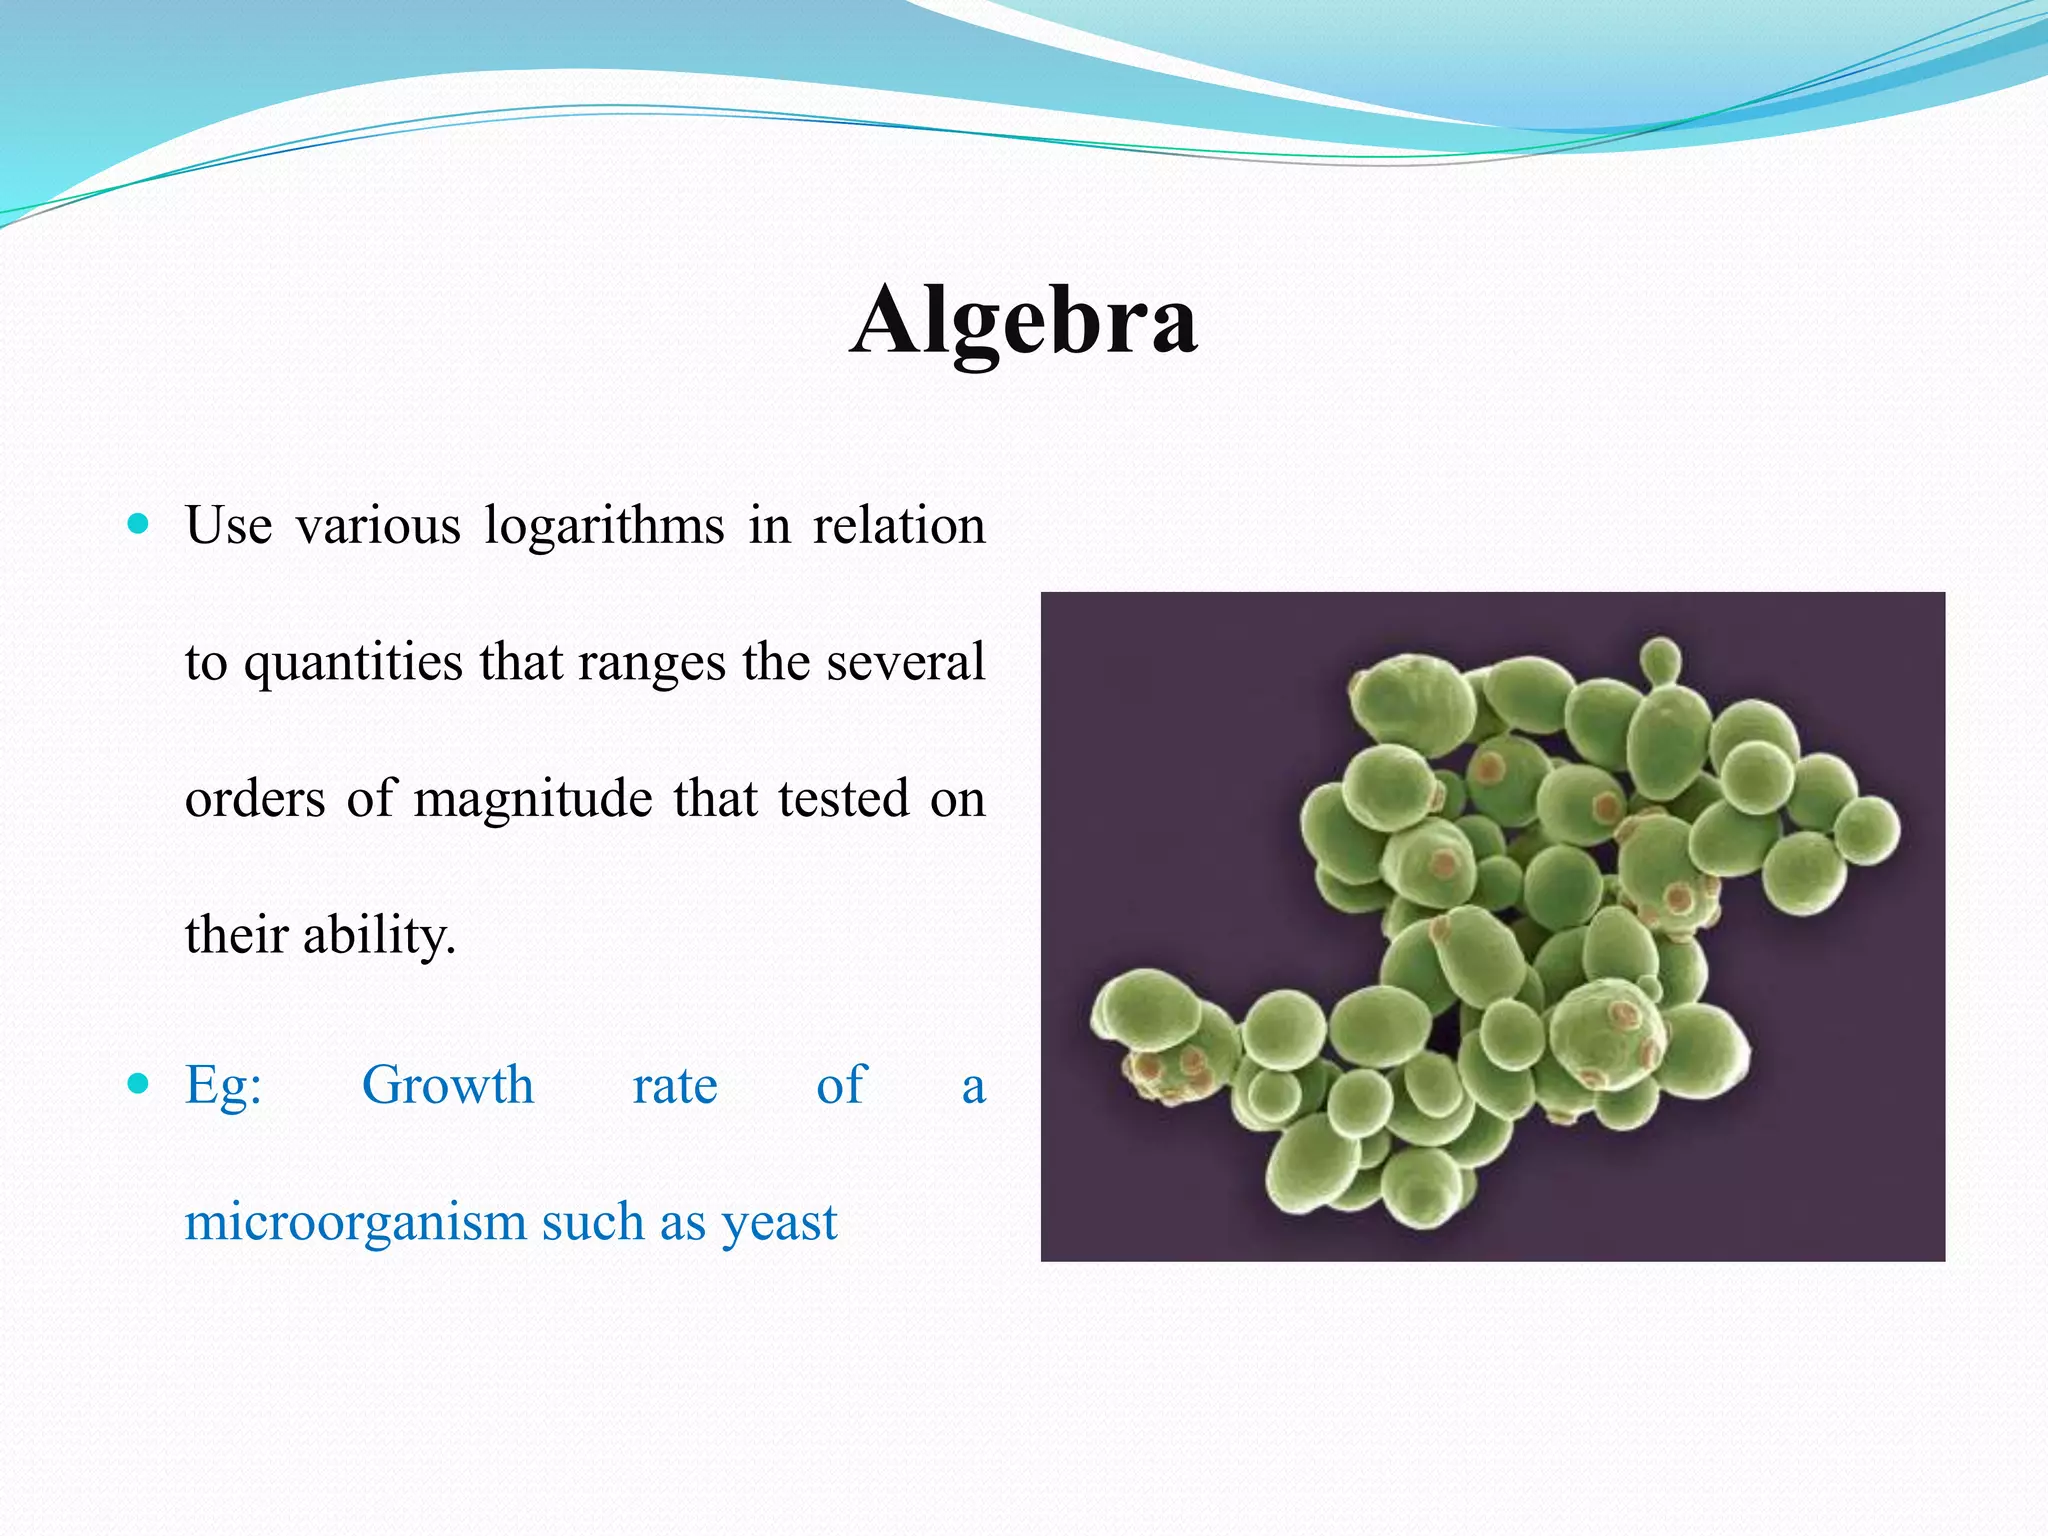
Algebra
Use variouslogarithms in relation
to quantities that ranges the several
orders of magnitude that tested on
their ability.
Eg: Growth rate of a
microorganism such as yeast
109.
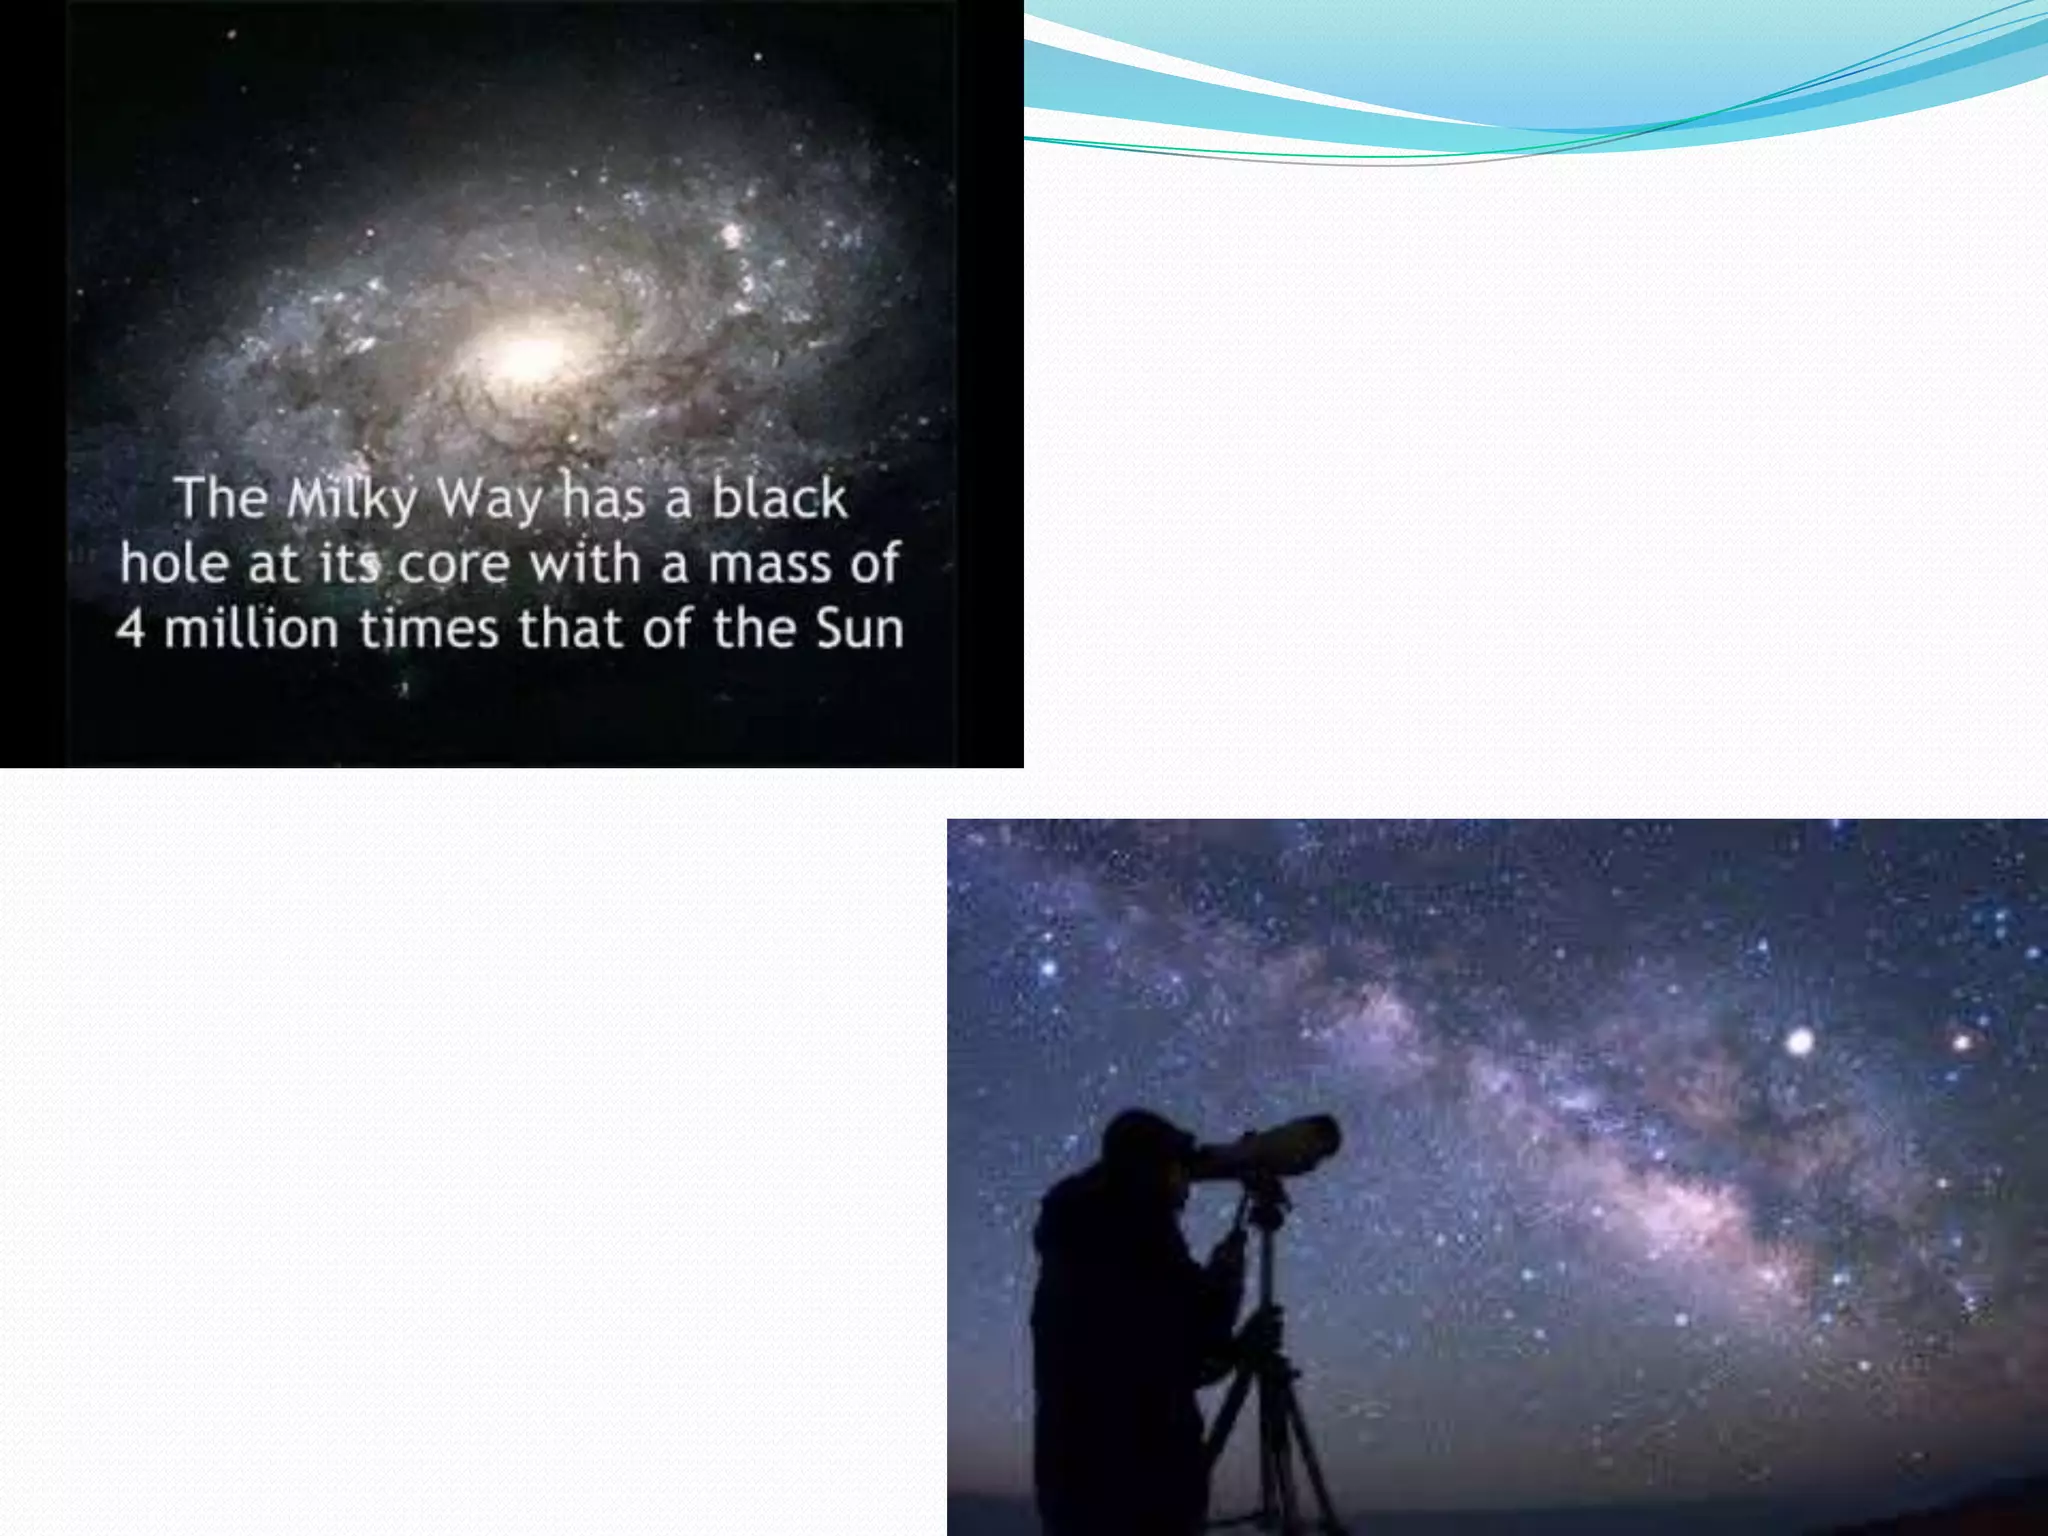
Maths in Astronomy
Astronomers use maths all the time.
It is used to perform calculations when we look at the objects in the sky
with a telescope.
Some interesting facts
– Our galaxy milkyway is about 100 * 10 ^ 3 light years wide
– Moon is about150 million km from the sun
– The diameter of our planet Earth is 12742 km
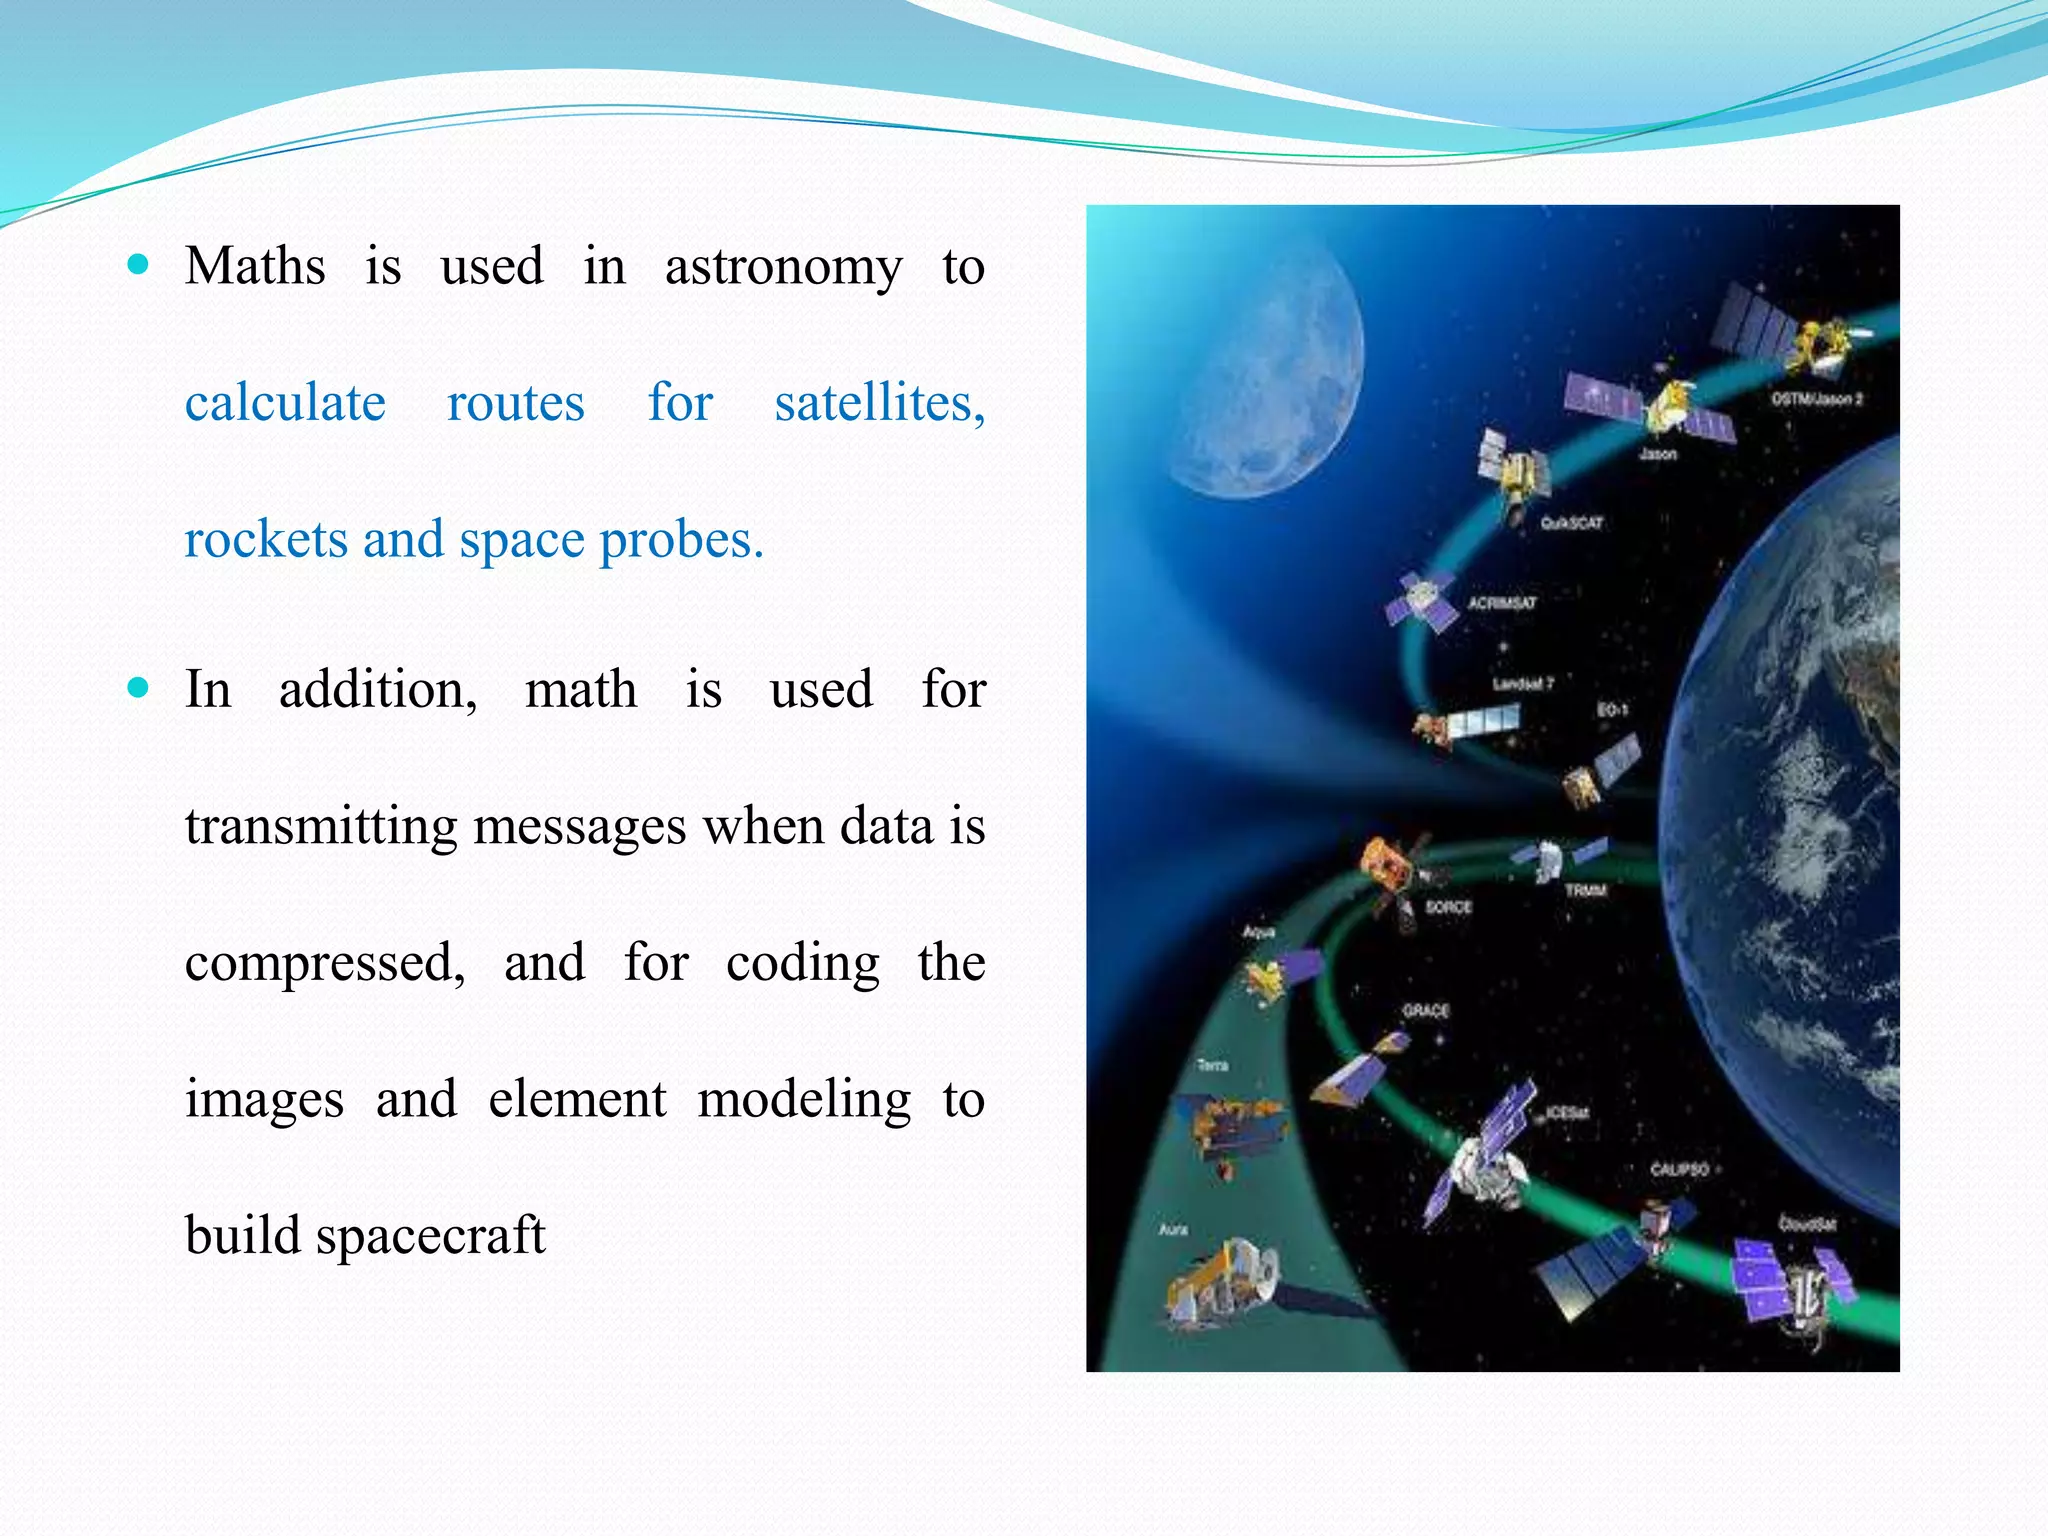
111.
Maths isused in astronomy to
calculate routes for satellites,
rockets and space probes.
In addition, math is used for
transmitting messages when data is
compressed, and for coding the
images and element modeling to
build spacecraft
112.
Maths in Mechanics
Mechanical Engineers use Maths with analytical and problem solving
abilities to develop or repair new machines.
The general study of the relationship between motion, forces and energy is
called Mechanics.
Examples of application of maths in mechanics
– Speed is measured as distance travelled / time taken
– Force exerted = Mass x Acceleration
– Gravity of Earth is 9.8 metres / second
113.
Maths in Chemistry
Chemists use math for a variety of tasks.
They balance the equation of a chemical reaction, use mathematical
calculations that are absolutely necessary to explore important concepts in
chemistry.
Math is also used to calculate energy in reactions, compression of a gas,
grams needed to add to a solution to reach desired concentration, and
quantities of reactants needed to reach a desired product.
115.
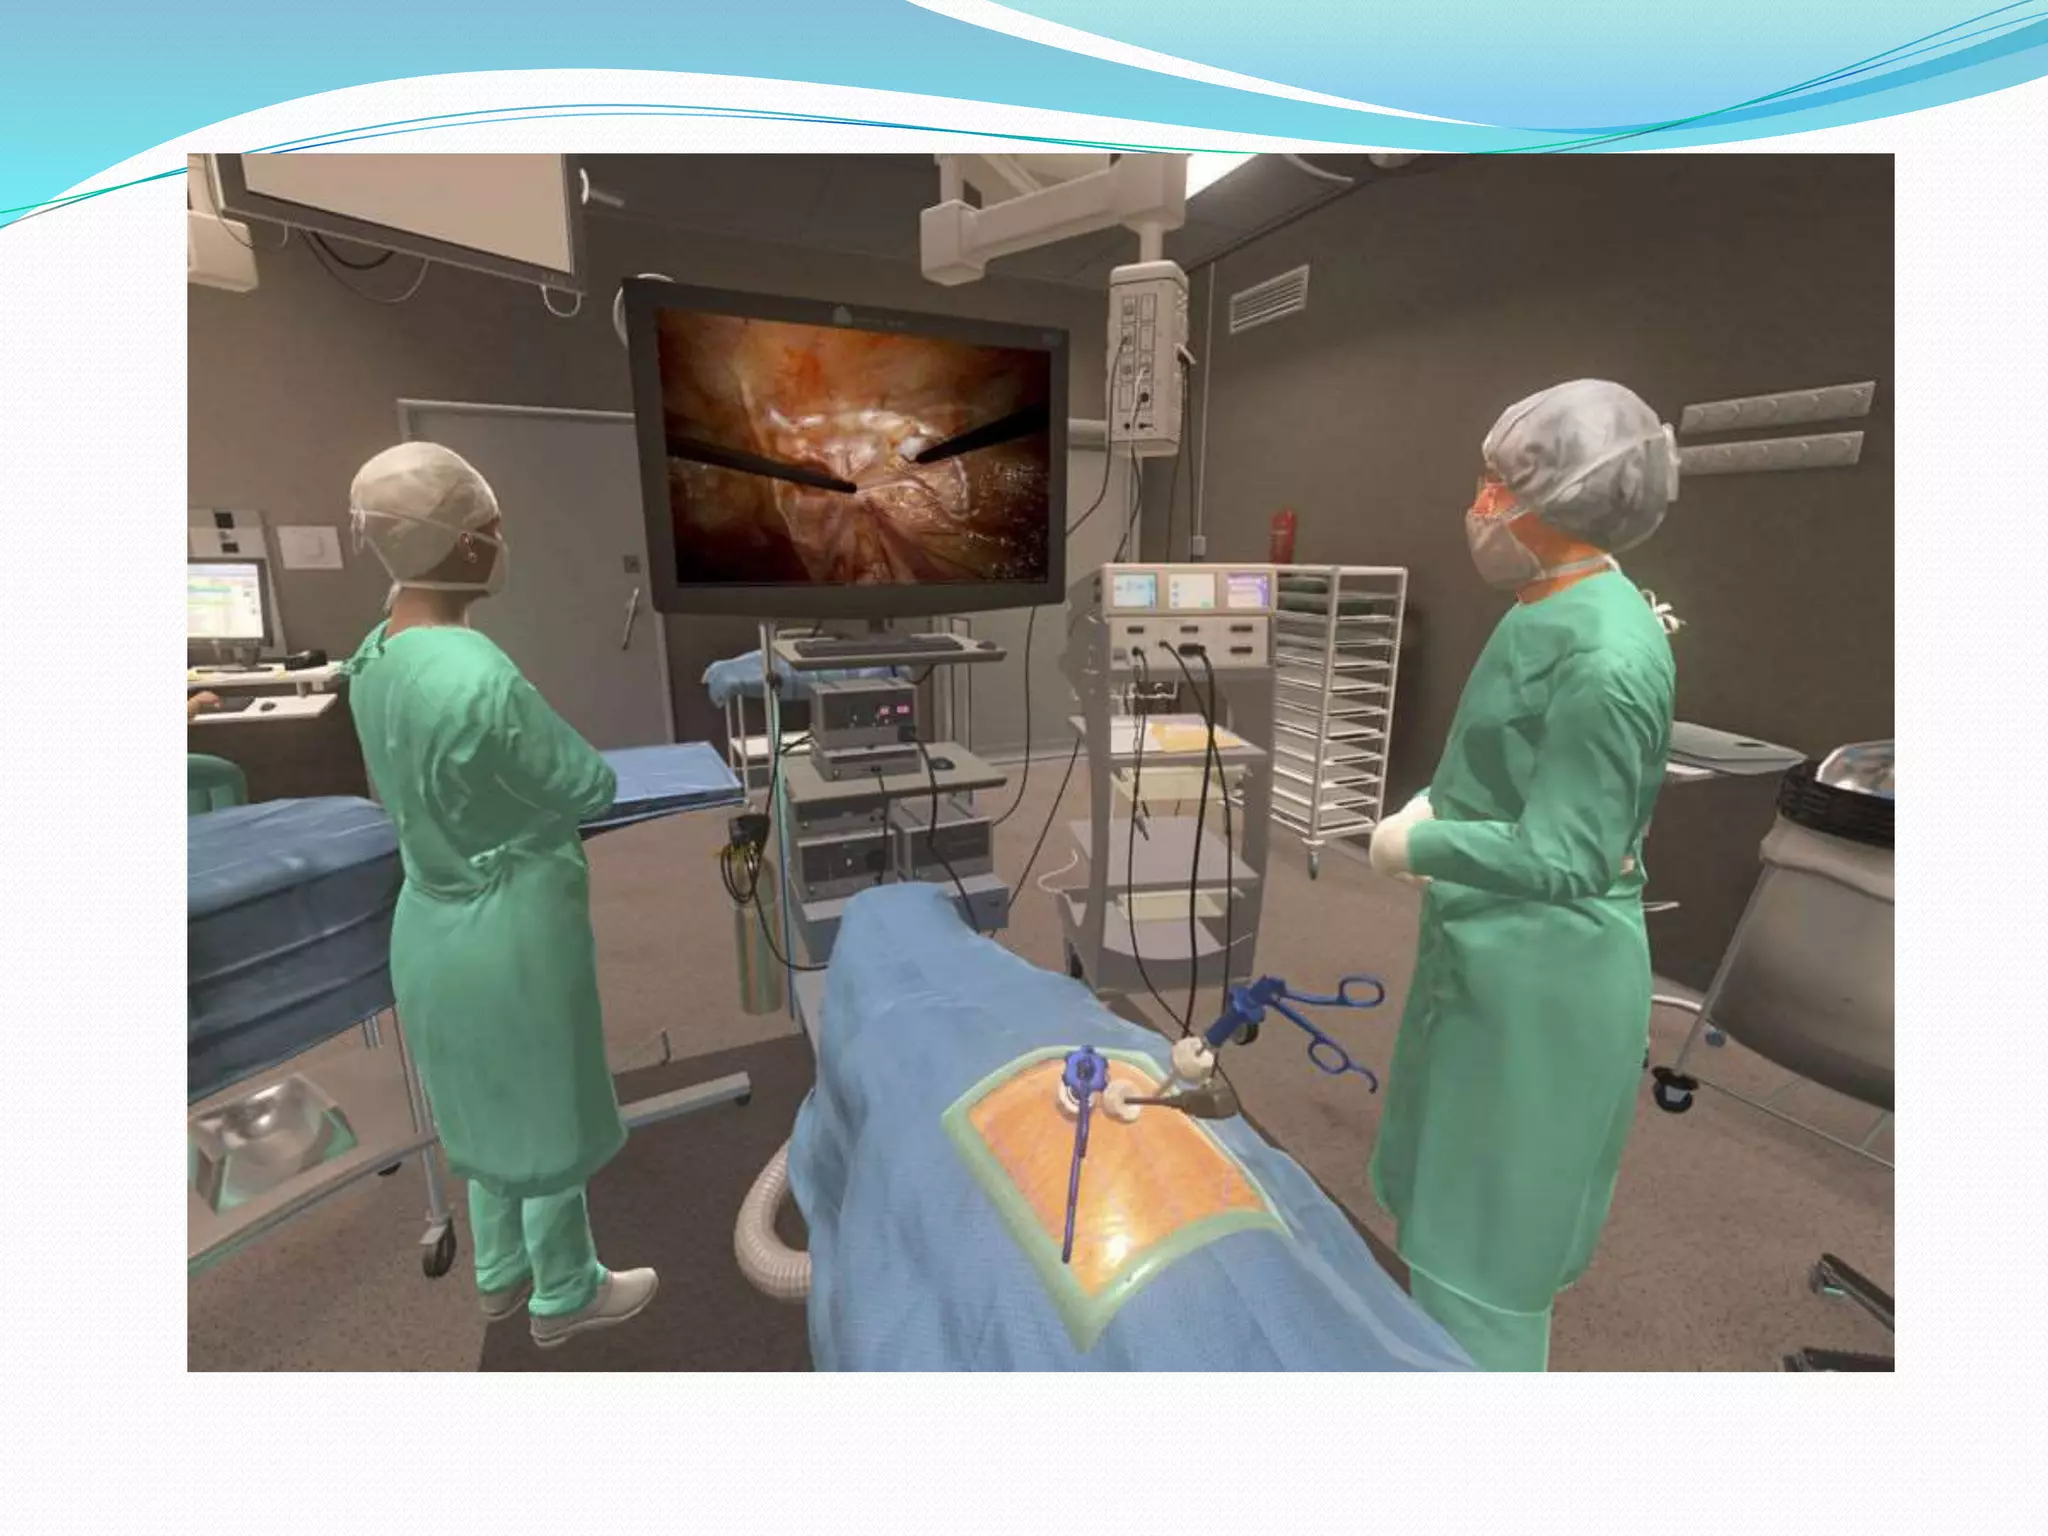
Maths in Medicine
Medical professionals use math when drawing up statistical graphs of
epidemics or success rates of treatments. Math applies to x-rays and CAT
scans.
... It is reassuring for the general public to know that our doctors and nurses
have been properly trained by studying mathematics and its uses for
medicine.
118.
Maths in Physics
Physics is probably the one area of science where many aspects of maths
has been directly applied
Some of the important in Physics are:
– Classical Mechanics (Calculus)
– Electro Magnetism (Vector Calculus)
– General Relativity (Differential Geometry)
– Quantum Field Theory ( Matrices, Group Theory)
– SuperstringTheory (Know Theory)
119.
Engineering Applications
Electrical Engineering(A.C. Circuits):
Resistors, inductors, capacitors, power engineering, analysis of electric
magnetic fields and their interactions with materials and structures
Electronics:
Digital signal processing, image processing.
120.
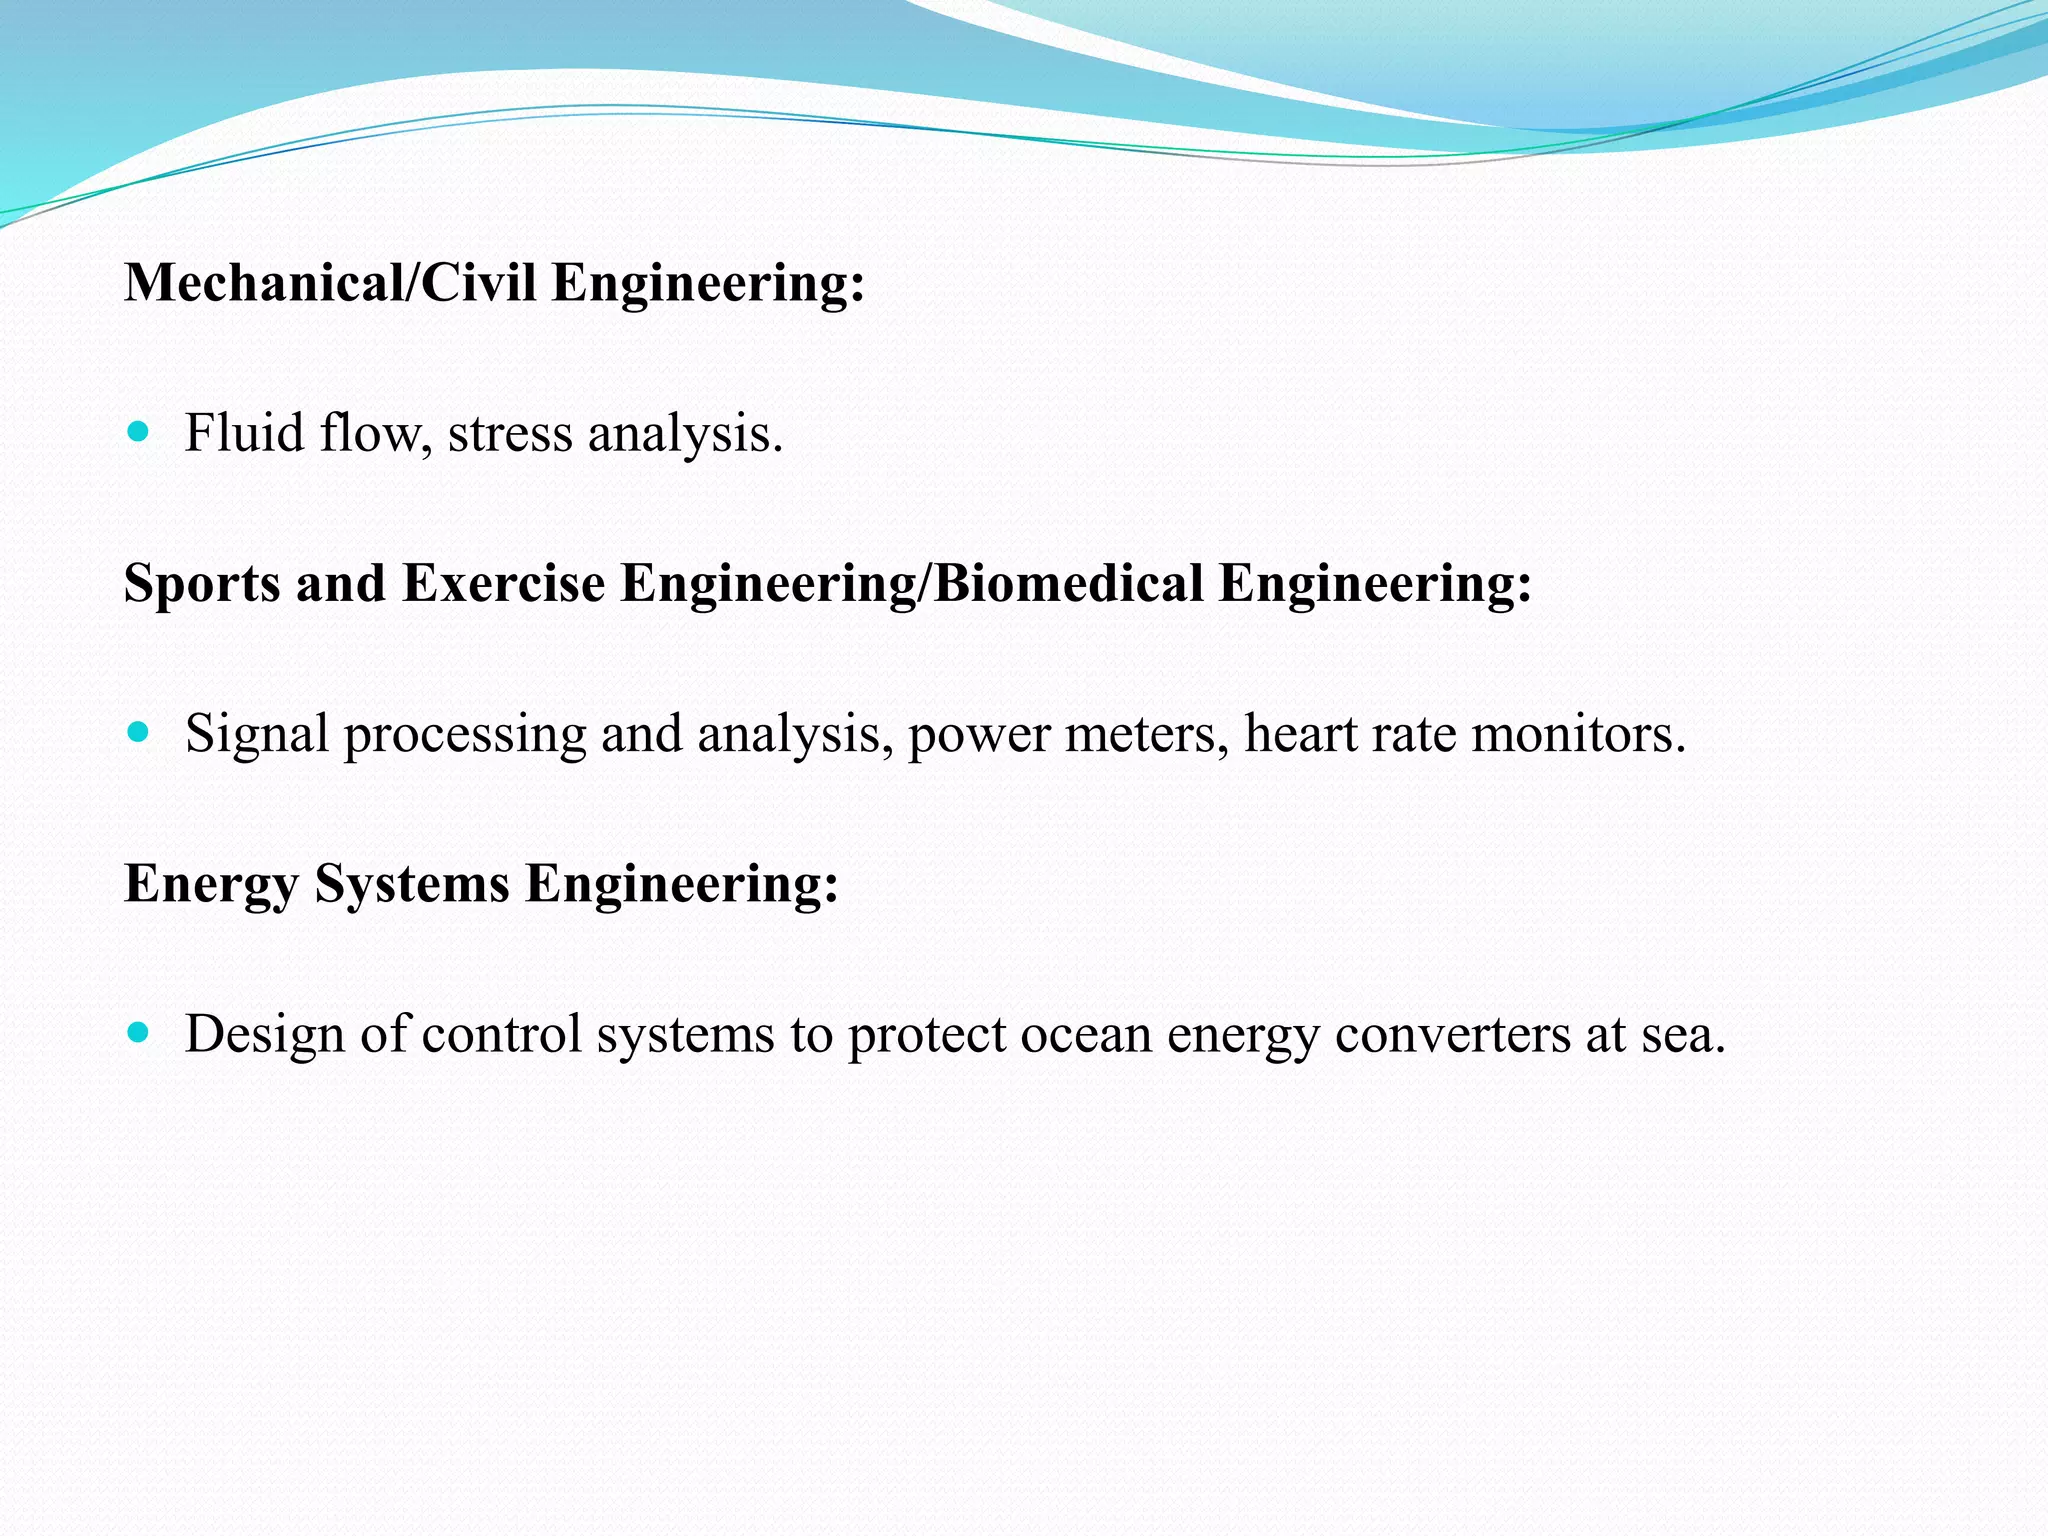
Mechanical/Civil Engineering:
Fluidflow, stress analysis.
Sports and Exercise Engineering/Biomedical Engineering:
Signal processing and analysis, power meters, heart rate monitors.
Energy Systems Engineering:
Design of control systems to protect ocean energy converters at sea.
121.
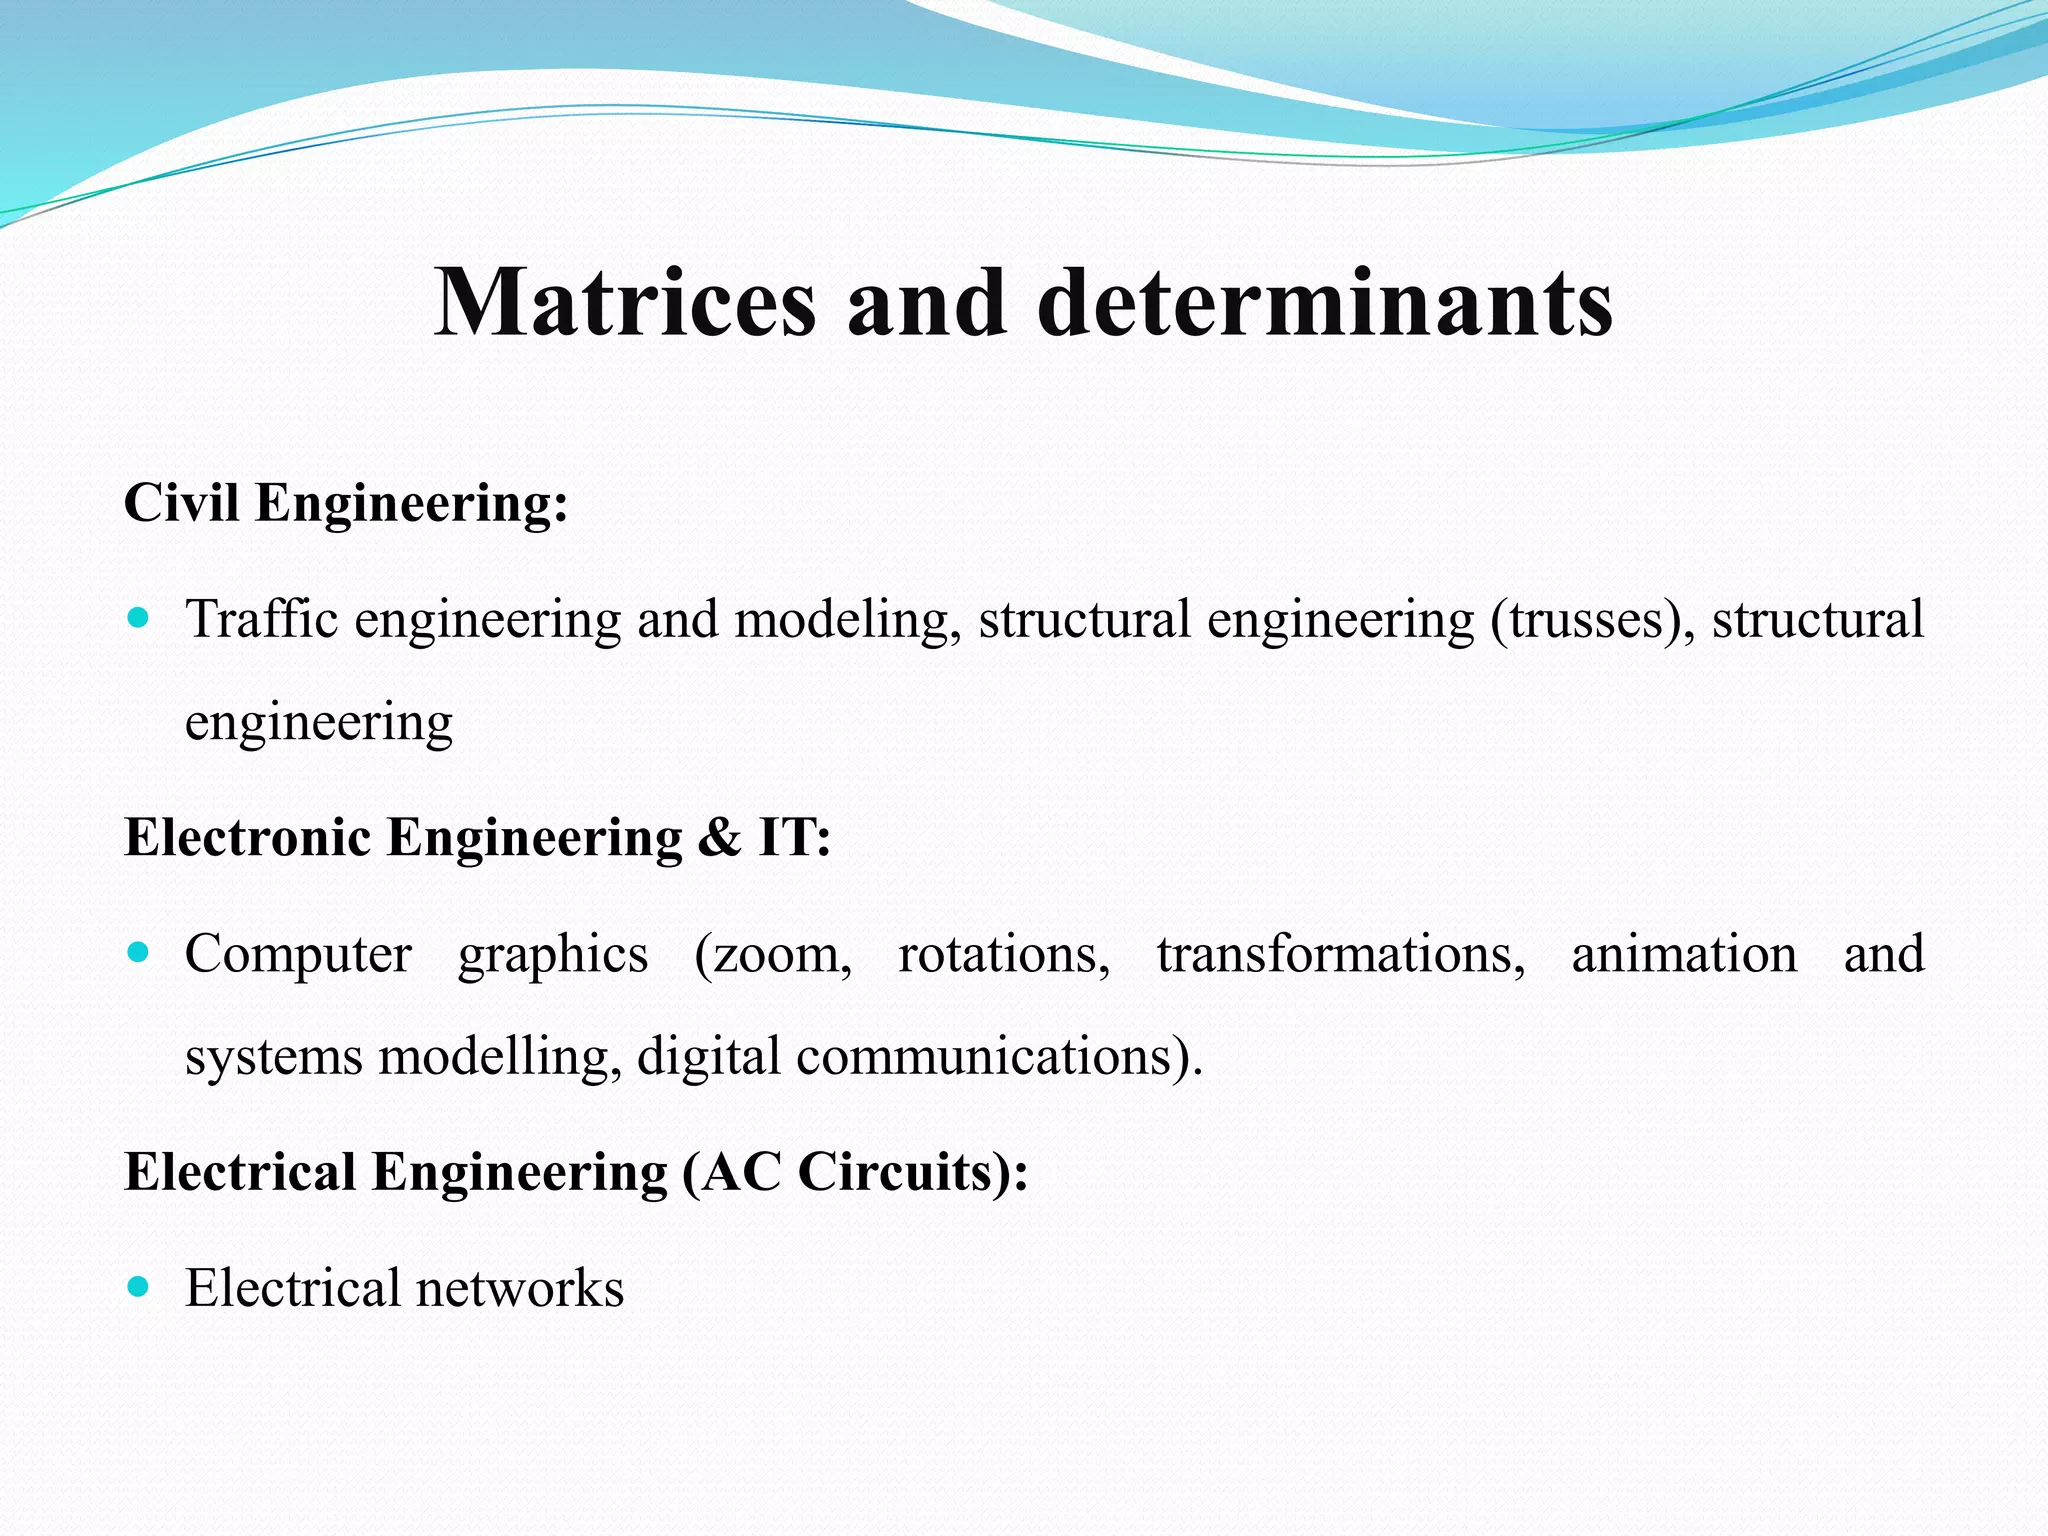
Matrices and determinants
CivilEngineering:
Traffic engineering and modeling, structural engineering (trusses), structural
engineering
Electronic Engineering & IT:
Computer graphics (zoom, rotations, transformations, animation and
systems modelling, digital communications).
Electrical Engineering (AC Circuits):
Electrical networks
122.
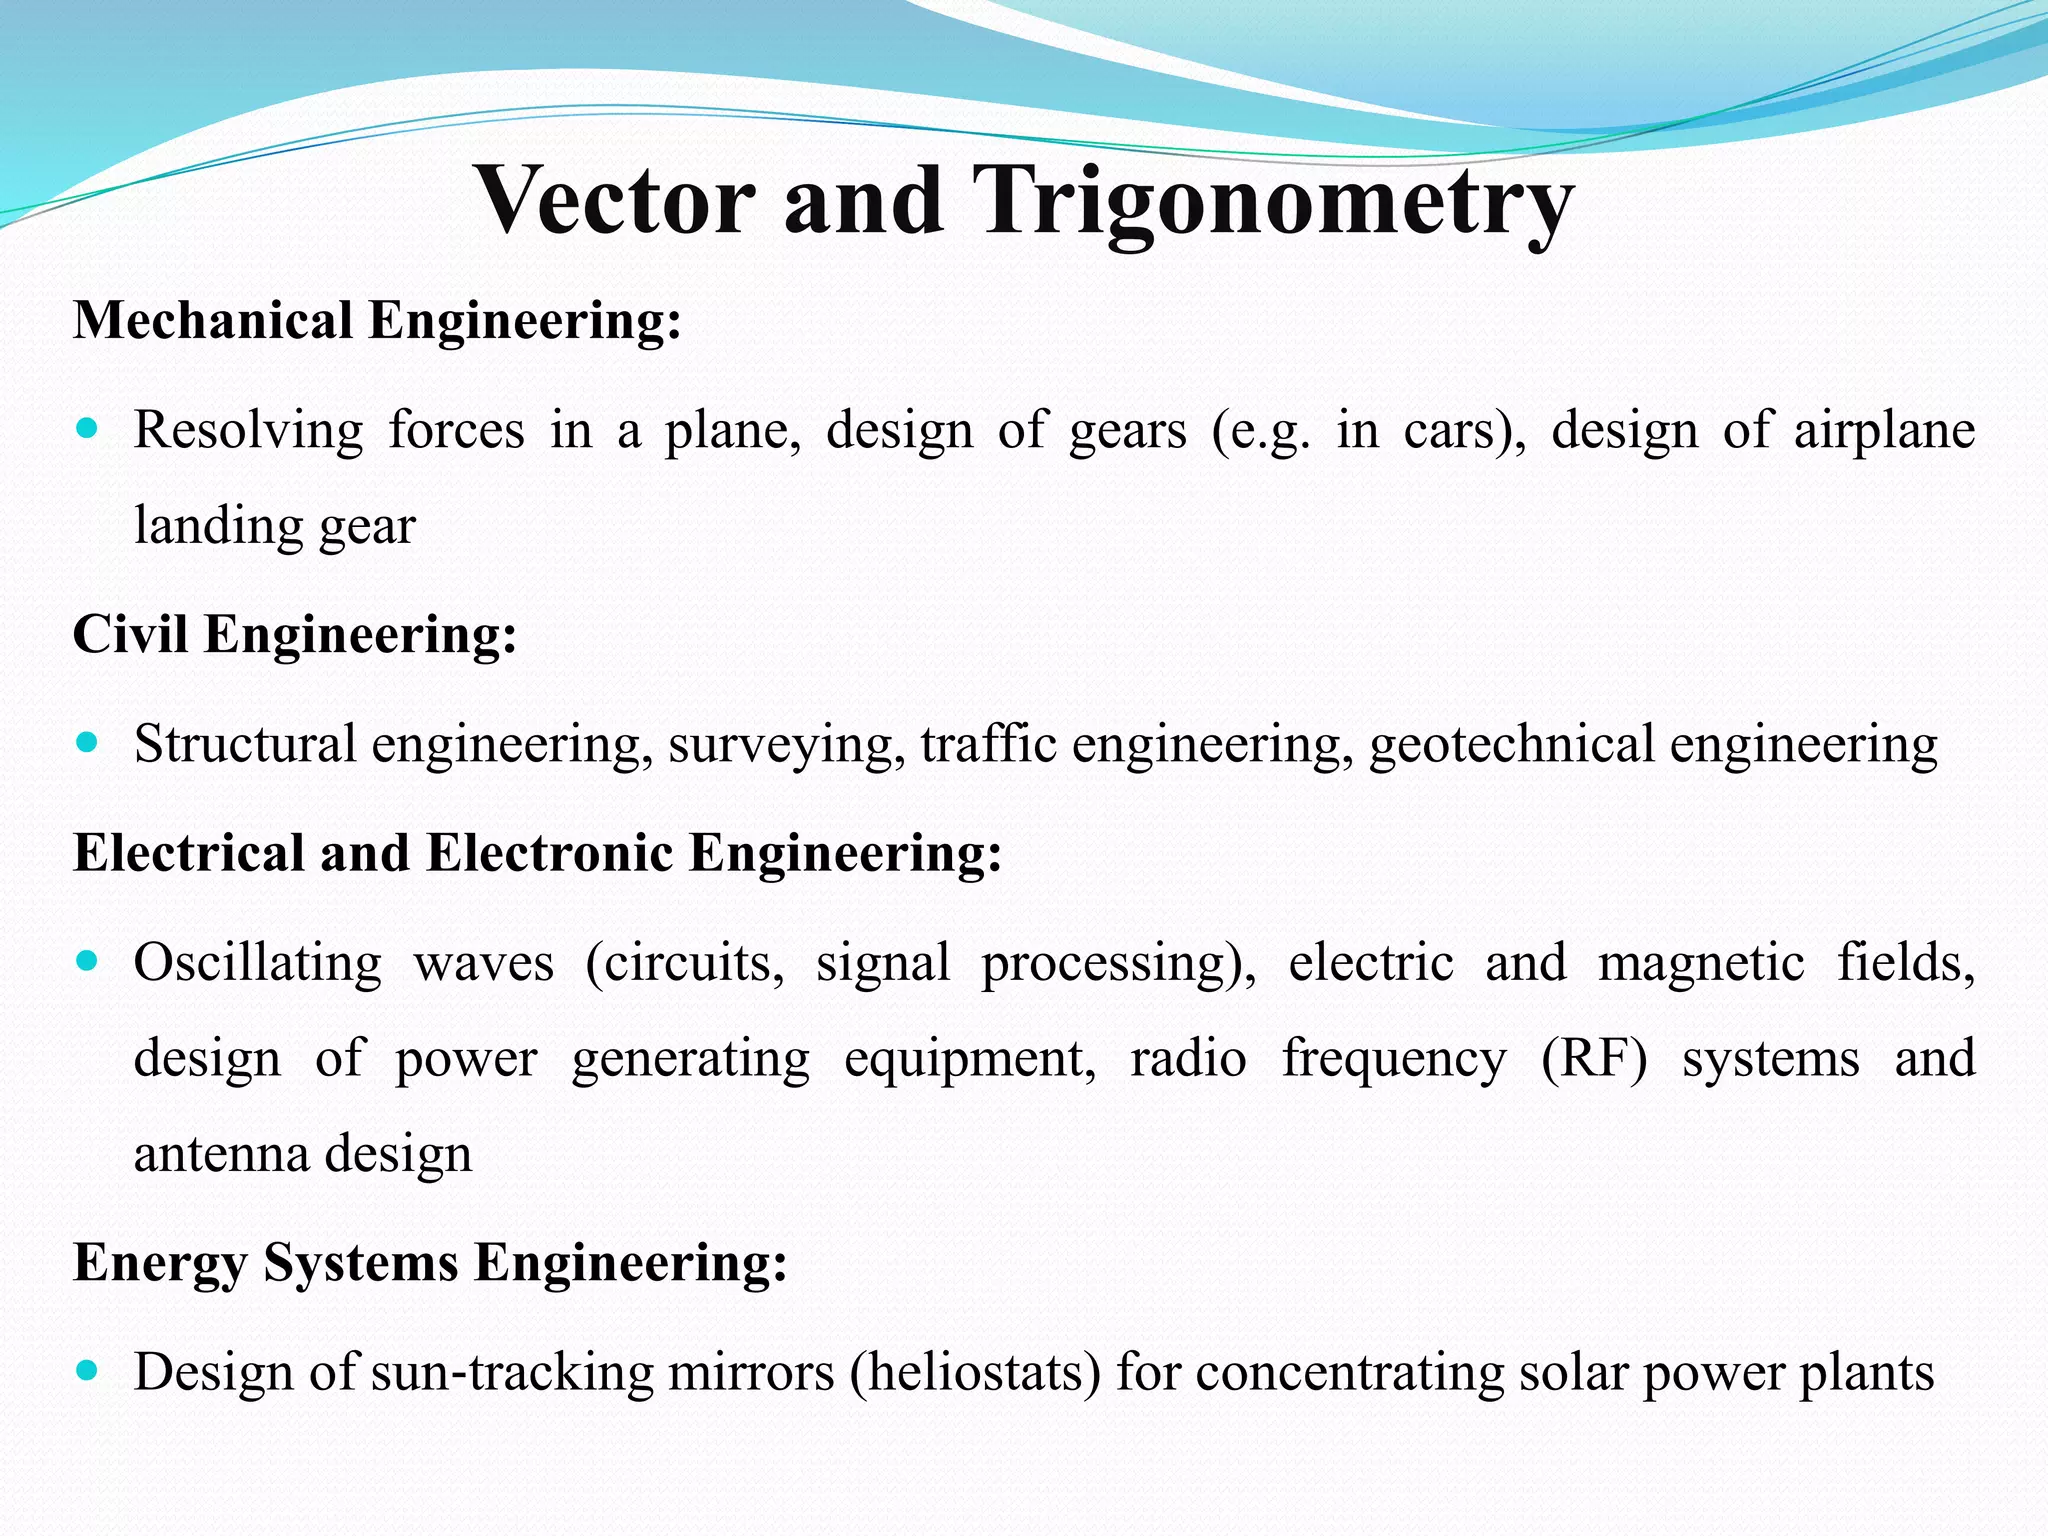
Vector and Trigonometry
MechanicalEngineering:
Resolving forces in a plane, design of gears (e.g. in cars), design of airplane
landing gear
Civil Engineering:
Structural engineering, surveying, traffic engineering, geotechnical engineering
Electrical and Electronic Engineering:
Oscillating waves (circuits, signal processing), electric and magnetic fields,
design of power generating equipment, radio frequency (RF) systems and
antenna design
Energy Systems Engineering:
Design of sun‐tracking mirrors (heliostats) for concentrating solar power plants