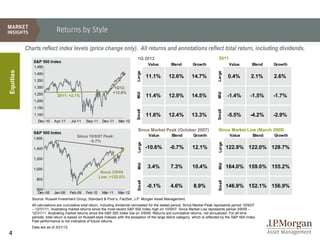
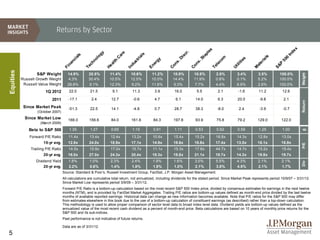
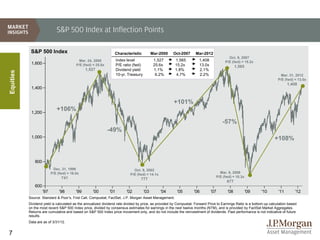
2Q | 2012
                 As of March 31, 2012


Guide to the Markets
Table of Contents


     EQUITIES                                                                 4

     ECONOMY                                                                  16

     FIXED INCOME                                                             32

     INTERNATIONAL                                                            40

     ASSET CLASS                                                              51


    U.S. Market Strategy Team
    Dr. David P. Kelly, CFA                  david.p.kelly@jpmorgan.com
    Andrew D. Goldberg                       andrew.d.goldberg@jpmorgan.com
    Joseph S. Tanious, CFA                   joseph.s.tanious@jpmorgan.com
    Andrés Garcia-
    Andr és Garcia-Amaya                     andres.d.garcia@jpmorgan.com
    Brandon D. Odenath                       brandon.d.odenath@jpmorgan.com
    David M. Lebovitz                        david.m.lebovitz@jpmorgan.com

    www.jpmorganfunds.com/mi

    Past performance is no guarantee of comparable future results.
2
Page Reference

     Equities                                                       Fixed Income
    4.    Returns by Style                                         32.   Fixed Income Sector Returns
    5.    Returns by Sector                                        33.   Interest Rates and Inflation
    6.    U.S. Equity Indexes                                      34.   Fixed Income Yields and Returns
    7.    S&P 500 Index at Inflection Points                       35.   The Fed and the Money Supply
    8.    Equity Scenarios: Bull, Bear and In-between              36.   Credit Conditions
    9.    Investment Style Valuations                              37.   High Yield Bonds
    10.   Stock Valuation Measures: S&P 500 Index                  38.   Municipal Finance
    11.   Earnings Estimates and Multiples                         39.   Emerging Market Debt
    12.   Earnings Drivers and Shareholder Distributions
    13.   Broad Market Lagged Price to Earnings Ratio               International
    14.   P/E Ratios and Equity Returns                            40.   Global Equity Markets: Returns and Composition
    15.   Equity Correlations and Volatility                       41.   Global Economic Growth
                                                                   42.   Global Monetary Policy
     Economy
                                                                   43.   The Importance of Exports
    16.   Economic Growth and the Composition of GDP               44.   The Impact of Global Consumers
    17.   Cyclical Sectors                                         45.   European Crisis: Fiscal Challenges
    18.   Consumer Finances                                        46.   European Crisis: Financial System Risks
    19.   Federal Finances                                         47.   Chinese Growth and Economic Policy
    20.   Federal Revenues, Outlays and Tax Rates                  48.   Global Equity Valuations – Developed and Emerging Markets
    21.   Political Perception and Economic Reality                49.   International Economic and Demographic Data
    22.   The Aftermath of the Housing Bubble                      50.   Current Account Deficit and U.S. Dollar
    23.   Employment
    24.   Employment by Sector and Education                        Asset Class
    25.   Corporate Profits                                        51.   Asset Class Returns
    26.   Consumer Price Index                                     52.   Correlations: 10-Years
    27.   Returns in Different Inflation Environments – 40 years   53.   Mutual Fund Flows
    28.   Oil and the Economy                                      54.   Dividend Income: Domestic and Global
    29.   Global Oil Supply                                        55.   Global Commodities
    30.   Consumer Confidence and the Stock Market                 56.   Gold
    31.   Confidence and the Capital Markets                       57.   Historical Returns by Holding Period
                                                                   58.   Diversification and the Average Investor
                                                                   59.   Annual Returns and Intra-year Declines
                                                                   60.   Alternative Investment Returns
                                                                   61.   Cash Accounts
                                                                   62.   Corporate DB Plans and Endowments
3
Returns by Style

           Charts reflect index levels (price change only). All returns and annotations reflect total return, including dividends.
                                                                                 1Q 2012                                              2011
              S&P 500 Index
                                                                                          Value        Blend         Growth                    Value       Blend   Growth
               1,450
Equities


                                                                                 Large


                                                                                                                                     Large
               1,400
                                                                                          11.1%      12.6%          14.7%                     0.4%        2.1%     2.6%
               1,350
               1,300                                               1Q12:
                                                                  +12.6%


                                                                                 Mid


                                                                                                                                     Mid
               1,250          2011: +2.1%                                                 11.4%      12.9%          14.5%                     -1.4%       -1.5%    -1.7%
               1,200
               1,150


                                                                                 Small


                                                                                                                                     Small
               1,100                                                                      11.6%      12.4%          13.3%                     -5.5%       -4.2%    -2.9%
                 Dec-10     Apr-11      Jul-11   Sep-11    Dec-11    Mar-12

                                                                                  Since Market Peak (October 2007)                    Since Market Low (March 2009)
               S&P 500 Index
                                           Since 10/9/07 Peak:                             Value       Blend         Growth                    Value       Blend   Growth
               1,600
                                                  -0.7%                           Large


                                                                                                                                      Large
               1,400                                                                      -10.6%      -0.7%          12.1%                    122.9% 122.0% 128.7%

               1,200
                                                                                  Mid


                                                                                                                                      Mid
               1,000
                                                                                          3.4%         7.3%          10.4%                    164.0% 159.0% 155.2%
                                                           Since 3/9/09
                                                          Low: +122.0%
                800
                                                                                  Small


                                                                                                                                      Small
                                                                                          -0.1%        4.6%          8.9%                     146.9% 152.1% 156.9%
                600
                 Dec-06     Jan-08      Feb-09   Feb-10    Mar-11    Mar-12
              Source: Russell Investment Group, Standard & Poor’s, FactSet, J.P. Morgan Asset Management.
              All calculations are cumulative total return, including dividends reinvested for the stated period. Since Market Peak represents period 10/9/07
              – 12/31/11, illustrating market returns since the most recent S&P 500 Index high on 10/9/07. Since Market Low represents period 3/9/09 –
              12/31/11, illustrating market returns since the S&P 500 Index low on 3/9/09. Returns are cumulative returns, not annualized. For all time
              periods, total return is based on Russell-style indexes with the exception of the large blend category, which is reflected by the S&P 500 Index.
              Past performance is not indicative of future returns.
              Data are as of 3/31/12.
4
Returns by Sector


                                                                                                                                                                                            x
                                                                                                                                        es


                                                                                                                                                                                         de
                                                                                                                        r.
                                                               y


                                                                                e


                                                                                                                                          l
                                                                                                                                       ap
                                                                                                                      sc


                                                                                                                                                                                       In
                                                                                            ls
                                                            og


                                                                              ar
                                             ls


                                                                                                                                                                          ls
                                                                                         ria
                                           ia


                                                                                                                   Di


                                                                                                                                                    m
                                                                          C


                                                                                                                                    St


                                                                                                                                                                                   0
                                                         ol


                                                                                                                                                            es


                                                                                                                                                                       ia


                                                                                                                                                                                 50
                                                                                                     gy
                                         nc


                                                                                                                                                  co
                                                                         th


                                                                                       st
                                                        n


                                                                                                              s.


                                                                                                                               s.


                                                                                                                                                                     er
                                                                                                                                                           iti
                                                     ch


                                                                                                  er
                                                                                     du
                                                                      al
                                       na


                                                                                                                                                                                 P
                                                                                                                                                le
                                                                                                               n


                                                                                                                                n


                                                                                                                                                                   at
                                                                                                                                                           il


                                                                                                                                                                               S&
                                                                                                 En


                                                                                                            Co


                                                                                                                             Co
                                                                   He
                                                   Te


                                                                                                                                              Te


                                                                                                                                                        Ut
                                                                                    In
                                     Fi


                                                                                                                                                                   M
Equities


                   S&P Weight           14.9%         20.5%          11.4%           10.6%        11.2%      10.9%            10.8%             2.8%       3.4%        3.5%     100.0%


                                                                                                                                                                                                Weight
           Russell Growth Weight        4.3%          30.4%          10.5%           12.5%        10.0%      14.4%            11.9%             0.8%       0.1%        5.2%     100.0%
            Russell Value Weight        26.8%         9.1%           12.3%           9.2%         11.6%      9.3%             7.7%              4.4%       6.9%        2.6%     100.0%
                        1Q 2012          22.0          21.5            9.1               11.3         3.9     16.0              5.5              2.1       -1.6        11.2       12.6

                            2011        -17.1          2.4            12.7               -0.6         4.7      6.1             14.0              6.3       20.0        -9.8          2.1


                                                                                                                                                                                                Return
            Since Market Peak           -51.3          22.5           14.1               -4.8         0.7     28.7             38.3              -8.0       2.4        -3.9          -0.7
                    (October 2007)
             Since Market Low           166.0         156.6           84.0            161.6       84.3        197.8            93.9             75.8       79.2        129.0     122.0
                     (March 2009)

               Beta to S&P 500           1.35          1.27           0.65               1.15     0.91        1.11             0.53             0.92       0.58        1.25       1.00


                                                                                                                                                                                                 β
               Forward P/E Ratio        11.4x         13.4x           12.4x           13.2x       10.6x       15.4x            15.2x            16.8x      14.3x       12.8x      13.0x
                       15-yr avg.       12.9x         24.0x           18.9x           17.1x       14.9x       18.6x            18.8x            17.4x     13.5x        16.1x     16.9x


                                                                                                                                                                                                P/E
                Trailing P/E Ratio      14.5x         15.9x           17.0x           15.7x       11.1x       15.3x            17.8x            44.7x      14.7x       15.2x      15.4x
                       20-yr avg.       16.0x         27.0x           24.3x           20.4x       18.3x       19.8x            21.1x            18.7x     14.3x        19.8x     19.7x
                   Dividend Yield       1.8%          1.0%            2.3%            2.4%        1.9%        1.6%             3.0%             5.5%       4.3%        2.1%       2.1%


                                                                                                                                                                                                Div
                       20-yr avg.       2.2%          0.6%            1.4%            1.8%        1.9%        1.0%             2.1%             3.8%       4.5%        2.1%       1.7%
                                     Source: Standard & Poor’s, Russell Investment Group, FactSet, J.P. Morgan Asset Management.
                                     All calculations are cumulative total return, not annualized, including dividends for the stated period. Since Market Peak represents period 10/9/07 – 3/31/12.
                                     Since Market Low represents period 3/9/09 – 3/31/12.
                                     Forward P/E Ratio is a bottom-up calculation based on the most recent S&P 500 Index price, divided by consensus estimates for earnings in the next twelve
                                     months (NTM), and is provided by FactSet Market Aggregates. Trailing P/E ratios are bottom-up values defined as month-end price divided by the last twelve
                                     months of available reported earnings. Historical data can change as new information becomes available. Note that P/E ratios for the S&P 500 may differ
                                     from estimates elsewhere in this book due to the use of a bottom-up calculation of constituent earnings (as described) rather than a top-down calculation.
                                     This methodology is used to allow proper comparison of sector level data to broad index level data. Dividend yields are bottom-up values defined as the
                                     annualized value of the most recent cash dividend as a percent of month-end price. Beta calculations are based on 10 years of monthly price returns for the
                                     S&P 500 and its sub-indices.
                                     Past performance is not indicative of future returns.

                                     Data are as of 3/31/12.

5
U.S. Equity Indexes

            Russell Indexes                                      Growth (585)                              S&P Indexes                                      Dow Jones
                                                                                      Russell                                                                   Industrials (30)
                                                                                      Top 200                                            S&P 500                    Industrials
                                          Russell              Russell
                                                              Russell
                                           1000                 1000
                                                               1000
                                                                                     Russell
Equities


                                                                                                                     S&P                 S&P Mid
                                                                                  Mid Cap (800)                                          Cap 400
                                                                                                                     1500
                       Russell           Russell          Value (654)
                        3000                                                                                                          S&P Small
                                          2000
                                                                                                                                       Cap 600


                                                    Mark et Cap                            W eight                           Size (Lipper*)                       Valuation
                      Index                  W td Av g           T otal          T op 10       Bottom 100           Large          Mid        Small        Div Yld        Fwd P/ E
                     S&P 500                  111.6 bn         12,730 bn          20.5%             3.0%             91.3%        8.2%         0.4%           2.1%           13.0x
                     Russell 1000               99.6            14,452             18.3              0.8              82.3        14.2          3.5            2.0           13.5
            Large


                     Dow Jones                 147.3             3,984             57.0             43.0             100.0         0.0          0.0            2.4           12.6
                     Russell 1000 Value          79.0            7,112             24.3              0.7              81.6         14.2         4.3            2.5           12.2
                     Russell 1000 Growth        119.5            7,340             29.2              0.9              83.0         14.2         2.8            1.5           15.1
                     S&P Mid Cap 400             4.0             1,189              6.6             10.7              1.5          56.5        42.0            1.4           15.6
            Mid


                     Russell Mid Cap             8.8             4,201              4.5             2.7               39.4         48.6        12.0            1.7           15.1
            All Sm


                     Russell 2000                1.4             1,220              2.5              0.4               0.0         1.2         98.8            1.4           19.0

                     Russell 3000               91.9            15,672             16.8              0.0              75.9         13.2        10.9            2.0           13.8
           Market Cap is a bottom-up weighted average based on share information from Compustat and price information from FactSet's pricing database as provided by Standard &
           Poor's and Russell Investment Group, respectively. Dividend Yield is calculated based on the trailing 12 months of dividends and is provided by FactSet’s pricing database for
           S&P and Dow Indexes and Russell for the Russell Indexes. Forward P/E is a bottom-up calculation based on the most recent S&P 500 price, divided by consensus estimates for
           earnings in the next twelve months (NTM), and is provided by FactSet Market Aggregates. Top 10 represents summed benchmark weight of ten largest stocks in respective
           index. Bottom 100 represents summed benchmark weight of 100 smallest stocks in respective index. *Lipper mutual fund size parameters are used for
           illustrative purposes only and are hypothetical distributions based on Lipper mutual fund categories. As of November 2011, Lipper defines large as
           market cap over $11.7 billion, small as less than $4.1 billion and mid as all values in between. The number of holdings as of 3/31/12 are –
           Russell 1000: 977; Russell Mid Cap: 779; Russell 2000: 1,941; Russell 3000: 2,918.
6          Data are as of 3/31/12.
S&P 500 Index at Inflection Points

            S&P 500 Index                                        Characteristic             Mar-2000   Oct-2007     Mar-2012
                                                                                                                                         Oct. 9, 2007
                                           Mar. 24, 2000            Index level              1,527     1,565          1,408            P/E (fwd) = 15.2x
            1,600                        P/E (fwd) = 25.6x          P/E ratio (fwd)          25.6x     15.2x          13.0x                   1,565
                                               1,527                Dividend yield           1.1%      1.8%           2.1%
Equities


                                                                    10-yr. Treasury           6.2%      4.7%          2.2%                                                Mar. 31, 2012
                                                                                                                                                                        P/E (fwd) = 13.0x
                                                                                                                                                                              1,408
            1,400


                                                                                                       +101%
            1,200
                             +106%

                                                                                                                                     -57%
                                                             -49%
            1,000                                                                                                                                                     +108%


              800
                           Dec. 31, 1996                                      Oct. 9, 2002
                          P/E (fwd) = 16.0x                                                                                        Mar. 9, 2009
                                                                            P/E (fwd) = 14.1x
                                741                                                                                              P/E (fwd) = 10.3x
                                                                                  777
                                                                                                                                        677
              600
                    '97        '98       '99       '00        '01         '02         '03       '04     '05        '06        '07       '08           '09     '10       '11        '12
           Source: Standard & Poor’s, First Call, Compustat, FactSet, J.P. Morgan Asset Management.
           Dividend yield is calculated as the annualized dividend rate divided by price, as provided by Compustat. Forward Price to Earnings Ratio is a bottom-up calculation based
           on the most recent S&P 500 Index price, divided by consensus estimates for earnings in the next twelve months (NTM), and is provided by FactSet Market Aggregates.
           Returns are cumulative and based on S&P 500 Index price movement only, and do not include the reinvestment of dividends. Past performance is not indicative of future
           results.
           Data are as of 3/31/12.


7
Equity Scenarios: Bull, Bear and In-between

             S&P 500 Index: Return Needed to Reach 2007 Peak                                                Bear Market Cycles vs. Subsequent Bull Runs
             Analysis as of Mar. 31, 2012. Index has risen 108.0% since low of 677.                                                 Bear                                 Yrs to
                                                                                                            Market      Market               Length of          Length
                                                                                                                                   Market              Bull Run        Reach Old
                                                                                                             Peak        Low                  Decline           of Run
             1 Yrs     13.1%                                                                 13.1%                                 Return                                Peak
Equities


                                                                                                            5/29/46     5/19/47    -28.6%        12      257.6%   122     3.1 yrs
             2 Yrs     7.4%                                   15.4%
                                                                                                            7/15/57    10/22/57    -20.7%         3       86.4%   50      0.9 yrs

             3 Yrs     5.6%                         17.7%
                                                                                                            12/12/61    6/26/62    -28.0%         6       79.8%   44      1.2 yrs

             4 Yrs     4.7%                    20.0% 10/9/07 Peak                            1,565           2/9/66     10/7/66    -22.2%         8       48.0%   26      0.6 yrs
                                                          3/9/09 Trough                         677
             5 Yrs     4.1%                 22.4%         3/31/12 Level                      1,408          11/29/68    5/26/70    -36.1%        18       74.2%   31      1.8 yrs

                                                          Decline Peak to Trough                888
             6 Yrs     3.8%                24.9%                                                             1/5/73     10/3/74    -48.4%        21      125.6%   74      5.8 yrs
                                                          Recovery So Far                       731
                                                          Distance Left to Peak                 157         11/28/80    8/12/82    -27.1%        20      228.8%   60      0.2 yrs
             7 Yrs     3.5%              27.4%
                                                                                                            8/25/87     12/4/87    -33.5%         3      582.1%   148     1.6 yrs
             8 Yrs     3.3%             29.9%
                                                     X% Implied avg. annualized total return
                                                                                                            3/24/00     10/9/02    -49.1%        31      101.5%   60      4.6 yrs
             9 Yrs     3.2%            32.5%        X% Implied cumulative total return
                                                                                                            10/9/07     3/9/09     -56.8%        17      108.0%   37*

           10 Yrs      3.1%            35.2%
                                                                                                           Average:                 -35.0%    14 mo's    176.0% 68 mo's   2.2 yrs

           Source: Standard & Poor’s, FactSet, J.P. Morgan Asset Management.
           (Left) Data assume 2.0% annualized dividend yield. Implied values reflect the average geometric total returns required for the S&P 500 to reach its
           10/9/07 peak of 1,565 over each stated time period. Chart is for illustrative purposes only. Past performance does not guarantee future results.
           (Right) A bear market is defined as a peak-to-trough decline in the S&P 500 Index (price only) of 20% or more. The bull run data reflect the market
           expansion from the bear market low to the subsequent market peak. All returns are S&P 500 Index returns and do not include dividends. *Current
8          bull run from 3/9/09 through 3/31/12. Data are as of 3/31/12.
Investment Style Valuations

            Russell 1000 Growth P/E divided by Russell 1000 Value P/E                                                           Current P/E vs. 20-year avg. P/E
            3.5x
                                                                                                                                               Value         Blend        Growth
                                                                                                                                             11.9          13.2          14.7


                                                                                                                                     Large
            3.0x                                                                 Most recent:
Equities


                                                                                 R1000 Growth                14.7                                   14.0          16.7          21.0
            2.5x                                                                 R1000 Value                 11.9
                                                                                 Growth / Value              1.2x*                           13.4          15.0          16.9


                                                                                                                                     Mid
            2.0x                                                                                                                                    14.0          16.3          21.9

                                                                                                                                             13.7          15.4          17.2


                                                                                                                                     Small
            1.5x
                                                20-yr. average: 1.5x
                                                                                                                                                    14.2          17.1          21.3
            1.0x
                          '94       '96        '98       '00       '02        '04       '06        '08       '10        '12
                                                                                                                                  Current P/E as % of 20-year avg. P/E
            Russell 2000 P/E divided by Russell 1000 P/E                                                                            E.g.: Large Cap Blend stocks are 21.1%
            1.3x                                                                                                                    cheaper than their historical average.
                                                                                                                                               Value         Blend        Growth
            1.2x
                                           20-yr. average: 1.0x


                                                                                                                                     Large
            1.1x                                                                                                                               85.1%         78.9%         69.9%

            1.0x
                                                                                       Most recent:


                                                                                                                                     Mid
                                                                                                                                               95.3%         91.7%         77.3%
            0.9x                                                                       R2000                       15.4
                                                                                       R1000                       13.2
            0.8x


                                                                                                                                     Small
                                                                                       Small / Large               1.2x*
                                                                                                                                               96.4%         89.9%         80.8%
            0.7x
                          '94       '96       '98        '00       '02        '04       '06       '08        '10       '12
           Source: Russell Investment Group, IBES, FactSet, J.P. Morgan Asset Management.
           P/E ratios are calculated and provided by Russell based on IBES consensus estimates of earnings over the next twelve months. *Represents the
           Russell 1000 Growth Index P/E ratio divided by the Russell 1000 Value Index P/E ratio (top) and Russell 2000 Index P/E ratio divided by the Russell
           1000 Index P/E ratio (bottom). Data reflect P/Es as provided by Russell based on IBES estimates of next twelve months’ earnings.
           Data are as of 3/31/12.
9
Stock Valuation Measures: S&P 500 Index

            S&P 500 Index: Valuation Measures                                                                                Historical Averages
            Valuation                                                                         1-year                           3-year       5-year                 10-year           15-year
                                                                             Latest
            Measure     Description                                                            ago                               avg.        avg.                    avg.             avg.
            P/E         Price to Earnings                                     13.0x                 13.2x                        13.0x           13.1x                 14.5x          16.9x
Equities


            P/B         Price to Book                                           2.3                             2.3               2.1                2.3                2.5            3.1
            P/CF        Price to Cash Flow                                      8.9                             8.8               8.4                8.7                9.9            11.1
            P/S         Price to Sales                                          1.3                             1.3               1.1                1.2                1.3            1.5
            PEG         Price/Earnings to Growth                                1.6                             0.9               1.0                1.2                1.2            1.2
            Div. Yield  Dividend Yield                                        2.1%                    2.0%                       2.2%            2.2%                  2.0%           1.9%

            Q-Ratio: Stock Price Relative to Company Assets                                                       S&P 500 Earnings Yield vs. Baa Bond Yield
            Price to net asset value, all U.S. non-financial corporations


                                                                                              Less Attractive
                                                                                                                  10%
            200%                                                                                                                                     S&P 500 Earnings Yield:
                                                                                                                      9%
                                                                                                                                                     (Inverse of fwd. P/E) 7.7%
                                                                                                                      8%
            150%
                                                                                                                      7%
                                                                               1Q12*: 96.0%
            100%                                                                              More Attractive
                                                                                                                      6%
                                 40-yr. avg. = 75.3%
                                                                                                                      5%
             50%                                                                                                                                                        Moody’s Baa Yield: 5.2%
                                                                                                                      4%

              0%                                                                                                      3%
                1970      1975     1980    1985     1990     1995    2000     2005     2010                                '94   '96     '98   '00         '02   '04     '06   '08    '10     '12

           Source: (Top) Standard & Poor’s, FactSet, J.P. Morgan Asset Management.
           Price to Earnings is price divided by consensus analyst estimates of earnings per share for the next twelve months. Price to Book is price divided by book value per share. Data
           post-1992 include intangibles and are provided by Standard & Poor’s. Price to Cash Flow is price divided by consensus analyst estimates of cash flow per share for the next
           twelve months. Price to Sales is calculated as price divided by consensus analyst estimates of sales per share for the next twelve months. PEG Ratio is calculated as NTM P/E
           divided by NTM earnings growth. Dividend Yield is calculated as consensus analyst estimates of dividends for the next twelve months divided by price. All consensus analyst
           estimates are provided by FactSet. (Bottom left) Q-Ratio based on data from the Federal Reserve, table B.102. *1Q12 is an estimate provided by
           J.P. Morgan Asset Management as of 3/31/12. (Bottom right) Standard & Poor’s, Moody’s, FactSet, J.P. Morgan Asset Management.
           Data are as of 3/31/12.
10
Earnings Estimates and Multiples

            S&P 500 Index: Forward P/E Ratio                                                   S&P 500 Operating Earnings Estimates
            28x                                                                                Consensus estimates of the next twelve months’ rolling earnings
                                                                                               $120                                                             1Q12: $108.51
            24x
Equities


                                                                                               $100

            20x                                                                                 $80

                                                                        Average: 16.2x          $60
            16x
                                                                                                $40
            12x
                                                                                                $20
                                                                        Mar. 2012: 13.0x
             8x                                                                                  $0
                      '94      '96   '98    '00    '02     '04    '06     '08    '10    '12            '02      '03      '04   '05   '06    '07    '08    '09     '10   '11

            Forward P/E Ratios by Sector
            Averages and ranges based on monthly data from April 2002 to March 2012                                                               Example
            35x

            30x

            25x
                                                                                                                                                                        10-yr.
                                                                                                                                                   Average
            20x                                                                                                                                                         range
                                                                                                                                                   Current
            15x

            10x

             5x
                   Con. Disc      Con.       Energy      Financials     Health   Industrials    Tech         Materials     Telecom    Utilties
                                 Staples                                Care
           Source: (Top left) Standard & Poor’s, Compustat, FactSet, J.P. Morgan Asset Management. (Top right) Standard & Poor’s, Compustat, FactSet, J.P.
           Morgan Asset Management. Earnings estimates are for calendar years and taken at quarter end dates throughout the year. (Bottom) Standard &
           Poor’s, FactSet, J.P. Morgan Asset Management. Forward Price to Earnings is price divided by consensus analyst estimates of earnings per share for
           the next twelve months.
11         Data are as of 3/31/12.
Earnings Drivers and Shareholder Distributions

            Year-Over-Year EPS Growth                                                          Nominal GDP and S&P 500 Sales Growth
            S&P 500, quarterly, broken into revenue growth and margin expansion                Year-over-year growth, 2000 – 2011
            60%                                                                                20%

                     84.9%                                                                     15%
                                                                                                                                                           Sales per share
Equities


                                                                                               10%

            50%                                                                                  5%
                                               Margin Share of EPS Growth                                                           Nominal GDP
                                                                                                 0%
                                               Revenue Share of EPS Growth
                                                                                                -5%
                                                                                               -10%
            40%
                                                                                               -15%                Correlation Coefficient: 0.82
                                                                                               -20%
                                                                                                       '00                '02           '04          '06          '08          '10
            30%               44.0%                                                            Cash Returned to Shareholders
                                                                                               Rolling 4-quarter averages, S&P 500, billions USD
                                                                                               $30                                                                                         $160
                                                                                                           Dividends per share
                                      29.8%                                                                                                                                                $140
            20%                                                                                $27
                                               20.0%                                                                                                                                       $120
                                                                 7.3%                          $24
                                                                          6.5%                                                                                                             $100
                                                        8.1%
            10%                                                                                $21                                                                                         $80
                                                                                   0.2%
                                                                                                                                                                                           $60
                                                                 11.6% 10.8%
                                               7.8%     8.3%                       7.9%        $18
                     6.8%      7.3%   6.8%                                                                                                                                                 $40
                                                                                                                                                           Share buybacks
             0%                                                                                $15                                                                                         $20
                     1Q10      2Q10   3Q10     4Q10     1Q11     2Q11     3Q11     4Q11              '00     '01    '02     '03   '04    '05   '06   '07    '08   '09   '10   '11    '12
           Source: Standard & Poor’s, Compustat, BEA, FactSet, J.P. Morgan Asset Management.
           Data are as of 3/31/12.

12
Broad Market Lagged Price to Earnings Ratio

            Lagged P/E Ratio – All U.S. Corporations
            Ratio of Market Value of All U.S. Corporations to Adjusted After-Tax Corporate Profits for Prior Four Quarters
            35x
Equities


            30x
                                                                                   P/E Ratios
                                                                   Avg. During Recessions                 12.6x

            25x                                                    Avg. During Expansions                 13.9x
                                                                   March 31, 2012                         12.5x


            20x


            15x                                                                   Average: 13.7x


            10x                                                                                                                            Mar. 31, 2012: 12.5x


             5x


             0x
                  '52    '55     '58   '61    '64     '67    '70     '73    '76    '79     '82      '85    '88    '91   '94   '97   '00   '03   '06   '09   '12
           Source: BEA, Federal Reserve Board, Wilshire Associates, J.P. Morgan Asset Management.
           Data are as of 3/31/12.


13
P/E Ratios and Equity Returns

             P/E and Total Return Over 1-yr. Periods                                               P/E and Total Return Over 10-yr. Annualized Periods
             Quarterly, 1Q 1952 to 1Q 2011                                                          Quarterly, 1Q 1952 to 1Q 2002
             60%                                                                                    60%
                                       Current P/E: 12.5                                                                     Current P/E: 12.5
Equities


             40%                                                                                    40%


             20%                                                                                    20%


              0%                                                                                     0%
                   5x          10x           15x          20x          25x           30x                  5x          10x          15x           20x   25x   30x


            -20%                                                                                   -20%


            -40%                                                                                   -40%

           Source: BEA, FRB, J.P. Morgan Asset Management. Prices are based on the market value of all US corporations and include quarterly
           dividends. Valuation based on long-term PE ratio.
           Note: Orange line denote results of linear regression with R-squared of 0.15 for 1-yr. returns (LHS) and 0.50 for 10-yr. returns (RHS).
           Data are as of 3/31/12.

14
Equity Correlations and Volatility

            Large Cap Stocks                                                                                                                                       Sovereign Debt
            Correlations Among Stocks                                                                                                                                       Crisis
            70%
                                        Great Depression /                                                                                              Lehman
            60%                         World War II                                                                                                    Bankruptcy
                                                                                                                           1987 Crash
Equities


            50%                                                  Cuban Missile Crisis    OPEC Oil
            40%
                                                                                         Crisis                                         Tech Bust & 9/11

            30%

            20%

            10%         Average: 26.7%                                                                                                                        Mar. 2012: 33.2%

             0%
                  '26       '32      '38       '44       '50        '56       '62       '68       '74          '80          '86           '92         '98         '04         '10


            Daily Volatility of DJIA                                                                          Volatility Level                  ’08 Peak      Latest
            3.5%
                                                                                                              DJIA                                3.30%       0.40%
                                   Chart shown
            3.0%                    in 3-month
                                  moving average
            2.5%

            2.0%

            1.5%

            1.0%                                         Average: 0.72%

            0.5%

            0.0%
                '26         '32       '38       '44        '50        '56       '62       '69           '75          '81          '87           '93         '99         '06         '12
           Source: (Top) Empirical Research Partners LLC, Standard & Poor’s, J.P. Morgan Asset Management. Capitalization weighted correlation of
           top 750 stocks by market capitalization, daily returns, 1926 – Mar. 29, 2011. (Bottom) Dow Jones, J.P. Morgan Asset Management. Data are
           represented as three-month moving averages of the daily absolute percentage change in the Dow Jones Industrial Average.
15         Charts shown for illustrative purposes only. Data are as of 3/31/12.
Economic Growth and the Composition of GDP

           Real GDP                                                                               Components of GDP
           % chg at annual rate                                                                    4Q11 nominal GDP, billions, USD
            10%                                                       20-yr avg. 4Q11                                                2.3% Housing
                                                                                                         $16,000
                                                   Real GDP:            2.6%        3.0%
              8%                                                                                                       10.8% Investment ex-housing
                                                                                                         $14,000
              6%                                                                                                                     19.7%
                                                                $685 bn of                               $12,000                 Gov’t Spending
Economy


              4%                                                output lost
                                                                                                         $10,000
              2%

                                                                                                          $8,000
              0%

             -2%                                                                                          $6,000                        71.0%
                                                                               $788 bn of
                                                                                 output                                              Consumption
             -4%                                                               recovered
                                                                                                          $4,000

             -6%                                                                                          $2,000

             -8%
                                                                                                               $0

           -10%                                                                                                               - 3.8% Net Exports
               '02                '04             '06           '08           '10                        -$2,000
          Source: BEA, FactSet, J.P. Morgan Asset Management.
          GDP values shown in legend are % change vs. prior quarter annualized and reflect revised 4Q11 GDP.
          Data reflect most recently available as of 3/31/12.


16
Cyclical Sectors

           Light Vehicle Sales                                                                             Manufacturing and Trade Inventories
            Millions, seasonally adjusted annual rate                                                      Days of sales, seasonally adjusted
           24                                                                                               47
                                                                                                            46                                                              Jan. 2012: 38.6
           22
                                                                                                            45
           20
                                                                                                            44
           18                                                                                               43
                                                                                        Feb. 2012:
           16                                                                                 15.0          42
                                                    Average: 15.1                                           41
Economy


           14
                                                                                                            40
           12
                                                                                                            39
           10                                                                                               38
             8                                                                                              37
                        '94    '96    '98     '00         '02     '04     '06   '08      '10         '12               '94   '96   '98      '00         '02   '04   '06      '08     '10   '12

           Housing Starts                                                                                  Real Capital Goods Orders
           Thousands, seasonally adjusted annual rate                                                      Non-defense capital goods orders ex. aircraft, $ bn, seasonally adjusted
            2,400                                                                                           75

                                                                                                            70
            2,000                                                                                                                                                           Feb. 2012: 59.6
                                                                                                            65
            1,600
                                                                                                            60                           Average: 57.7
            1,200
                                                                        Average: 1,446
                                                                                                            55
             800
                                                                                                            50

             400                                                                                            45
                                                                                 Feb. 2012: 698
                 0                                                                                          40
                  '75         '80      '85          '90         '95       '00     '05          '10               '98         '00     '02          '04         '06     '08          '10     '12

          Source: (Top left) BEA, FactSet, J.P. Morgan Asset Management. (Top right) Census Bureau, FactSet, J.P. Morgan Asset Management. (Bottom left) Census Bureau,
          FactSet, J.P. Morgan Asset Management. (Bottom right) Census Bureau, FactSet, J.P. Morgan Asset Management.
          Capital goods orders deflated using the producer price index for capital goods.
          Data reflect most recently available as of 3/31/12.

17
Consumer Finances

           Consumer Balance Sheet                                                                           Personal Savings Rate
           Trillions of dollars outstanding, not seasonally adjusted                                        Annual, % of disposable income
                                                                                                            12%
            $80
                                                                                                            10%
                                                                       2Q-’07 Peak: $80.7tn
                         Total Assets: $72.2 tn                                                                                                                                 YTD 2012:
                                                                       1Q-’09 Low: $64.5tn                   8%
            $70                                                                                                                                                                      4.0%
                                                                                                             6%
                              Homes: 25%
Economy


            $60                                                                                              4%

                                                                                                             2%
                          Other tangible: 7%
            $50                                                                                              0%
                                                                                                                  '60   '65     '70   '75     '80    '85    '90   '95    '00    '05   '10
                             Deposits: 11%
                                                                                                           Household Debt Service Ratio
            $40
                                                                                                           Debt payments as % of disposable personal income, seasonally adjusted
                                                                                                           15%
                         Pension funds: 18%                                                                                                                             3Q07:
            $30                                                                                                                                                         14.0%
                                                          Revolving (e.g.: credit cards): 6%               14%
                                                                       Non-revolving: 12%
                                                                     Other Liabilities: 10%                13%
            $20
                            Other financial                   Total Liabilities: $13.8 tn                  12%     1Q80:
                             assets: 38%                                                                           11.2%
            $10                                                                                            11%
                                                                                                                                                                                1Q12*:
                                                                   Mortgages: 71%                                                                                                10.8%
                                                                                                           10%
             $0                                                                                                  '80 '82 '84 '86 '88 '90 '92 '94 '96 '98 '00 '02 '04 '06 '08 '10 '12
          Source: (Left) FRB, J.P. Morgan Asset Management. Data includes households and nonprofit organizations. (Right) BEA, FRB, J.P. Morgan Asset
          Management. Personal savings rate is calculated as personal savings (after-tax income – personal outlays) divided by after-tax income. Employer and
          employee contributions to retirement funds are included in after-tax income but not in personal outlays, and thus are implicitly included in personal
          savings. Savings rate data as of February 2012. *1Q12 Household Debt Service Ratio is J.P. Morgan Asset Management estimate. All other data are
          as of 4Q11.
          Data reflect most recently available as of 3/31/12.
18
Federal Finances

           The 2012 Federal Budget                                                                       Federal Budget Surplus/Deficit
           CBO Baseline forecast, trillions USD                                                           % of GDP, 1990 – 2022*                                         Forecast
            $4.0                                                                                           4%
                                                                                                                                             2011 actual: -8.7%
                                                                                                           2%
                       Total Spending: $3.6tn
                                                                                                           0%
            $3.5                Other
                                                                                                           -2%
                             $504bn (14%)
                                                                                                           -4%
                                                                        Borrowing:
            $3.0         Net Int.: $224bn (6%)                        $1,171bn (32%)                       -6%
Economy


                                                                                                                           CBO Baseline      Alt. Scenario
                             Non-defense                                                                   -8%
                                                                                                                        2012      -7.6%         -7.7%
                             Discretionary:                                                                                                                                      Baseline
            $2.5                                                                                         -10%           2013      -3.8%         -6.3%
                             $630bn (17%)                                                                                                                                        Alternative
                                                                                                         -12%
                                                                                                                 1990      1994     1998     2002    2006      2010       2014      2018     2022

            $2.0               Defense:                                                                  Federal Debt (Accumulated Deficits)
                             $673bn (19%)                                                                Net debt % of GDP, 1990 – 2022*                                  Forecast
                                                                                                         100%
            $1.5
                                                                        Revenues:                         80%                                                                      2022*: 93.2%
                            Social Security:                                                                                                 2011 actual: 67.7%
                                                                      $2,456bn (68%)
                             $769bn (21%)
            $1.0                                                                                          60%
                                                                                                                                                                                    2022: 61.3%
                                                                                                          40%
            $0.5        Medicare & Medicaid:                                                                                                                 CBO Baseline         Alt. Scenario
                           $827bn (23%)                                                                   20%                  Baseline
                                                                                                                                                        2012      73.2%              73.3%
                                                                                                                               Alternative
                                                                                                                                                        2013      75.8%              78.4%
            $0.0                                                                                           0%
                        Total Government Spending                    Sources of Financing                       1990     1994      1998    2002       2006       2010      2014      2018      2022
          Source: U.S. Treasury, BEA, CBO, J.P. Morgan Asset Management.
          2011 numbers are actuals. 2012 Federal Budget is based on the CBO’s March 2012 Baseline Scenario. *The CBO’s Alternative Scenario as shown in
          the deficit and debt charts assumes that expiring tax provisions (other than the payroll tax cut) are extended, the AMT is indexed for inflation after 2011,
          Medicare’s payment rates for physicians’ services are held constant at their current level and the automatic spending cuts required by the Budget
          Control Act, which are set to take effect in January 2013, do not occur (but discretionary appropriation caps stay in place).
          Note: Years shown are fiscal years (Oct. 1 through Sep. 30). Top right chart displays federal surplus/deficit (revenues – outlays).
19        Data reflect most recently available as of 3/31/12.
Federal Revenues, Outlays and Tax Rates

           Federal Revenues                                                                  Federal Outlays
           1960 – 2012, % of GDP                                                             1960 – 2012, % of GDP
           26%                                                                               26%                                                                   2012*: 23.4%


           22%                                                                               22%

                                                                                                                                 Average: 20.5%
Economy


           18%                                                                               18%
                                              Average: 17.9%

                                                                    2012*: 15.7%
           14%                                                                               14%
                 1960         1970            1980      1990          2000         2010            1960         1970          1980           1990          2000          2010

            Average Maximum Tax Rate on Dividends and Capital Gains                                                       Tax Rate       40-yr. avg. Current
           100%
                                                                                                                          Dividends         44.6%    15.0%
                                                                                                                          Capital Gains     24.7%     15.0%
            80%
                                                                                                                          Ordinary Income 47.9%       35.0%

            60%


            40%


            20%


              0%
               1930's                1940's           1950's             1960's             1970's             1980's              1990's             2000's            Current
          Source: (Top Charts) CBO, White House, J.P. Morgan Asset Management. (Bottom) The Tax Foundation, J.P. Morgan Asset Management. Tax rates
          based on maximum U.S. individual income tax.
          *2012 revenues and outlays are estimates based on the CBO’s Alternative Scenario, which was re-estimated on March 13, 2012. This scenario assumes
          that all expiring tax provisions (excluding the payroll tax cut) are extended, the AMT is indexed for inflation after 2011, Medicare payments are held
          constant at current levels and the automatic enforcement procedures specified by the Budget Control Act of 2011 do not take effect.
20        Data are as of 3/31/12.
Political Perception and Economic Reality

           Presidential and Congressional Approval Ratings                                      S&P 500 Return by Political Control
           88%                                                                                  1940 to 2011
           78%                                                                                  16%
                  Presidential Approval                                                                                        15.3%
           68%
                                                                                                12%
           58%

           48%                                                                                   8%
                                                                                                                                                                    7.7%
           38%
Economy


                                                                                                 4%          5.0%
           28%
                                                                                                                                                  3.3%
           18%                                                                                   0%
                   Congressional Approval                                                                        Dem. President                      Rep. President
            8%
              1974 1987 1995 1997 2000 2002 2003 2005 2006 2008 2010 2011                              Dem. Congress      Split Congress    Rep. Congress       Split Congress

           Political Polarization                                                               Real GDP Growth by Political Control
           % of Representatives voting with the majority of their party*                        1940 to 2011
           100%                                                                                  7%
                                                      Senate                                     6%          6.3%
            95%
                                                      House                                      5%
            90%
                                                                                                 4%

            85%                                                                                  3%
                                                                                                                                                  3.1%
                                                                                                 2%                                                                  2.7%
            80%
                                                                                                 1%                            1.4%
            75%                                                                                  0%
                                                                                                                 Dem. President                      Rep. President
             70%
                   1901          1921           1941           1961          1981           2001                  Dem. Congress Split Congress Rep. Congress    Split Congress
          Source: (Top) Gallup Inc., J.P. Morgan Asset Management. (Bottom left) Gallup Inc., J.P. Morgan Asset Management. (Bottom right) Keith T.
          Poole, J.P. Morgan Asset Management.
          *In roll call votes where the majority in one party voted the opposite way to the majority in the other. Data compiled by Professors Keith T. Poole
          and Howard Rosenthal available at www.voteview.com.
21        Data are most recent as of 3/31/12.
The Aftermath of the Housing Bubble

           Median Existing Home Prices                                                                           Monthly Rent vs. Monthly Mortgage Payment
           $ thousands, seasonally adjusted                                                                      Vacant properties
           240                                                                                                   $1,100
                                               Nov. 2005: $227K                                Peak to
           220                                                                                                                                                       Monthly
                                                                                               current:           $950
                                                                                                                                                                    Mortgage
           200                                                                                  -26.9%                                                                                      1Q12*:
                                                                                                                  $800                                              Payment
           180
                                                                                                                                                                                              $706

           160                                                                                                    $650

           140
                                                                                       Feb. 2012: $166K
Economy


                                                                                                                  $500
           120                                                                                                                                                                        1Q12*: $518
                                                                                                                  $350                             Monthly Rent
           100

            80                                                                                                    $200
                    '92    '94    '96    '98     '00     '02         '04         '06     '08     '10   '12                '88   '90   '92   '94   '96   '98   '00   '02   '04   '06   '08   '10   '12

           Home Sales and Inventories                                                                            Affordability: Mortgage Payment on Average New Home
           Millions, annual rate, seasonally adjusted                                                            % of average household personal income
            6                                                                          Home Sales            9   40%
                 Inventories
                                                                                                             8   35%
            5

                                                                                             Feb. 2012:      7   30%
            4
                                                                                                    2.7
                                                                                                             6   25%
            3                                                                                                                                                                          Feb. 2012:
                                                                                                             5   20%                                                                       10.5%
            2
                                                                                                             4   15%
                                                                                       Feb. 2012: 4.9
            1                                                                                                3
                   '94     '96    '98     '00      '02         '04         '06         '08      '10    '12       10%
                                                                                                         '75        '80      '85        '90        '95    '00      '05       '10
          Sources: (Top left) National Association of Realtors, FactSet, J.P. Morgan Asset Management. (Top right) Census Bureau, J.P. Morgan Asset Management. Monthly mortgage
          payment assumes a 20% down payment at prevailing 30-year fixed-rate mortgage rates; analysis based on median asking rent and median mortgage payment based on asking
          price. *1Q12 estimates provided by J.P. Morgan Asset Management. (Bottom left) Census Bureau, National Association of Realtors, J.P. Morgan Asset Management. Home sales
          include both new and existing home sales. Existing home sales include single-family, townhouses, condominiums and co-ops.
          (Bottom right) Census Bureau, FRB, BEA, J.P. Morgan Asset Management. Calculation assumes a 20% down payment, a 30-year fixed-rate mortgage,
          excludes property tax and homeowners’ insurance and is expressed as a % of pre-tax income. Data reflect most recently available as of 3/31/12.
22
Employment

           Civilian Unemployment Rate                                                          Employment – Total Private Payroll
           Seasonally adjusted                                                                 Total job gain/loss (thousands)
            12%                                                                                  600


            11%                                                                                  400


            10%
                                                                                                 200
Economy


                                                                                                                                                 8.8mm jobs lost

             9%
                                                                                                    0
                                                                      Feb. 2012: 8.3%
             8%
                                                                                                                                                                         3.9mm
                                                                                                 -200                                                                    jobs
                                                                                                                                                                         gained
             7%

                                                                                                 -400
             6%

                                                                                                 -600
             5%                        50-yr. avg.: 6.1%

             4%                                                                                  -800


             3%                                                                                -1,000
                              '70             '80               '90       '00           '10             '02   '03    '04     '05    '06    '07      '08   '09      '10      '11

          Source: BLS, FactSet, J.P. Morgan Asset Management.                                 Source: BLS, FactSet, J.P. Morgan Asset Management.
          Data reflect most recently available as of 3/31/12.


23
Employment by Sector and Education

            20 Years – Net Job Creation                                                               Unemployment Rate by Education Level
            Net change in millions of payroll jobs, sa                                                18%


              Fin. & Bus. Services                                                        6.9         16%
                                                                Other Separations: 3.9mm

                       Health Care                                                        6.9         14%
                                                                                                                                                               Feb. 2012:
Economy


             Leisure & Hospitality                                                4.2                                                                              12.9%
                                                                                                      12%
                                                                                                                                                                              Feb. 2012:
                                                                                                                                                                                    8.3%
                         Education                                            4.0
                                                                                                      10%                                     Less than HS degree

                 Trade & Retailing                                          3.3
                                                                                                       8%

                    Other Services                                     1.2                                                                                                    Feb. 2012:
                                                                                                       6%                                         HS No College                     7.3%

           Mining & Construction                                      1.1
                                                                                                       4%                                            Some
                                                                                                                                                    College                   Feb. 2012:
                      Government                                      0.9                                                                                                           4.2%
                                                                                                       2%
                    Manufacturing            -4.9                                                                                 College or greater

                                                                                                       0%
                                    -6.0     -4.0     -2.0      0.0     2.0         4.0   6.0   8.0         '92   '94    '96     '98    '00       '02    '04      '06   '08   '10    '12
          Source: BLS, FactSet, J.P. Morgan Asset Management.                                         Source: BLS, FactSet, J.P. Morgan Asset Management.
          Data reflect most recently available as of 3/31/12.


24
Corporate Profits

          S&P 500 Earnings Per Share                                       Most recent:     Adjusted After-Tax Corporate Profits (% of GDP)
           Operating basis, quarterly                                                       Includes inventory and capital consumption adjustments
                                                       2Q07: $24.06              $23.73
           $26
                                                                                            11%                                                                4Q11:
                                                                                                                                                               10.3%
           $23
                                                                                            10%

           $20
                                                                                             9%
Economy


           $17
                                                                                             8%
           $14
                                                                                             7%
           $11
                                                                                                                         50-yr. avg.: 6.2%
                                                                                             6%
             $8

                                                                                             5%
             $5

                                                                                             4%
             $2


            -$1                                                                              3%
                           '01            '03            '05         '07   '09       '11             '65    '70   '75    '80    '85    '90   '95   '00   '05    '10
          Source: Standard & Poor’s, J.P. Morgan Asset Management.                         Source: BEA, FactSet, J.P. Morgan Asset Management.
          EPS levels are based on operating earnings per share.
          Most recently available is a 4Q11 99% complete estimate.
          Data reflect most recently available as of 3/31/12.


25
Consumer Price Index

           CPI and Core CPI                                                                                               CPI              Weight in   12-month
           % chg vs. prior year, seasonally adjusted                                      50-yr. Avg. Feb. 2012           Components         CPI        Change
           15%
                                                                       Headline CPI:          4.2%          2.9%          Food & Bev.       15.3%        3.8%
                                                                       Core CPI:              4.1%          2.2%
                                                                                                                          Housing           41.0%        1.8%
           12%
                                                                                                                          Apparel            3.6%        4.2%

                                                                                                                          Transportation    16.9%        5.8%
Economy


            9%                                                                                                            Medical Care       7.1%        3.4%

                                                                                                                          Recreation         6.0%        1.0%

            6%                                                                                                            Educ. & Comm.      6.8%        1.9%

                                                                                                                          Other              3.4%        1.5%

            3%
                                                                                                                          Headline CPI      100.0%       2.9%

                                                                                                                          Less:

            0%                                                                                                              Energy           9.7%        7.0%

                                                                                                                            Food            13.7%        3.9%

            -3%
                      '65        '70        '75         '80     '85     '90       '95       '00       '05       '10       Core CPI           76.6%       2.2%

          Source: BLS, FactSet, J.P. Morgan Asset Management.
          CPI values shown are % change vs. 1 year ago and reflect February 2012 CPI data. CPI component weights are as
          of December 2011 and 12-month change reflects non-seasonally adjusted data through February 2012. Core CPI is
          defined as CPI excluding food and energy prices.
          Data reflect most recently available as of 3/31/12.


26
Returns in Different Inflation Environments – 40 years

                                    Rising inflation scenarios                                              Falling inflation scenarios

           High and Rising Inflation                                                           High and Falling Inflation
           Occurred 14 times since 1972                                                       Occurred 6 times since 1972
            25%                                                                                25%                           23%
            20%                                                                                20%          18%


                                                                                                                                                                               Above median
            15%                                                              13%               15%
            10%                                             7%                                                                                  8%
                         5%                                                                    10%
Economy


             5%                            2%                                                   5%
             0%                                                                                 0%
            -5%                                                                                -5%
           -10%                                                                               -10%
                                                                                                                                                                -15%
           -15%                                                                               -15%
                        Bonds           Equities           Cash          Commodities                       Bonds           Equities           Cash          Commodities    Median
                                                                                                                                                                          Inflation:
           Low and Rising Inflation                                                           Low and Falling Inflation                                                     3.3%
           Occurred 7 times since 1972                                                        Occurred 13 times since 1972


                                                                                                                                                                             Below median
            25%                                                                               25%
                                          20%
            20%                                                               17%             20%
            15%                                                                               15%                            12%
                                                                                              10%           8%                                                   6%
            10%           6%                                                                                                                   4%
             5%                                              3%                                 5%
             0%                                                                                 0%
            -5%                                                                                -5%
           -10%                                                                               -10%
           -15%                                                                               -15%
                        Bonds           Equities            Cash         Commodities                      Bonds            Equities           Cash          Commodities
          Source: BLS, Barclays Capital, Robert Shiller, Federal Reserve, Strategas/Ibbotson, Standard and Poor’s, FactSet, J.P. Morgan Asset Management.
          High or low inflation distinction is relative to median CPI-U inflation for the period 19712to 2011. Rising or falling inflation distinction is relative to
          previous year CPI-U inflation rate. Bond returns are based on the Barclays U.S. Aggregate index since its inception in 1976 and a composite bond
          index prior to that. Equity returns based on S&P 500 price return and annual dividend yield. Cash returns are based on the Barclays 1-3 Month T-Bill
          index since its inception in 1992 and 3-month T-Bill rates prior to that. Commodities returns based on GSCI.
          For illustrative purposes only. Past performance is not indicative of comparable future returns.
27        Data reflect most recently available as of 3/31/12.
Oil and the Economy

            WTI Crude Oil & Retail Gasoline Prices                                                  Economic Drag From Oil Prices
            $4.50                                                                           $160    U.S. Petroleum Imports as a % of GDP                                     1Q12*: 3.2%
                         Gas                 12/31/2000          3/31/2012      Oil                 4%
                                     Oil       $26.72             $103.02                                                                                              3Q08: 3.8%
                                     Gas       $1.41               $3.92
            $4.00                                                                           $140
                                                                                                    3%


            $3.50                                                                           $120
                                                                                                    2%
Economy


            $3.00                                                                           $100
                                                                                                    1%


            $2.50                                                                           $80     0%
                                                                                                      '70        '75      '80       '85       '90         '95      '00      '05     '10

                                                                                                    Energy Spending by Income Level
            $2.00                                                                           $60     % of after-tax income
                                                                                                                                Lowest 20%          2nd    Middle 20%      4th    Top 20%

            $1.50                                                                           $40       Natural Gas                   2.4%        1.4%            0.9%       0.7%     0.5%

                                                                                                      Electricity                   9.5%        4.6%            3.1%       2.2%     1.2%

            $1.00                                                                           $20       Fuel Oil & Other Fuels        0.9%        0.4%            0.3%       0.2%     0.2%

                                                                                                      Gasoline & Motor Oil         10.1%        5.9%            4.8%       3.7%     2.2%

            $0.50                                                                           $0        Total Energy                 22.9%        12.3%           9.1%       6.8%     4.0%
                 '94      '96     '98      '00     '02     '04     '06   '08   '10    '12
          Source: U.S. Department of Energy, FactSet, J.P. Morgan Asset Management. Price of       Source: (Top) BEA, FactSet, J.P. Morgan Asset Management. (Bottom) BLS, J.P.
          gas based on U.S. retail national average of all formulations and WTI for crude.         Morgan Asset Management.

          Data reflect most recently available as of 3/31/12.                                      *1Q12 drag from oil prices is a J.P. Morgan Asset
                                                                                                   Management estimate.
28
Global Oil Supply

          Middle East Energy Production & Chokepoints                                                U.S. Commercial & Strategic Oil Stocks
                                                                                                                                                                                        Feb. 2012:
          Percent of global liquid fuel production, 2010                                             Days of net imports                                                                 224 days
                                                                                                     250
                                                                    Kuwait
                                           Syria
                                                                     2.9%                            200
                                           0.5%                                                                                                         Oct. 2005:
             Suez Canal                                                                                                                                  129 days
               2.1%
                                                                                                     150
                                                        Iraq               Iran
                                                        2.8%               4.9%
                                                                                                     100
Economy


                                                                                                                                        U.S. Commercial Oil Stocks

              Libya           Egypt                                                                   50
              2.1%            0.8%                 Saudi Arabia                                                                   U.S. Strategic Petroleum Reserve
                                                      11.7%                                              0
                                                                                                             '94    '96         '98      '00     '02         '04    '06     '08         '10     '12
                                                                                         Strait of
                                                                                         Hormuz
                               Sudan                                                      18.0%
                                                                                                     OPEC Surplus Production Capacity
                                0.6%                                                                 Millions of barrels per day
                                                                                         UAE         6
                                                                                         3.3%                                                                                               EIA
                                                                                                     5                                                                                    forecast

                                                                                                     4
                         Bab el-Mandeb
                              3.7%                                                                   3                      Average: 2.7mm bbl/day

           Major Producers                               Major Consum ers                            2
           Percent of global total, 2010                 Percent of global total, 2010
                                                                                                     1
           Saudi Arabia 12% China                  5%    United States 22% India       4%
           Russia        12% Iran                  5%    China         11% Russia      3%            0
           United States 11% Canada                4%    Japan         5% Saudi Arabia 3%                     '01   '02   '03     '04     '05   '06    '07    '08   '09   '10     '11     '12   '13

          Source: EIA, J.P. Morgan Asset Management.
          Forecast from the March EIA Short Term Energy Outlook.
          Data are as of 3/31/12.
29
Consumer Confidence and the Stock Market

           Consumer Sentiment Index – University of Michigan
           130
                      Average 12-month S&P 500 index return…                                                                 Sentiment Cycle Peak/Trough and subsequent
                        After a peak: +1.1%         After a trough: +23.3%          Total period: +6.6%                      12-month S&P 500 Index return
           120
                                                                                                                             Jan. 2000
                                                                                                                               -2.0%
           110
                                                                                                                                                            Jan. 2004
Economy


                                                                                                                                                             +4.4%
                  Aug. 1972                                 Mar. 1984
           100                                                                                                                                                       Jan. 2007
                    -6.2%                                    +13.5%
                                     May 1977                                                                                                                          -4.2%
                                      +1.2%
             90

                                                                                                                         Average: 85.3
             80

                                                                                                                                             Mar. 2003
             70                                                                                                                               +32.8% Oct. 2005
                                                                                                                                                       +14.2%

             60                                                                               Oct. 1990
                                                                                               +29.1%
                             Feb. 1975
                                                                                                                                                                Nov. 2008     Aug. 2011
                              +22.2%
             50                                                                                                                                                  +22.3%          ?
                                                   May 1980
                                                    +19.2%
             40
                    '72      '74     '76     '78      '80       '82   '84     '86     '88     '90     '92      '94     '96     '98     '00      '02       '04   '06   '08   '10   '12
          Source: University of Michigan, FactSet, J.P. Morgan Asset Management.
          Peak is defined as the highest index value before a series of lower lows, while a trough is defined as the lowest index value before a series
          of higher highs. Subsequent 12-month S&P 500 returns are price returns only, which excludes dividends.
          Data reflect most recently available as of 3/31/12.
30
Confidence and the Capital Markets

           Multiple Expansion and Contraction                                             Est. impact of a 10pt. rise in sentiment: +2.0 multiple points*
           S&P 500 forward P/E based on consensus EPS estimates
           26x        Forward P/E                                                                                                       Consumer Sentiment             120
           24x                                                                                                                                                         110
           22x                                                                                                                                                         100
           20x
                                                                                                                                                                       90
           18x
                                                                                                                                                                       80
Economy


           16x
           14x                                                                                                                                                         70

           12x                                                                                                                                                         60
           10x                                                                                                                                                         50
                      '93     '94     '95    '96     '97     '98    '99     '00     '01     '02    '03     '04     '05    '06     '07     '08    '09       '10   '11

           Sentiment & Real Yields                                                           Est. impact of a 10pt. rise in sentiment: +54 basis points*
           Real yield based on nominal 10-yr. yield minus year over year core CPI
            6%        Real 10-year Yield                                                                                                Consumer Sentiment             120

            5%                                                                                                                                                         110

            4%                                                                                                                                                         100

            3%                                                                                                                                                         90

            2%                                                                                                                                                         80

            1%                                                                                                                                                         70

            0%                                                                                                                                                         60

           -1%                                                                                                                                                         50
                       '93    '94     '95     '96    '97     '98     '99    '00     '01     '02    '03     '04     '05    '06     '07     '08    '09       '10   '11
          Source: (Top) Standard & Poor’s, FactSet, J.P. Morgan Asset Management. (Bottom) U.S. Treasury, BLS, University of Michigan, J.P. Morgan
          Asset Management. Price to Earnings is price divided by consensus analyst estimates of earnings per share for the next twelve months. Real 10-
          year Treasury yields are calculated as the daily Treasury yield less year-over-year core inflation for that month. *Estimated impact based on
31        coefficients from regression analysis. Data are as of 3/31/12.
Fixed Income Sector Returns

                                                                                                                                                                                        10-yrs
                  2000         2001        2002         2003         2004         2005         2006         2007       2008         2009         2010         2011         1Q12        '02 - '11

                  EMD         Corp.        TIPS       High Yield     EMD          EMD        High Yield     TIPS       Treas.     High Yield   High Yield     TIPS         EMD           EMD

                 13.7%        10.3%        16.7%        29.0%        11.9%        12.3%        11.8%        11.6%      13.7%        58.2%       15.1%        13.6%         5.5%        185.6%
                            Barclays                                             Asset
                 Treas.                    EMD          EMD        High Yield                  EMD         Treas.       MBS         EMD          EMD          Muni       High Yield   High Yield
                              Agg                                                Alloc.
                 13.5%        8.4%         12.2%        26.9%        11.1%       3.6%          10.0%        9.0%        8.3%        34.2%       12.8%        10.7%         5.3%        133.6%
                                                                                                          Barclays   Barclays
                  TIPS         MBS        Treas.        TIPS         TIPS         Muni         MBS                                  Corp.        Corp.       Treas.        Corp.        TIPS
                                                                                                            Agg        Agg
                 13.2%         8.2%        11.8%        10.6%        6.3%         3.5%         5.2%         7.0%       5.2%         18.7%        9.0%         9.8%         2.1%        107.5%
                                         Barclays      Asset         Asset                    Asset                    Asset       Asset        Asset        Asset                      Asset
                  Muni         TIPS                                               TIPS                      MBS                                                            Muni
                                           Agg         Alloc.        Alloc.                   Alloc.                   Alloc.      Alloc.       Alloc.       Alloc.                     Alloc.
                 11.7%         7.9%       10.3%        10.0%         6.0%         2.8%        5.1%          6.9%       -1.4%       15.8%        7.6%         8.9%          1.8%         96.0%
Fixed Income


                Barclays      Asset                                                                        Asset                               Barclays                    Asset
                                           Corp.        Corp.        Corp.       Treas.        Muni                     TIPS        Muni                      Corp.                     Corp.
                  Agg         Alloc.                                                                       Alloc.                                Agg                       Alloc.
                 11.6%        6.8%         10.1%        8.2%         5.4%         2.8%         4.8%        6.2%        -2.4%        12.9%        6.5%         8.2%         1.6%         85.2%
                                          Asset                                              Barclays                                                       Barclays                  Barclays
                  MBS         Treas.                    Muni         MBS        High Yield                  EMD        Muni         TIPS         TIPS                      TIPS
                                          Alloc.                                               Agg                                                            Agg                       Agg
                 11.2%         6.7%       10.0%         5.3%         4.7%         2.7%         4.3%         5.2%       -2.5%        11.4%        6.3%         7.8%         0.9%        75.4%
                 Asset                                Barclays                                                                    Barclays
                            High Yield     Muni                      Muni         MBS          Corp.        Corp.      Corp.                    Treas.        EMD          MBS         Treas.
                 Alloc.                                 Agg                                                                         Agg
                 10.2%         5.3%        9.6%         4.1%         4.5%         2.6%         4.3%         4.6%       -4.9%        5.9%         5.9%         7.0%         0.6%         74.3%
                                                                   Barclays     Barclays                                                                                 Barclays
                  Corp.        Muni        MBS          MBS                                   Treas.        Muni        EMD         MBS          MBS          MBS                       MBS
                                                                     Agg          Agg                                                                                      Agg
                  9.1%         5.1%        8.7%         3.1%         4.3%         2.4%         3.1%         3.4%       -14.7%       5.9%         5.4%         6.2%         0.3%         73.9%

               High Yield      EMD       High Yield    Treas.       Treas.        Corp.        TIPS       High Yield High Yield    Treas.        Muni       High Yield    Treas.        Muni

                  -5.9%        1.5%        -1.4%        2.2%         3.5%         1.7%         0.4%         1.9%       -26.2%       -3.6%        2.4%         5.0%         -1.3%        68.8%
               Source: Barclays Capital, FactSet, J.P. Morgan Asset Management.
               Past performance is not indicative of future returns. Fixed income sectors shown above are provided by Barclays Capital and are represented by: Barclays Capital U.S. Aggregate
               Index; MBS: Fixed Rate MBS Index; Corporate: U.S. Corporates; Municipals: Muni Bond Index; Emerging Debt: Emerging Markets Index; High Yield: Corporate High Yield Index;
               Treasuries: Barclays Capital U.S. Treasury; TIPS: Barclays Capital TIPS. The “Asset Allocation” portfolio assumes the following weights:
               10% in MBS, 20% in Corporate, 15% in Municipals, 10% in Emerging Debt, 10% in High Yield, 25% in Treasuries, 10% in TIPS.
               Asset allocation portfolio assumes annual rebalancing.
32             Data are as of 3/31/12.
Interest Rates and Inflation

                 Nominal and Real 10-year Treasury Yields
                 20%


                                                                               Sep. 30, 1981: 15.84%

                 15%                                                                                                                            Average 3/31/12
                                                                                                                      Nominal Yields             6.50%  2.23%
                                                                                                                      Real Yields                2.61%  0.06%


                 10%                     Nominal 10-year
                                          Treasury Yield
Fixed Income


                                                                                                                                                             Mar. 31, 2012: 2.23%
                  5%


                  0%
                                                                                                                                                             Mar. 31, 2012: 0.06%


                 -5%
                                                                 Real 10-year
                                                                Treasury Yield


                -10%
                    '58 '60 '62 '64 '66 '68 '70 '72 '74 '76 '78 '80 '82 '84 '86 '88 '90 '92 '94 '96 '98 '00 '02 '04 '06 '08 '10 '12
               Source: Federal Reserve, BLS, J.P. Morgan Asset Management.
               Real 10-year Treasury yields are calculated as the daily Treasury yield less year-over-year core inflation for that month except for March 2012, where
               real yields are calculated by subtracting out February 2012 year-over-year core inflation.
               Data are as of 3/31/12.
33
Fixed Income Yields and Returns

                                                                                                                                                                Source: U.S. Treasury, Barclays
                                                                                                              Yield                          Return             Capital, FactSet, J.P. Morgan Asset
                                                                                                                                                                Management.
                                                                                                                                                                Fixed income sectors shown above are
               U.S. Treasuries              # of issues         Mkt. Value Avg. Maturity           12/31/2010       3/31/2012         2011           1Q12
                                                                                                                                                                provided by Barclays Capital and are
                 2-Year                                                          2 years              0.61%           0.33%           1.53%          -0.08%     represented by – Broad Market: US
                                                                                                                                                                Barclays Capital Index; MBS: Fixed
                 5-Year                         # of issues: 142                      5                2.01             1.04          9.36           -0.48      Rate MBS Index; Corporate: U.S.
                                                                                                                                                                Corporates; Municipals: Muni Bond
                 10-Year                        Total value: $4.687 tn               10                3.30             2.23          17.18          -2.25      Index; Emerging Debt: Emerging
                 30-Year                                                             30                4.34             3.35          35.60          -7.71      Markets Index; High Yield: Corporate
                                                                                                                                                                High Yield Index. TIPS: Treasury
               Sector                                                                                                                                           Inflation Protection Securities (TIPS).
                                                                                                                                                                Treasury securities data for # of issues
                 Broad Market                 7,887             $16,113 bn      7.1 years             2.97%           2.22%           7.84%          0.30%      and market value based on U.S.
                                                                                                                                                                Treasury benchmarks from Barclays
                 MBS                           945                 5,044             5.3               3.67             2.74          6.23            0.57      Capital. Yield and return information
                                                                                                                                                                based on Bellwethers for Treasury
Fixed Income


                 Corporates                   4,061                3,280             10.4              4.02             3.40          8.15            2.08
                                                                                                                                                                securities.
                 Municipals                   46,081               1,308             13.5              3.80             2.62          10.70           1.75
                                                                                                                                                                Change in bond price is calculated
                 Emerging Debt                 480                 704               11.1              5.76             5.35          6.97            5.51      using both duration and convexity
                 High Yield                   1,893                1,030             6.8               7.51             7.23          4.98            5.34      according to the following formula:
                                                                                                                                                                New Price = (Price + (Price * -Duration *
                 TIPS                           33                 753               9.1               2.78             1.93          13.56           0.86      Change in Interest Rates))+(0.5 * Price
                                                                                                                                                                * Convexity * (Change in Interest
                                                                                                                                                                Rates)^2)
               Price Impact of a 1% Rise/Fall in Interest Rates                                                   +1%
                                                           19.0%
               20%                                                                                                                                              *Calculation assumes 2-year Treasury
                                                                                                                  -1%                                           interest rate falls 0.80% to 0.00% as
               15%
                                                8.9%                                                                                                            interest rates can only fall to 0.00%.
               10%                                                                                                    6.2%       6.6%         6.8%       7.6%
                                     4.9%                                                      4.2%       5.0%
                                                                                 3.3%
                5%        0.7%                                                                                                                                  Chart is for illustrative purposes only.
                0%
                                                                                                                                                                Past performance is not indicative of
                                                                                                                                                                comparable future results.
                -5%   -2.0%
                                 -4.9%                                       -3.3%        -4.2%                                                                 Data are as of 3/31/12.
                                                                                                      -5.0%       -6.2%
               -10%                                                                                                          -6.6%      -6.8%        -7.6%
                                            -8.9%
               -15%

               -20%
                                                       -19.0%
               -25%
                        2-Year     5-Year    10-Year    30-Year     Sector     MBS         High Yield Broad Mkt     TIPS        EMD       Corp.        Munis

34
The Fed and the Money Supply

                Federal Funds Rate                                                                                        FOMC Projected Pace of Policy Firming
                10%                                                                                                       Target Federal Funds Rate at Year-End
                 9%                                                                                                       5.0%
                                                                                                                                          FOMC member Fed Funds Rate
                 8%
                                                                                                                                          projection as of January 25, 2012
                                                                                                Mar. 31, 2012:            4.0%
                 7%
                 6%                                                                                   0-0.25%
                                                                                                                          3.0%
                 5%
                 4%                                                                                                       2.0%
                 3%
                 2%                                                                                                       1.0%
                 1%
                 0%                                                                                                       0.0%
Fixed Income


                        '86     '88   '90     '92    '94   '96   '98     '00    '02     '04   '06     '08     '10   '12               2012              2013             2014     Longer run

                Excess Reserves, Monetary Base and Multiplier                                                             Money Supply Growth
                $ trillions                                                                                               Year-over-year growth in M2
                $3.0         Monetary Base & Reserves                                 M2 Money Multiplier           10x   14%
                                                                                                                    9x    12%
                $2.5
                                                                                                                                                                                Feb. 2012: 9.9%
                                                                                                                    8x
                                                                                                                          10%
                $2.0
                                                                                                                    7x
                                               Monetary Base                                                               8%
                $1.5                                                                                                6x
                                               Excess Reserves                                                             6%
                                                                                                                    5x
                $1.0
                                                                                                                           4%
                                                                                                                    4x
                $0.5                                                                                                       2%
                                                                                                                    3x
                $0.0                                                                                                2x     0%
                       '02      '03     '04         '05    '06     '07         '08      '09     '10         '11                     '85           '90        '95        '00     '05      '10
               Source: Federal Reserve, FactSet, J.P. Morgan Asset Management.
               Monetary base is defined as the total amount of a currency that is either circulated in the hands of the public or in the commercial bank deposits held in
               the central bank's reserves. Money multiplier defined as M2 divided by the monetary base.
               Data are as of 3/31/12.

35
Credit Conditions

                Lending Standards                                                                             Consumer & Industrial Loan Demand
                Net percent of banks reporting tighter lending standards                                      Net percent of banks reporting stronger demand
                100%                                                                                          60%
                                    Consumer Loans                                   84%
                 80%                Commercial and Industrial Loans                                           40%
                                                                                                                                                                                                 20%
                                    (Medium & Large Firms)                     67%
                 60%                                                                                          20%

                 40%                                                                                           0%

                 20%                                                                                     5%   -20%

                   0%                                                                                         -40%                                                                               15%
                                                                                                                             Small Firms
                 -20%                                                                                         -60%           Large & Medium Firms
                                                                                                        -3%
                 -40%                                                                                         -80%
Fixed Income


                              '98          '00     '02         '04     '06     '08         '10          '12       '92       '94      '96     '98   '00     '02      '04    '06   '08     '10      '12


                Delinquency Rates                                                                             U.S. Corporate Issuance
                All banks, seasonally adjusted                                                                $ trillions
                12%                                                                                           $3.5
                                          Residential Mortgages                                               $3.0
                10%                       Consumer Loans
                                                                                                              $2.5                       Total Equity
                                          Commercial and Industrial Loans                          9.9%                                  Total Debt
                 8%
                                                                                                              $2.0

                 6%                                                                                           $1.5

                                                                                                              $1.0
                 4%                                                                                 3.1%
                                                                                                              $0.5
                 2%
                                                                                                 1.6%         $0.0
                        '92         '94    '96   '98     '00     '02   '04   '06     '08     '10        '12          1990         1993      1996    1999         2002     2005    2008         2011

               Source: (Top left) Federal Reserve, FactSet, J.P. Morgan Asset Management. (Top right) Federal Reserve, FactSet, J.P. Morgan Asset Management. (Bottom left): Federal
               Reserve, FactSet, J.P. Morgan Asset Management. (Bottom right) SIFMA, J.P. Morgan Asset Management.
               All data reflect most recently available releases. 2Q11 – 1Q12 estimates of lending standards on consumer loans are J.P. Morgan Asset Management
               estimates. 2011 corporate issuance is through February 2012.
               Data are as of 3/31/12.
36
High Yield Bonds

                High Yield Spreads and Defaults
                20%
                                                                                                                                        Average       Latest
                                                                                                             HY Spreads                  6.0%          6.3%
                                                                                                             HY Defaults                 4.3%          1.9%
                15%                                                       Spreads
                                                                          Default Rates
                10%


                 5%


                 0%
                       '88          '90          '92          '94            '96            '98        '00            '02           '04             '06          '08               '10          '12
Fixed Income


                Historical High Yield Recovery Rates                                                   Annual High Yield Bond Issuance
                High yield bonds, cents on the dollar                                                  Billions USD
                 70¢                                                                                    $350

                 60¢                                                                                    $300

                 50¢                                                                                    $250
                                                       Average: 38.5¢
                 40¢                                                                                    $200

                 30¢                                                                                    $150

                 20¢                                                                                    $100

                 10¢                                                                                     $50

                  0¢                                                                                      $0
                        '88   '90   '92   '94   '96    '98   '00    '02   '04   '06   '08    '10                '86   '88   '90   '92   '94   '96   '98   '00   '02    '04   '06    '08   '10   '12
               Source (Top chart): U.S. Treasury, J.P. Morgan, J.P. Morgan Asset Management. Default rates are defined as the par value percentage of the total market trading at or below
               50% of par value and include any Chapter 11 filing, prepackaged filing or missed interest payments. (Bottom left): J.P Morgan, Moody’s, J.P. Morgan Asset Management.
               (Bottom right): J.P. Morgan Asset Management. Yield to worst is defined as the lowest potential yield that can be received on a bond without the
               issuer actually defaulting and reflects the possibility of the bond being called at an unfavorable time for the holder. Spreads indicated are benchmark
               yields less comparable maturity Treasury yields. Past performance is not indicative of comparable future results. 2011 issuance and recovery rates
               are as of March 30, 2012.
37             Data are as of 3/31/12.
Municipal Finance

                Muni/Treasury Ratio                                                                    State & Local Government Debt Service
                Ratio of Barclays 10-year Municipal Bond yield to 10-year Treasury                     Percent of current expenditures
                                                                                                        8%
                240%


                                                                                                        7%
                220%

                                                                                                                                                                         4Q11: 5.6%
                                                                                                        6%
                200%


                                                                                                        5%
                180%

                                                                                                        4%
Fixed Income


                160%                                                                                         '90      '92   '94   '96    '98   '00   '02   '04    '06   '08   '10

                                                                                                       Municipal Bond Issuance*
                140%                                                                                   Billions USD, revenue and GO issues
                                                                                                        $500


                120%                                                                                    $400


                                                                                                        $300
                100%

                                                                                                        $200

                 80%
                                                                          Mar. 31, 2012: 111%           $100

                 60%                                                                                      $0
                          '98       '00       '02       '04       '06       '08       '10       '12                '96 '97 '98 '99 '00 '01 '02 '03 '04 '05 '06 '07 '08 '09 '10 '11 '12
               Source (Left chart): Barclays Capital, U.S. Treasury, FactSet, J.P. Morgan Asset Management. (Top right) BEA, J.P. Morgan Asset Management. (Bottom Right) SIFMA,
               J.P. Morgan Asset Management.
               *Excludes maturities of 13 months or less and private placements. 2012 issuance data is as of February 2012.
               Data are as of 3/31/12.
38
Emerging Market Debt

                EM & DM Gross Debt to GDP                                                                            Emerging Markets Bond Index Global Spreads
               120%                                                                                                  Sovereign and quasi-sovereign issues, USD-denominated bonds
                                                                                                                     10%
                                                Developed
               100%
                                                Emerging                                                              8%
                 80%
                                                                                                                      6%
                 60%
                                                                                                                                                        Average: 3.8%
                                                                                                                      4%
                 40%

                 20%                                                                                                  2%                                                                              Mar. 31, 2012:
                                                                                                                                                                                                                3.4%
                  0%                                                                                                  0%
                            '00     '01   '02   '03    '04     '05     '06   '07   '08    '09     '10    '11   '12         '02    '03     '04     '05     '06         '07         '08         '09         '10         '11
Fixed Income


                Corporate Emerging Markets Bond Spreads                                                              Local Emerging Market Bond Yields
                Corporate issues, USD-denominated bonds                                                              Sovereign issues, local currency-denominated bonds
                12%                                                                                                  9%

                10%
                                                                                                                     8%
                 8%
                                                                                                Mar. 31, 2012:                                                                                        Mar. 31, 2012:
                                                                                                          3.8%                                    Average: 6.8%                                                 6.4%
                 6%                                                                                                  7%

                 4%                              Average: 3.2%
                                                                                                                     6%
                 2%

                 0%                                                                                                  5%
                      '01         '02     '03    '04     '05         '06     '07    '08     '09         '10    '11        '01    '02    '03     '04     '05     '06         '07         '08         '09         '10         '11
               Source: J.P. Morgan, IMF, MorganMarkets, FactSet, J.P. Morgan Asset Management.
               Spreads measure the credit risk premium over comparable maturity U.S. Treasury bonds. The J.P. Morgan EMBI Global (EMBIG) Index is a USD-denominated external debt
               index tracking bonds issued by sovereigns and quasi-sovereigns in developing nations. The J.P. Morgan Corporate Emerging Bond Index (CEMBI)
               is a USD-denominated external debt index tracking bonds issued by corporations. The J.P. Morgan GBI-EM index is a local
               currency-denominated index tracking bonds issued by emerging market governments. Debt to GDP ratios use IMF definition
               and data for developed and emerging countries; 2012 ratios are IMF estimates. Past performance is not indicative of comparable future results.
39             Data are as of 3/31/12.
Global Equity Markets: Returns and Composition

                 World Market Returns – 1Q12, Percent
                 25%

                                         Local currency returns
                 20%                                                                                                                   21.1
                                         USD returns                                                                                                                              20.1
                                                                                                                                               19.1                                                           18.6
                                                                                                                                18.0
                 15%
                                                                                                                                                                           15.2
                                                                                    14.1                                                                                                        13.9
                        12.6 12.6                      12.6                                                              12.3
                 10%                                                 11.3                                                                             11.3                               11.4
                                    10.3 11.0                 10.0
                                                                             10.8
                                                                                                                                                             9.9   9.9                                 10.1
                                                 9.4                                                               9.5
                                                                                                            7.6
                  5%
                                                                                                      4.7

                  0%
                          USA         EAFE      Europe ex- Pacific ex- Emerging                        United       France      Germany         Japan         China          India         Brazil       Russia
                        (S&P 500)                  U.K.     Japan       Markets                       Kingdom


                 Weights in MSCI All Country World Index                                                          Share of Global GDP
                 % global market capitalization                                                                   Based on purchasing power parity

                                                               Europe
                                                               ex-U.K.:                                                                                                  United
                                                                 16%                                                                                                     States:                Canada:
International


                                                                                                                                                                          19%                     2%
                                           United                           U.K.: 8%                                                          Emerging                                            Japan:
                                           States:                                                                                            Markets:                                              6%
                                                                            Emerging                                                            49%
                                            46%
                                                                            Markets:                                                                                                                  Other
                                                                              13%                                                                                                                   Developed:
                                                                                                                                                                      Europe
                                                                     Japan:                                                                                           ex-U.K.:                         6%
                                                                       8%                                                   United                                      15%
                             Canada:                                                       Pacific:                        Kingdom:
                               4%                                                            5%                               3%
                Source: Standard & Poor’s, MSCI, IMF, FactSet, J.P. Morgan Asset Management.
                All return values are MSCI Gross Index (official) data. Share of global GDP based on purchasing power parity (PPP) as calculated by the IMF for 2011.
                Definition of emerging markets is based on MSCI and IMF data sources, respectively.
40              Data as of 3/31/12.
Global Economic Growth

                 Emerging Market Country Real GDP Growth
                                                                                                       Historical                     JPMSI Forecast
                 Year-over-year % chg. – forecasts from JPMSI
                 10%
                                                                                              1Q11   2Q11      3Q11   4Q11     1Q12   2Q12     3Q12    4Q12
                  8%

                  6%

                  4%

                  2%

                  0%

                 -2%
                        Emerging Markets           China              India         Mexico           Russia            Korea          South Africa       Brazil


                 Developed Market Country Real GDP Growth
                 Year-over-year % chg. – forecasts from JPMSI                                          Historical                     JPMSI Forecast
                 10%
                                                                                              1Q11   2Q11      3Q11   4Q11     1Q12    2Q12    3Q12    4Q12
                  8%
International


                  6%

                  4%

                  2%

                  0%

                  -2%
                            Developed                U.S.             Canada        Japan            Germany            U.K.            France            Italy
                            Countries
                Source: J.P. Morgan Global Economic Research, J.P. Morgan Asset Management.
                Forecast and aggregate data come from J.P. Morgan Global Economic Research.
                Data reflect most recently available as of 3/31/12.


41
Global Monetary Policy

                 Central Bank Assets – Percent of Nominal GDP                                                                                                 Real Policy Rates – Monthly
                 35%                                                                                                                                          4%

                 30%                                                                                                                                          3%

                 25%                                                                                                                                          2%
                                                               Bank of Japan
                 20%                                                                                                                                          1%

                 15%                                 European Central Bank                                                                                    0%

                 10%                                                                                                                                          -1%
                                                                                                                                                                                                 Emerging Markets
                                                                                                                                                              -2%
                  5%                                                     U.S. Federal Reserve                                                                                                    Developed Markets
                                                                                                                                                              -3%
                  0%                                                                                                                                                  '02                  '03            '04           '05            '06            '07              '08               '09       '10        '11       '12
                       '99   '00         '01      '02      '03    '04         '05       '06           '07     '08       '09   '10            '11

                 Country Level Monetary Policy and Inflation
                 14.0%                                                                                                                       Target Policy Rate                                             Inflation Rate                                        Real Policy Rate
                 10.5%
                  7.0%
                  3.5%
International


                  0.0%
                 -3.5%
                 -7.0%


                                                                                                                                                                                                                                                                                               China
                                                                                                                                                                            South Africa


                                                                                                                                                                                                                                                                             Indonesia
                                                                                                                                    Russia


                                                                                                                                                   Thailand


                                                                                                                                                                                                 Poland


                                                                                                                                                                                                                India


                                                                                                                                                                                                                                                            Colombia
                             Hong Kong


                                                                               Canada


                                                                                                            Australia


                                                                                                                                                                                                                                                                                                         Turkey
                                                                                                                                                                                                                                             Mexico
                                                                                                                                                              Korea


                                                                                                                                                                                                                              Taiwan
                                                                  Euro area
                                           U.K.


                                                        U.S.


                                                                                              Japan


                                                                                                                                                                                                                                                                                                                    Brazil
                                                  Developed Markets                                                                                                                                        Emerging Markets
                Source: J.P. Morgan Global Economics Research, J.P. Morgan Asset Management.
                (Top charts) Emerging and Developed Economy GDP growth and real policy rates represent GDP weighted aggregates estimated by J.P. Morgan
                Global Economics Research. (Bottom chart) Target policy rates are the short-term target interest rates set by central banks. Inflation rates shown
                represent year-over-year quarterly rates for 4Q11. Real policy rates are short-term target interest rates set by central banks minus year-over-year
                inflation.
42              Data are as of 3/31/12.
The Importance of Exports

                 Exports as a % of GDP – 2010
                 Goods exports only
                     Brazil 0.9% 2.1% 1.9%               4.7%           9.7%                                       U.S.          Eurozone           BRIC          Other    Total

                      India 1.5% 2.4%         2.0%                7.8%                  13.7%

                   Russia 0.8%                    10.1%                      1.9%                         12.5%                         25.3%

                     China            4.8%               4.8%         1.6%                                15.7%                             26.9%


                       U.S. 1.4% 1.2%             6.1%            8.8%

                    Japan      2.2%    1.6%       3.9%                  6.4%               14.1%

                       U.K.    1.9%                  9.3%                    1.1%      4.3%         16.6%

                   France 1.0%                        12.0%                         1.4%           5.5%           19.9%
International


                       Italy 1.2%                     11.6%                         1.7%             6.9%             21.4%

                  Canada                                        18.4%                                       2.3% 1.3%     2.6%     24.5%

                 Germany       2.0%                                            20.9%                                             3.7%                     10.1%             36.7%

                              0%               5%                 10%                      15%               20%                 25%                30%              35%            40%

                Source: IMF, J.P. Morgan Asset Management.
                Numbers represent exports of goods only, and would be higher if services were included.
                Data reflect most recently available as of 3/31/12.


43
The Impact of Global Consumers

                 Share of Global Nominal Consumption                                                       Foreign Sales, % of Total Sales
                 40%                                                                                       35%


                 35%                                                                                       30%                Mega Cap (Russell 200)


                 30%                                                                                       25%


                                                                                                                                                   Large Cap (Russell 1000)
                 25%                                                                                       20%


                 20%                            U.S. Consumption % of Global                               15%
International


                                                EM Consumption % of Global
                                                                                                                                                    Small Cap (Russell 2000)

                 15%                                                                                       10%
                       1990          1994          1998          2002         2006          2010                 '90    '92     '94   '96    '98     '00    '02    '04   '06   '08   '10
                Source: FactSet, Compustat, Russell, J.P. Morgan Global Economics Research, J.P. Morgan Asset Management.
                Estimates of global consumption for 2010 and 2011 provided by J.P. Morgan Global Economics Research.
                Foreign sales as a percentage of total sales is calculated as an unweighted average of individual index constituent companies’ reported sales figures
                and does not capture all index members due to differences in reporting practices.
                Data are as of 3/31/12.


44
European Crisis: Fiscal Challenges

                 GDP Growth, Debt to GDP and Borrowing Costs
                                                                                                                                          Example of Fiscal Redistribution in the U.S.
                                                                                                                  Bubble size = 10-year
                                                  8%
                                                                                                                 government bond yield

                                                             EM                                                              = 10%
                                                  6%

                                                                                                                            = 5%
                  Real GDP Growth (2010 – 2012)


                                                  4%


                                                           Germany
                                                                           U.S.
                                                  2%                              France
                                                                   E.U.
                                                                                                  Italy                                   The E.U. Lacks a Similar Fiscal Mechanism
                                                           Spain             Ireland
                                                  0%
                                                                                                          Portugal


                                                  -2%                                                                  Greece
International


                                                  -4%


                                                  -6%
                                                     20%   40%       60%     80%           100%           120%       140%     160%
                                                                      Net Debt-to-GDP Ratio (2011 est.)
                Source: IMF, BLS, J.P. Morgan Asset Management.
                Maps are for illustrative purposes only and are intended to show the current sources of stress in each region. The U.S. state colors are based on level
                of unemployment rate. European country colors are based on levels of sovereign stress, including but not exclusively the measure shown in the
                above chart on the left. Growth and debt data based on the September 2011 World Economic Outlook. Bond yields as of 3/31/12.
                Data are as of 3/31/12.
45
European Crisis: Financial System Risks

                European Bank Exposure – $ Billions                                             European Sovereign Funding Costs
                $400                                                                            10-year benchmark bond yields, daily
                               Derivative claims                                                18%                                             1st LTRO
                $300           Sovereign debt claims
                               and bank claims
                                                                                                16%
                $200                                                                                         Country Yield (3/31/12)
                                                                                                             Portugal   11.20%
                $100                                                                            14%          Ireland     6.79%
                                                                                                             Spain       5.35%
                                                                                                             Italy       5.12%
                   $0
                         Greek     Portugese     Irish     Spanish      Italian   U.S. banks    12%
                                                                                  exposure to
                          Exposure of all European banks to each country’s
                                                                                   all GIIPS
                          public sector, banking sector and derivative claims

                European Central Bank Balance Sheet                                             10%
                Trillions of Euros
                 €3.0                                                   Feb. 2012: €2.7tn
                                                                                                 8%
International


                 €2.5
                                                                                                 6%


                 €2.0                                                                            4%


                 €1.5
                                                                                                 2%
                    Jan-10            Jul-10         Jan-11           Jul-11        Jan-12       Dec-09           Jun-10   Dec-10      Jun-11     Dec-11
                Source: FactSet, BIS, ECB, J.P. Morgan Asset Management.
                Bank exposure based on 4Q11 data. LTRO refers to the ECB’s December Long-Term Refinancing Operation.
                Data are as of 3/31/12.

46
Chinese Growth and Economic Policy

                 China & U.S. Contribution to Global GDP Growth                                         Chinese Inflation and the Money Supply
                 Share of year-over-year change in nominal global GDP                                   Year-over-year % change
                 40%                                                                                     10%                                                                                   30%
                                                                                     China                                              Most Recent
                 35%                                                                 United States        8%           CPI (LHS)           3.2%
                 30%                                                                                                   M2 (RHS)           13.0%                                                25%
                                                                                                          6%
                 25%

                 20%                                                                                      4%                                                                                   20%

                 15%                                                                                      2%
                 10%                                                                                                                                                                           15%
                                                                                                          0%
                   5%

                   0%                                                                  *                 -2%                                                                                   10%
                        '81   '84    '87    '90    '93   '96   '99   '02     '05     '08   '11   '14            '00         '02         '04         '06         '08         '10          '12

                 Components of Chinese Nominal GDP                                                       Chinese Currency
                 100%
                                    Net Exports: 3%                         Net Exports: 2%              Chinese Renminbi per USD, inverted
                                                                                                          6.0
                                    Government: 13%                        Government 13%                                                                                   Mar. '12: 6.30
                  80%
                                      Investment                                                          6.5
International


                                       Spending                              Investment
                  60%                     35%                                 Spending
                                                                                                          7.0                                                         May '10 – Mar. ‘12:
                                                                                51%                                           Jun. '05 – Jul. '08:
                                                                                                                                                                                  +5.9%
                  40%
                                                                                                          7.5
                                                                                                                                          +17.5%
                                     Consumption
                  20%                    49%                                Consumption                   8.0
                                                                               34%

                   0%                                                                                     8.5
                                           1990                                    2010                         '02   '03         '04   '05   '06         '07   '08   '09         '10   '11

                Source: (Top left) IMF, J.P. Morgan Asset Management. (Top right) National Bureau of Statistics, J.P. Morgan Economics, J.P. Morgan Asset Management. (Bottom left)
                IMF, J.P. Morgan Asset Management. (Bottom right) FactSet, J.P. Morgan Asset Management.
                *In 2009, global growth was negligible, while Chinese growth was robust, which resulted in China contributing over 1200% to global growth.
                Calculations based on PPP exchange rates and 2012 – 2016 growth forecasts are from the IMF.
                Data reflect most recently available as of 3/31/12.
47
Global Equity Valuations – Developed and Emerging Markets

                 Developed Market Countries                                                                                                                 Example
                                                +6 Std Dev
                  Std Dev from Global Average


                                                +5 Std Dev                                                                                                                       Expensive
                                                +4 Std Dev                                                                                                                       relative to
                                                +3 Std Dev                                                                                                                            world
                                                +2 Std Dev
                                                +1 Std Dev                                                                                                        Expensive
                                                                                                                                                              relative to own    Current
                                                  Average
                                                                                                                                                                       history
                                                -1 Std Dev                                                                                                                       Average
                                                -2 Std Dev                                                                                                  Cheap relative to
                                                -3 Std Dev                                                                                                      own history         Cheap
                                                -4 Std Dev
                                                                                                                                                                                 relative to
                                                -5 Std Dev
                                                                                                                                                                                      world
                                                               World   EAFE    France   Germany    U.K.    Australia   Japan    Canada Switzerland United
                                                              (ACWI)                                                                               States

                 Emerging Market Countries
                                                +6 Std Dev
                                                                                                                                                            Note: Each valuation index
                                                                                                                                                            shows an equally weighted
                  Std Dev from Global Average


                                                +5 Std Dev
                                                +4 Std Dev                                                                                                  composite of four metrics:
                                                +3 Std Dev                                                                                                  price to forward earnings
                                                +2 Std Dev                                                                                                  (Fwd. P/E), price to current
                                                +1 Std Dev
                                                                                                                                                            book (P/B), price to last 12
International


                                                   Average
                                                                                                                                                            months’ cash flow (P/CF) and
                                                 -1 Std Dev
                                                 -2 Std Dev
                                                                                                                                                            price to last 12 months’
                                                 -3 Std Dev
                                                                                                                                                            dividends normalized using
                                                 -4 Std Dev                                                                                                 means and average
                                                 -5 Std Dev                                                                                                 variability over the last 10
                                                               World    EM     Russia   China     Brazil   Taiwan      South    Korea   Mexico    India     years.
                                                              (ACWI)   Index                                           Africa
                Source: MSCI, FactSet, J.P. Morgan Asset Management.
                Note: Each valuation index shows an equally weighted composite of four metrics: price to forward earnings (Fwd. P/E), price to current book
                (P/B), price to last 12 months’ cash flow (P/CF) and price to last 12 months’ dividends. Results are then normalized using means and average
                variability over the last 10 years. The grey bars represent valuation index variability relative to that of the All Country World Index (ACWI). See
                disclosures page at the end for metric definitions.

48              Data are as of 3/31/12.
International Economic and Demographic Data

                 Economics                                                                                   Demographics
                                     GDP USD GDP Per               GDP          Unempl.       Inflation                      Population Percent               Median         Migration
                                                                                                 (CPI)
                                                                                                             Population
                                      (B$s)   Capita              Growth         Rate                                         Growth    Age >65                Age           per 1000
                 Developed
                  U.S.                $15,094       $48,147         3.0%          8.3%          2.9%          314 mm            0.9%           13.1%          36.9 yrs          +3.6
                    Canada                1,759      51,147          1.8           7.4            2.6             34              0.8            15.9           41.0            +5.7
                    U.K.                  2,481      39,604          -0.8          8.3            3.4             63              0.6            16.5           40.0            +2.6
                    Germany               3,629      44,556          -0.7          5.8            2.4             81             -0.2            20.6           44.9             +.7
                    France                2,808      44,401          0.9           10.0           2.3             66              0.5            16.8           39.9            +1.1
                    Japan                 5,855      45,774          -0.7          4.6            0.1            127             -0.1            22.9           44.8               -
                    Italy                 2,246      37,046          -2.9          9.2            3.3             61              0.4            20.3           43.5            +4.7
                 Emerging
                    Russia                1,885      13,236          7.0           6.5            3.7            138             -0.5            13.0           38.7            +0.3
                    Mexico                1,185      10,803          1.7           5.2            3.9            115              1.1            6.6            27.1            -3.1
                    Brazil                2,518      12,917          1.3           5.7            5.8            206              1.1            6.7            29.3            -0.1
International


                    China                 6,988       5,184          9.2           4.1            3.2           1,343             0.5            8.9            35.5            -0.3
                    India                 1,843       1,527          3.8           9.8            5.2           1,205             1.3            5.5            26.2            -0.1
                Source: FactSet, Eurostat, CIA, J.P. Morgan Securities, J.P. Morgan Asset Management.
                GDP levels represent 2011 data and are from the September 2011 World Economic Outlook published by the IMF, except for the U.S. levels, which come directly from the
                BEA. All GDP Growth data are from J.P. Morgan Economics and expressed as % change versus prior quarter annualized. All GDP Growth data are for 4Q11. India
                unemployment is from CIA estimates and is as of 2011, and Italy unemployment is as of 1/31/12. CPI Inflation is shown as % change versus a year ago and all data are for
                February 2012, except for India and Japan, which are as of January 2012. Unemployment rate for developed countries refers to February 2012 and comes from FactSet
                Economics, Eurostat and Statistics Canada. Demographic data provided by CIA World Factbook at CIA.gov.
                Data are as of 3/31/12.


49
Current Account Deficit and U.S. Dollar

                 Current Account Balance, % of GDP                                                    U.S. Dollar Index
                                                                                                      Nominal trade-weighted exchange index: major currencies
                  -8%
                                                                                                      115

                                                                           4Q05:
                                                                                                      110
                                                                           -6.5%

                  -6%                                                                                 105


                                                                                                      100


                                                                                                       95
                  -4%                                                                      4Q11:
                                                                                           -3.2%
                                                                                                       90
                                                                                                                                                                  Mar. 2009:
                                                                                                       85                                                               84.0

                  -2%
                                                                                                       80
International


                                                                                                       75

                   0%
                                                                                                       70                                           Mar. 2008: 70.3
                                                                                                                                                                       Mar. 2012: 72.9
                                                                                                       65
                      '92     '94     '96     '98     '00     '02    '04   '06     '08   '10   '12               '94     '96   '98    '00     '02     '04   '06        '08   '10   '12
                Source: BEA, FactSet, J.P. Morgan Asset Management.                                  Source: Federal Reserve, FactSet, J.P. Morgan Asset Management.
                Data are as of 3/31/12 and are reported quarterly.                                   Data are as of 3/31/12.


50
Asset Class Returns

                                                                                                                                                                           10-yrs
                2000        2001       2002        2003        2004        2005       2006        2007        2008       2009        2010        2011      . 1Q '12       '02 - '11
                                      DJ UBS       M SCI                  M SCI                   M SCI     Barclays     M SCI                               M SCI          M SCI
               REITs       REITs                              REITs                   REITs                                          REITs      REITs
                                      Cmdty        EM E                   EM E                    EM E        Agg        EM E                                EM E           EM E
                26.4%       13.9%      23.9%       56.3%       31.6%      34.5%       35.1%       39.8%      5.2%        79.0%       28.0%       8.3%        14.1%         277.2%
               DJ UBS      M arket   Barclays     Russell      M SCI     DJ UBS       M SCI       M SCI      M arket     M SCI      Russell    Barclays       S&P
                                                                                                                                                                           REITs
               Cmdty       Neutral     Agg         2000        EM E       Cmdty       EM E        EAFE       Neutral     EAFE        2000        Agg          500
                24.2%       9.3%      10.3%        47.3%       26.0%      17.6%       32.6%       11.6%       1.1%*      32.5%       26.9%      7.8%         12.6%         164.2%
               M arket    Barclays    M arket      M SCI       M SCI      M SCI       M SCI      DJ UBS      Asset                   M SCI      M arket     Russell       Barclays
                                                                                                                         REITs
               Neutral      Agg       Neutral      EAFE        EAFE       EAFE        EAFE        Cmdty      Alloc.                  EM E       Neutral      2000           Agg
                15.0%      8.4%        7.4%        39.2%       20.7%      14.0%       26.9%       11.1%      -23.8%      28.0%       19.2%       4.5%        12.4%         75.4%
              Barclays    Russell                             Russell                Russell     M arket    Russell     Russell     DJ UBS       S&P         M SCI         Asset
                                       REITs       REITs                  REITs
                Agg        2000                                2000                   2000       Neutral     2000        2000       Cmdty        500         EAFE          Alloc.
               11.6%       2.5%         3.8%       37.1%       18.3%       12.2%      18.4%       9.3%      -33.8%       27.2%       16.7%       2.1%        11.0%         73.5%
               Asset       M SCI       Asset       S&P        Asset       Asset        S&P        Asset     DJ UBS        S&P        S&P        Asset                     Russell
                                                                                                                                                             REITs
               Alloc.      EM E        Alloc.       500       Alloc.      Alloc.       500        Alloc.    Cmdty         500         500       Alloc.                     2000
                0.6%       -2.4%       -5.4%       28.7%      12.5%       8.0%        15.8%       7.3%      -36.6%       26.5%       15.1%      -0.2%        10.5%         72.8%
               Russell     Asset       M SCI       Asset        S&P      M arket      Asset     Barclays      S&P        Asset       Asset      Russell      Asset        M arket
                2000       Alloc.      EM E        Alloc.       500      Neutral      Alloc.      Agg          500       Alloc.      Alloc.      2000        Alloc.       Neutral
                -3.0%      -3.4%       -6.0%       25.2%       10.9%      6.1%        14.9%      7.0%        -37.0%      22.5%       12.7%       -4.2%        7.5%        72.7%
                S&P         S&P        M SCI      DJ UBS      DJ UBS       S&P       M arket      S&P                   DJ UBS       M SCI       M SCI      M arket        M SCI
                                                                                                             REITs
                 500        500        EAFE       Cmdty       Cmdty        500       Neutral      500                    Cmdty       EAFE        EAFE       Neutral        EAFE
                -9.1%      -11.9%      -15.7%      22.7%       7.6%        4.9%       11.2%       5.5%       -37.7%      18.7%       8.2%        -11.7%      1.5%          64.8%
               M SCI        M SCI     Russell     M arket     M arket    Russell    Barclays     Russell      M SCI     Barclays   Barclays     DJ UBS      DJ UBS        DJ UBS
               EAFE        EAFE        2000       Neutral     Neutral     2000        Agg         2000       EAFE         Agg        Agg        Cmdty       Cmdty          Cmdty
Asset Class


               -14.0%      -21.2%     -20.5%       7.1%        6.5%       4.6%        4.3%        -1.6%      -43.1%       5.9%       6.5%        -13.4%      0.9%          58.0%
                M SCI        DJ UBS         S&P      Barclays Barclays Barclays DJ UBS                             M SCI        M arket     M arket     M SCI  Barclays    S&P
                                                                                                      REITs
                 EM E         Cmdty         500         Agg          Agg         Agg      Cmdty                     EM E       Neutral      Neutral      EM E     Agg       500
                -30.6%        -22.3%       -22.1%       4.1%        4.3%         2.4%      -2.7%      -15.7%      -53.2%         4.1%        -2.5%      -18.2%    0.3%     33.4%
              Source: Russell, MSCI, Dow Jones, Standard and Poor’s, Credit Suisse, Barclays Capital, NAREIT, FactSet, J.P. Morgan Asset Management.
              The “Asset Allocation” portfolio assumes the following weights: 25% in the S&P 500, 10% in the Russell 2000, 15% in the MSCI EAFE, 5% in the MSCI EMI,
              30% in the Barclays Capital Aggregate, 5% in the CS/Tremont Equity Market Neutral Index, 5% in the DJ UBS Commodity Index and 5% in the NAREIT Equity
              REIT Index. Balanced portfolio assumes annual rebalancing. All data except commodities represent total return for stated period. Past performance is not
              indicative of future returns. Data are as of 3/31/12, except for the CS/Tremont Equity Market Neutral Index, which reflects data through
              2/29/12. “10-yrs” returns represent cumulative total return and are not annualized. These returns reflect the period from 1/1/02 – 12/31/11.
              Please see disclosure page at end for index definitions. *Market Neutral returns include estimates found in disclosures.
51            Data are as of 3/31/12.
Correlations: 10-Years
                                                                                                                                                                           Eq
                                       Large          Small                                      Core          Corp.                                         Hedge       Market
                                        Cap           Cap            EAFE          EME          Bonds           HY            EMD          Cmdty.    REITs   Funds       Neutral*

                      Large Cap         1.00           0.95           0.91         0.85          -0.31           0.79          0.68           0.45   0.76      0.77         0.50

                      Small Cap                        1.00           0.88         0.81          -0.35           0.73          0.61           0.40   0.82      0.74         0.48

                          EAFE                                        1.00         0.92          -0.22           0.74          0.64           0.52   0.73      0.85         0.66

                           EME                                                     1.00          -0.18           0.80          0.75           0.59   0.65      0.88         0.54

                    Core Bonds                                                                    1.00          -0.11          0.15          -0.25   -0.04    -0.22        -0.02

                       Corp. HY                                                                                  1.00          0.86           0.52   0.69      0.77         0.40

                           EMD                                                                                                 1.00           0.41   0.60      0.64         0.35

                   Commodities                                                                                                                1.00   0.39      0.70         0.49

                          REITs                                                                                                                      1.00      0.59         0.50

                   Hedge Funds                                                                                                                                 1.00         0.57
Asset Class


              Eq Market Neutral*                                                                                                                                            1.00
                                   Source: Standard & Poor’s, Russell, Barclays Capital Inc., MSCI Inc., Credit Suisse/Tremont, NCREIF, DJ UBS, J.P. Morgan Asset Management.
                                   Indexes used – Large Cap: S&P 500 Index; Small Cap: Russell 2000; EAFE: MSCI EAFE; EME: MSCI Emerging Markets; Bonds: Barclays
                                   Capital Aggregate; Corp HY: Barclays Capital Corporate High Yield; EMD: Barclays Capital Emerging Market; Cmdty.: DJ UBS Commodity Index;
                                   Real Estate: NAREIT Equity REIT Index; Hedge Funds: CS/Tremont Multi-Strategy Index; Equity Market Neutral: CS/Tremont Equity Market
                                   Neutral Index. *Market Neutral returns include estimates found in disclosures.
                                   All correlation coefficients calculated based on quarterly total return data for period 12/31/01 to 12/31/11.
                                   This chart is for illustrative purposes only.
52
Mutual Fund Flows

                                                                                                       Fund Flows
               Billions, USD                        AUM YTD 2012             2011       2010 2009 2008 2007 2006 2005 2004 2003 2002 2001 2000
               Domestic Equity                    4,254          (5)         (135)       (95)     (28)      (148) (65)       (0)     18      101     120      (26)      55      261
               World Equity                       1,535          4             5         58       28        (80)   139     149      106      71       24          (3)   (22)    53
               Taxable Bond                       2,525         49           136         230      311       22     97       45       26       5       40      125       76      (36)
               Tax-exempt Bond                     522          13           (12)        11       69         8     11       15        5      (15)     (7)     17        11      (14)
               Hybrid                               903         16            30         24       10        (26)   42       18       37      49       38          9      9      (36)
               Money Market                       2,653         (39)         (124)      (525) (539) 637            654     245       62     (157) (263) (46)            375     159

               U.S. Equity Fund Flows and Market Performance                                         Difference Between Flows Into Stock and Bond Funds
               Billions USD, U.S. equity funds, quarterly                                            Billions, USD, U.S. and international funds, monthly
               $120    Equity Flows                                          S&P 500       1600      $40
                                                                                                                                          Bond flows exceeded equity flows
               $100
                                                                                           1400                                              by $35 billion in February 2012
                $80                                                                                  $20

                $60                                                                        1200

                $40                                                                                    $0
                                                                                           1000
                $20
                                                                                           800      -$20
                 $0
Asset Class


               -$20                                                                        600
                                                                                                    -$40
               -$40
                                                                                           400
               -$60
                                                                                                    -$60
               -$80                                                                        200
                                                                                                       Mar '08 Sep '08          Mar '09 Sep '09 Mar '10 Sep '10    Mar '11 Sep '11
                     '90 '92 '94 '96 '98 '00 '02 '04 '06 '08 '10 '12
              Source: Investment Company Institute, J.P. Morgan Asset Management.
              Data include flows through February 2012 and exclude ETFs. ICI data are subject to periodic revisions. World equity flows are inclusive of
              emerging market, global equity and regional equity flows. Hybrid flows include asset allocation, balanced fund, flexible portfolio and mixed
              income flows.
53            Data are as of 3/31/12.
Dividend Income: Domestic and Global

               S&P 500 Total Return: Dividends vs. Capital Appreciation
               Average annualized returns                                                                                                                           Capital appreciation
                20%                                                                                                                                                 Dividends

                15%
                            13.9%                                               13.6%
                10%                                                                                                              12.6%        15.3%
                                                                  3.0%                                          1.6%                                                                    5.5%
                 5%                                                                               4.4%
                                                5.4%              6.0%             5.1%                                                                              1.8%
                               4.7%                                                               3.3%          4.2%             4.4%                                                   4.1%
                                                                                                                                               2.5%
                 0%
                                                                                                                                                                    -2.7%
                                               -5.3%
                -5%

               -10%
                         1926 - 1929           1930's             1940's        1950's           1960's        1970's            1980's       1990's                2000's        1926 to 2011

                REIT Dividend Yields                                                                      Equity Dividend Yields
                Major world markets by capitalization                                                     Major world markets by capitalization
                                                                               10-year government         6%                                                                 10-year government
                 7%                   6.4%
                                              6.2%                             bond yield                                                                                    bond yield
                                                                                                                          4.8%
                 6%                                      5.4%                                             5%
                                                                    5.3%                                                             4.4%
                                                                            5.1%
                 5%                                                                                                                          3.7%
                                                                                          4.3%   4.2%     4%
                                                                                                                                                         3.5%
                 4%     3.5%
                                                                                                                                                                     2.7%        2.8%
                                                                                                          3%
                                                                                                                                                                                           2.3%
Asset Class


                 3%
                                                                                                          2%
                 2%                                                                                             2.0%

                                                                                                          1%
                 1%

                 0%                                                                                       0%
                        U.S.     Singapore   Australia   France    Canada   Japan     Global     U.K.            U.S.   Australia   France   U.K.     Switzerland    ACWI       Canada     Japan

              Source: (Top chart) Standard & Poor’s, Ibbotson, J.P. Morgan Asset Management. (Bottom left) FactSet, NAREIT, J.P. Morgan Asset Management.
              Yields shown are that of the appropriate FTSE NAREIT REIT index, which excludes property development companies. (Bottom right) FactSet, MSCI,
              J.P. Morgan Asset Management. Yields shown are that of the appropriate MSCI index.
              Data are as of 3/31/12.
54
Global Commodities

                Commodity Prices                                                                  Oil Demand: Emerging Markets Share
                Weekly index prices rebased to 100                                                Emerging markets as % of total global oil consumption
                                                                                                  40%
                600

                                                                           Precious metals        38%


                                                                                                  36%
                500

                                                                                                  34%
                                                    Industrial metals
                                                                                                  32%
                400

                                                                                                  30%
                                                                                                          '96     '97    '98   '99    '00    '01   '02   '03     '04   '05   '06     '07   '08   '09     '10
                                        Energy
                300                                                                               Commodity Prices and Inflation
                                                                                                  Year over year % chg.
                                                                                                  8%
                                                                                                                                             DJ-UBS Commodity Index (Y/Y % chg.) 80%
                                                                                                  6%                                                                                                     60%
                200
                                                                                                  4%                                                                                                     40%
                                                                                        Grains
                                                                                                  2%                                                                                                     20%
Asset Class


                100                                                                               0%                                                                                                     0%

                                                                                                  -2%                                                                                                    -20%

                                                                                  Livestock       -4%   Headline CPI (Y/Y % chg.)                                                                        -40%

                   0                                                                              -6%                                                                                                    -60%
                       '02    '03     '04     '05      '06     '07   '08    '09   '10    '11                '94         '96     '98         '00    '02         '04     '06     '08         '10     '12

              Source: Dow Jones/UBS, FactSet, J.P. Morgan Asset Management.                      Source: (Top) USDA, BP Statistical Review of World
                                                                                                 Energy, J.P. Morgan Asset Management. (Bottom) BLS,
              Commodity prices represented by the appropriate DJ/UBS Commodity sub-index.        DJ/UBS, FactSet, J.P. Morgan Asset Management
              Data reflect most recently available as of 3/31/12.
55                                                                                               Data are as of 3/31/12.
Gold

               Gold Prices                                                                                                              World Gold Production
               $ / oz                                                                                                              Year   Troy Ounces     Total Value
               $2,000
                                                                                                                                   2000             83.3 mm     $23 bn

               $1,800                                       Gold
                                                                                                                                   2001             83.6 mm     $23 bn
                                                            Gold, Inflation adjusted
                                                                                                         Mar. 2012:
               $1,600
                                                                                                          $1,662.50                2002             82.0 mm     $25 bn

               $1,400
                                                                                                                                   2003             81.7 mm     $30 bn

               $1,200
                                                                                                                                   2004             77.8 mm     $32 bn

               $1,000               Jan. 1980:
                                      $850.00                                                                                      2005             79.4 mm     $35 bn

                 $800                                                                                                              2006             76.2 mm     $46 bn


                 $600                                                                                                              2007             75.9 mm     $53 bn
                            Jan. 1980:
                              $433.72                                                                        Mar. 2012:
                 $400                                                                                          $318.46             2008             73.6 mm     $64 bn
Asset Class


                 $200                                                                                                              2009             78.8 mm     $86 bn


                    $0                                                                                                             2010             80.4 mm     $113 bn
                              '75         '80         '85         '90         '95         '00         '05          '10
              Source: (Left chart) EcoWin, BLS, U.S. Department of Energy, FactSet, J.P. Morgan Asset Management. (Right table) U.S. Geological Survey, World
              Gold Council, J.P. Morgan Asset Management. CPI adjusted gold values are calculated using month averages of gold spot prices divided by the CPI
              value for that month. CPI is rebased to 100 at the start of the chart.
              Data reflect most recently available as of 3/31/12.
56
Historical Returns by Holding Period

               Range of Stock, Bond and Blended Total Returns
               Annual total returns, 1950 – 2011
                60%                                                                                                   Annual Avg. Growth of $100,000
                                                                                                                      Total Return     over 20 years
                50%                                                                                Stocks                   10.8%                  $771,337
                                51%
                                                                                                   Bonds                     6.3%                  $337,713
                40%                     43%                                                        50/50 Portfolio           8.9%                  $552,853


                30%                             32%
                                                                 28%
                20%                                                     23%
                                                                               21%                 19%
                                                                                                          16% 17%                      18%
                10%                                                                                                                                14%
                                                                                                                                             12%
                                                                                                                                       6%           5%
                  0%                                              -2% -2% 1%                                     2%
                                                                                                    -1% 1%                                   1%
                                        -8%
               -10%                             -15%
                                                                                                                         Stocks
               -20%                                                                                                      Bonds
Asset Class


                                                                                                                         50/50 Portfolio

               -30%
                               -37%

               -40%
                                        1-yr.                       5-yr. rolling                    10-yr. rolling                     20-yr. rolling
              Sources: Barclays Capital, FactSet, Robert Shiller, Strategas/Ibbotson, Federal Reserve, J.P. Morgan Asset Management.
              Data are as of 3/31/12.


57
Diversification and the Average Investor
                                                                                                                              (Top) Indexes and weights of the
              Maximizing the Power of Diversification (1994 – 2011)                                                           traditional portfolio are as follows:
                    Traditional Portfolio                             More Diversified Portfolio                              U.S. stocks: 55% S&P 500, U.S.
                                                                                                                              bonds: 30% Barclays Capital
                                                                                                        Equity Mkt. Neutral   Aggregate. International stocks:
                                                                                                                              15% MSCI EAFE. Portfolio with 25%
                                                                                                        Commodities           in alternatives is as follows: U.S.
                                                                                     8%                                       stocks: 22.2% S&P 500, 8.8%
                                                                                                        REIT                  Russell 2000; International Stocks:
                                                    S&P 500                 26%           8%                                  4.4% MSCI EM, 13.2% MSCI EAFE;
                    30%
                                                                                               8%       S&P 500               U.S. Bonds: 26.5% Barclays Capital
                                   55%              MSCI EAFE                                                                 Aggregate; Alternatives: 8.3%
                                                                                                        Russell 2000          CS/Tremont Equity Market Neutral,
                                                                    4%                                                        8.3% DJ/UBS Commodities, 8.3%
                                                    Barclays Agg.                         22%                                 NAREIT Equity REIT Index. Return
                    15%                                                     13%                         MSCI EAFE
                                                                                                                              and standard deviation calculated
                                                                                  9%                                          using Morningstar Direct.
                                                                                                        MSCI EM
                                                                                                                              Charts are shown for illustrative
                                                                                                                              purposes only. Past returns are no
                                                                                                        Barclays Agg.         guarantee of future results.
                                                                                                                              Diversification does not guarantee
                    Return: 6.75%                                        Return: 7.09%                                        investment returns and does not
              Standard Deviation: 10.94%                            Standard Deviation: 9.97%                                 eliminate risk of loss. Data are as of
                                                                                                                              12/31/11.
              20-year Annualized Returns by Asset Class (1992 – 2011)                                                         (Bottom) Indexes used are as
                                                                                                                              follows: REITS: NAREIT Equity REIT
              12%                                                                                                             Index, EAFE: MSCI EAFE, Oil: WTI
                     10.9%
                                                                                                                              Index, Bonds: Barclays Capital U.S.
                                                                                                                              Aggregate Index, Homes: median
              10%                                                                                                             sale price of existing single-family
                                 8.6%                                                                                         homes, Gold: USD/troy oz, Inflation:
                                             7.8%         7.6%                                                                CPI. Average asset allocation
               8%                                                                                                             investor return is based on an
                                                                    6.5%                                                      analysis by Dalbar Inc., which utilizes
Asset Class


                                                                                                                              the net of aggregate mutual fund
               6%                                                                                                             sales, redemptions and exchanges
                                                                                                                              each month as a measure of investor
                                                                                  4.0%
                                                                                                                              behavior. Returns are annualized
               4%
                                                                                                                              (and total return where applicable)
                                                                                               2.5%     2.5%                  and represent the 20-year period
                                                                                                                    2.1%
               2%                                                                                                             ending 12/31/11 to match Dalbar’s
                                                                                                                              most recent analysis.

               0%
                     REITs        Oil       S&P 500       Gold      Bonds         EAFE      Inflation   Homes     Average
                                                                                                                  Investor
58
Annual Returns and Intra-year Declines

               Intra-year Declines vs. Calendar Year Returns
               Despite average intra-year drops of 14.5%, annual returns positive in 25 of 32 years
                50%


                                                                                                           34
                35%                                                                                                  31
                           26                          26                   27         26                                  27                            26
                                                                                                                                                                                          23
                                                                                                                20               20
                20%                         17
                                      15                    15                                                                                                           14
                                                                       12                                                                                                                       13
                                                                                                                                                               9
                                -10                                              -7              7    -2
                                                                                            4                                          -10 -13 -23
                                                                                                                                                                    3         4
                  5%                             1               2
                                                                                                                                                                                    -38                0


                                                                                                           -3
               -10%                                                                    -6   -6   -5
                                            -7         -8              -8   -8                                  -8                                             -8   -7   -8
                                                            -9                                        -9                                                                      -10
                                                 -12                                                                 -11         -12
                                      -14                                                                                                                -14
                         -17 -17                                                                                                       -17                                                      -16
                                                                                 -20                                       -19                                                                        -19
               -25%
                                                                                                                                             -26                                          -28
                                                                                                                                                   -32
                                                                 -34
               -40%
Asset Class


                                                                                                                                                                                    -47
               -55%
                         '80 '81 '82 '83 '84 '85 '86 '87 '88 '89 '90 '91 '92 '93 '94 '95 '96 '97 '98 '99 '00 '01 '02 '03 '04 '05 '06 '07 '08 '09 '10 '11
              Source: Standard and Poor’s, FactSet, J.P. Morgan Asset Management.
              Returns are based on price index only and do not include dividends. Intra-year drops refers to the largest market drops over periods of 6 months or
              less. For illustrative purposes only.
              Data are as of 3/31/12.

59
Alternative Investment Returns

               Hedge Funds (as of 12/31/11)                                  1 year                 3 year                 5 year              10 year
               CSFB/Tremont HF Index                                          -2.5%                  8.6%                    3.2%                 6.4%
               Multi-Strategy                                                  1.8%                 11.5%                    3.1%                 6.6%
               Distressed                                                     -4.2%                  8.5%                    1.9%                 7.4%
               Convertible Arbitrage                                           1.1%                 18.2%                    3.5%                 4.7%
               Equity Market Neutral*                                          4.5%                  2.5%                    3.6%                 5.6%
               Risk Arbitrage**                                                0.8%                  5.2%                    4.2%                 4.2%
               Fixed Income Arbitrage**                                        4.7%                 14.5%                    2.1%                 4.0%
               Global Macro                                                    6.4%                 10.4%                    8.6%                10.6%

               Real Estate (as of 12/31/11)                                  1 year                 3 year                 5 year              10 year
               NCREIF Property Index                                         14.3%                    2.4%                   3.1%                 8.1%
               Apartment                                                     15.5%                    4.0%                   3.1%                 8.0%
               Industrial                                                    14.6%                    1.0%                   2.2%                 7.3%
               Office                                                        13.8%                    0.9%                   2.8%                 7.1%
               Retail                                                        13.8%                    4.5%                   4.4%                10.7%

               Private Equity (as of 9/30/11)                                1 year                 3 year                 5 year              10 year
               U.S. Venture Capital Index                                    20.9%                    4.9%                   6.7%                 2.6%
               U.S. Private Equity Index                                     13.8%                    7.3%                   8.1%                11.6%
Asset Class


              Source: Cambridge Associates LLC, NCREIF, CS/Tremont, J.P. Morgan Asset Management. Cambridge PE and VC data provided at
              no charge. Other indexes shown are unmanaged and are for illustrative purposes only. Past performance is no guarantee of future
              results. Returns for all periods are as of 12/31/11 with the exception of Private Equity and Venture Capital returns, which are as of
              9/30/11. All returns are annualized for periods greater than 1 year. Investing in alternative assets involves higher risks than traditional
              investments and is suitable only for the long term. They may not be tax efficient and have higher fees than traditional investments. They
              may also be highly leveraged and engage in speculative investment techniques, which can magnify the potential for investment loss or
              gain.
              *Market Neutral returns include estimates found in disclosures.
              **Arbitrage is the simultaneous purchase and sale of an asset in order to profit from a difference in the price.
              Data are as of 3/31/12.
60
Cash Accounts

              Annual Income Generated by $100,000 Investment in a 6-month CD                                                                                               Weight in
               $10,000                                                                                                          Money Supply
                                                                                                                                                              $ Billions    Money
                                                                                                                                Component
                                                                                                                                                                            Supply
                $8,000
                                                                                             2006: $5,240
                $6,000                                                                                                            M2-M1                           7,565      76.2%

                $4,000
                                                                                                                      2011:
                                                                                                                      $419          Retail MMMFs                    661      6.7%
                $2,000


                     $0                                                                                                             Savings deposits              6,167     62.1%
                          1986         1990           1994           1998            2002           2006           2010

               Cash Accounts Total Household Financial Assets
               Cash as a % of                                                                                                       Small time deposits             738      7.4%
               28%
               6-month CD rate vs. Core CPI
                                                                                         Mar. ’09 S&P 500 low
               24%                         Oct. ’02 S&P 500 low                                                                   Institutional MMMFs             1,721      17.3%


               20%                                                                                                                Cash in IRA & Keogh
                                                                                                                                                                    639      6.4%
                                                                                                                                  accounts
               16%
Asset Class


               12%                                                                                                              Total                             9,924     100.0%

                            '98             '00           '02           '04           '06         '08            '10
              Source: Federal Reserve, St. Louis Fed, Bankrate.com, J.P. Morgan Asset Management. All cash measures obtained from the Federal Reserve are
              seasonally adjusted monthly numbers. All numbers are in billions of U.S. dollars.
              Small-denomination time deposits are those issued in amounts of less than $100,000. All IRA and Keogh account balances at commercial banks
              and thrift institutions are subtracted from small time deposits.
              Annual income is for illustrative purposes and is calculated based on the 6-month CD yield on average during each year and $100,000 invested.
              IRA and Keogh account balances at money market mutual funds are subtracted from retail money funds.
              Past performance is not indicative of comparable future results.
              Data are as of 3/31/12.
61
Corporate DB Plans and Endowments

                Asset Allocation: Corporate DB Plans vs. Endowments                                     Defined Benefit Plans – Funded Status: S&P 500 companies
                        Endowments                                                                                            overfunded                          underfunded
                        Corporate Defined Benefit Plans                                                                                                                              8%
                                                                          32.0%
                                                                                                                               22%
                      Equities
                                                                                          45.3%


                Fixed Income
                                                    13.0%
                                                                                                                                      78%                                                 92%
                                                                              35.5%


                                                                21.9%
                Hedge Funds
                                     2.7%                                                                                             1999                                                2010
                                                  10.7%                                                Pension Return Assumptions: S&P 500 companies
                Private Equity                                                                                          40%                                                                 1999: Average 9.2%
                                       4.7%
                                                                                                                                                          33%                               2010: Average 7.4%
                                                                                                                                                                                    29%
                                         6.1%                                                                           30%                                          27% 27%
                  Real Estate
                                     3.1%
                                                                                                       % of companies
                                                                                                                                                                                               20%
                                                                                                                        20%
                                                                                                                                    16%        16%
                                                   12.2%
                        Other
Asset Class


                                      4.1%                                                                                                                      9%
                                                                                                                        10%                                                    8%                         7%
                                                                                                                                                     5%
                                      4.0%                                                                                     2%         1%                                              0%         0%        0%
                        Cash
                                       4.7%                                                                             0%
                                                                                  % of total                                   < 7%        7 to      7.5 to      8 to    8.5 to      9 to      9.5 to     > 10%
                                                                                                                                          7.5%        8%         8.5%     9%         9.5%      10%
                                0%          10%           20%       30%         40%         50%                                                                 return assumption
              Source: NACUBO (National Association of College and University Business Officers), Towers Watson, Compustat/FactSet, J.P. Morgan Asset
              Management. Endowments represents dollar-weighted average data of 842 colleges and universities. Pension Return Assumptions based on all
              available and reported data from S&P 500 Index companies. Funded Status based on 351 companies reporting pension funding status as of
              3/31/11. Return assumption bands are inclusive of upper range. All information is shown for illustrative purposes only. Data are as of 12/31/10.
62
J.P. Morgan Asset Management – Index Definitions
All indexes are unmanaged and an individual cannot invest directly in an index. Index returns do not                The MSCI ACWI (All Country World Index) Index is a free float-adjusted market capitalization weighted index
include fees or expenses.                                                                                           that is designed to measure the equity market performance of developed and emerging markets. As of June 2009
                                                                                                                    the MSCI ACWI consisted of 45 country indices comprising 23 developed and 22 emerging market country indices.
The S&P 500 Index is widely regarded as the best single gauge of the U.S. equities market. This world-renowned
index includes a representative sample of 500 leading companies in leading industries of the U.S. economy.
Although the S&P 500 Index focuses on the large-cap segment of the market, with approximately 75% coverage          The MSCI Small Cap IndicesSM target 40% of the eligible Small Cap universe within each industry group, within
of U.S. equities, it is also an ideal proxy for the total market. An investor cannot invest directly in an index.   each country. MSCI defines the Small Cap universe as all listed securities that have a market capitalization in the
                                                                                                                    range of USD200-1,500 million.
The S&P 400 Mid Cap Index is representative of 400 stocks in the mid-range sector of the domestic stock
market, representing all major industries.                                                                          The MSCI Value and Growth IndicesSM cover the full range of developed, emerging and All Country MSCI Equity
The Russell 3000 Index® measures the performance of the 3,000 largest U.S. companies based on total market          indexes. As of the close of May 30, 2003, MSCI implemented an enhanced methodology for the MSCI Global
capitalization.                                                                                                     Value and Growth Indices, adopting a two dimensional framework for style segmentation in which value and
                                                                                                                    growth securities are categorized using different attributes - three for value and five for growth including forward-
The Russell 1000 Index ® measures the performance of the 1,000 largest companies in the Russell 3000.               looking variables. The objective of the index design is to divide constituents of an underlying MSCI Standard
                                                                                                                    Country Index into a value index and a growth index, each targeting 50% of the free float adjusted market
The Russell 1000 Growth Index ® measures the performance of those Russell 1000 companies with higher                capitalization of the underlying country index. Country Value/Growth indices are then aggregated into regional
price-to-book ratios and higher forecasted growth values.                                                           Value/Growth indices. Prior to May 30, 2003, the indices used Price/Book Value (P/BV) ratios to divide the
The Russell 1000 Value Index ® measures the performance of those Russell 1000 companies with lower price-           standard MSCI country indices into value and growth indices. All securities were classified as either "value"
to-book ratios and lower forecasted growth values.                                                                  securities (low P/BV securities) or "growth" securities (high P/BV securities), relative to each MSCI country index.
The Russell Midcap Index ® measures the performance of the 800 smallest companies in the Russell 1000               The following MSCI Total Return IndicesSM are calculated with gross dividends:
Index.                                                                                                              This series approximates the maximum possible dividend reinvestment. The amount reinvested is the dividend
The Russell Midcap Growth Index ® measures the performance of those Russell Midcap companies with higher            distributed to individuals resident in the country of the company, but does not include tax credits.
price-to-book ratios and higher forecasted growth values. The stocks are also members of the Russell 1000
Growth index.                                                                                                       The MSCI Europe IndexSM is a free float-adjusted market capitalization index that is designed to measure
                                                                                                                    developed market equity performance in Europe. As of June 2007, the MSCI Europe Index consisted of the
The Russell Midcap Value Index ® measures the performance of those Russell Midcap companies with lower              following 16 developed market country indices: Austria, Belgium, Denmark, Finland, France, Germany, Greece,
price-to-book ratios and lower forecasted growth values. The stocks are also members of the Russell 1000 Value      Ireland, Italy, the Netherlands, Norway, Portugal, Spain, Sweden, Switzerland and the United Kingdom.
index.
The Russell 2000 Index ® measures the performance of the 2,000 smallest companies in the Russell 3000               The MSCI Pacific IndexSM is a free float-adjusted market capitalization index that is designed to measure equity
Index.                                                                                                              market performance in the Pacific region. As of June 2007, the MSCI Pacific Index consisted of the following 5
                                                                                                                    Developed Market countries: Australia, Hong Kong, Japan, New Zealand, and Singapore.
The Russell 2000 Growth Index ® measures the performance of those Russell 2000 companies with higher
price-to-book ratios and higher forecasted growth values.                                                           Credit Suisse/Tremont Hedge Fund Index is compiled by Credit Suisse Tremont Index, LLC. It is an asset-
The Russell 2000 Value Index ® measures the performance of those Russell 2000 companies with lower price-           weighted hedge fund index and includes only funds, as opposed to separate accounts. The Index uses the Credit
to-book ratios and lower forecasted growth values.                                                                  Suisse/Tremont database, which tracks over 4500 funds, and consists only of funds with a minimum of US$50
                                                                                                                    million under management, a 12-month track record, and audited financial statements. It is calculated and
                                                                                                                    rebalanced on a monthly basis, and shown net of all performance fees and expenses. It is the exclusive property of
The MSCI® EAFE (Europe, Australia, Far East) Net Index is recognized as the pre-eminent benchmark in the            Credit Suisse Tremont Index, LLC.
United States to measure international equity performance. It comprises 21 MSCI country indexes, representing
the developed markets outside of North America.
                                                                                                                    The NCREIF Property Index is a quarterly time series composite total rate of return measure of investment
                                                                                                                    performance of a very large pool of individual commercial real estate properties acquired in the private market for
The MSCI Emerging Markets IndexSM is a free float-adjusted market capitalization index that is designed to          investment purposes only. All properties in the NPI have been acquired, at least in part, on behalf of tax-exempt
measure equity market performance in the global emerging markets. As of June 2007, the MSCI Emerging                institutional investors - the great majority being pension funds. As such, all properties are held in a fiduciary
Markets Index consisted of the following 25 emerging market country indices: Argentina, Brazil, Chile, China,       environment.
Colombia, Czech Republic, Egypt, Hungary, India, Indonesia, Israel, Jordan, Korea, Malaysia, Mexico, Morocco,
Pakistan, Peru, Philippines, Poland, Russia, South Africa, Taiwan, Thailand, and Turkey.
                                                                                                                    The NAREIT EQUITY REIT Index is designed to provide the most comprehensive assessment of overall industry
                                                                                                                    performance, and includes all tax-qualified real estate investment trusts (REITs) that are listed on the NYSE, the
                                                                                                                    American Stock Exchange or the NASDAQ National Market List.


63
J.P. Morgan Asset Management – Index Definitions
All indexes are unmanaged and an individual cannot invest directly in an index. Index returns do not                         The Barclays Capital Taxable Municipal Bond Index is a rules-based, market-value weighted index engineered
include fees or expenses.                                                                                                    for the long-term taxable bond market. To be included in the index, bonds must be rated investment-grade
                                                                                                                             (Baa3/BBB- or higher) by at least two of the following ratings agencies if all three rate the bond: Moody's, S&P,
The Dow Jones-UBS Commodity Index is composed of futures contracts on physical commodities and                               Fitch. If only two of the three agencies rate the security, the lower rating is used to determine index eligibility. If
represents nineteen separate commodities traded on U.S. exchanges, with the exception of aluminum, nickel, and               only one of the three agencies rates a security, the rating must be investment-grade. They must have an
zinc.                                                                                                                        outstanding par value of at least $7 million and be issued as part of a transaction of at least $75 million. The bonds
                                                                                                                             must be fixed rate and must be at least one year from their maturity date. Remarketed issues (unless coverted to
The S&P GSCI Index is a composite index of commodity sector returns representing an unleveraged, long-only                   fixed rate), bonds with floating rates, and derivatives, are excluded from the benchmark.
investment in commodity futures that is broadly diversified across the spectrum of commodities. The returns are              Municipal Bond Index: To be included in the index, bonds must be rated investment-grade (Baa3/BBB- or higher)
calculated on a fully collateralized basis with full reinvestment. Individual components qualify for inclusion in the        by at least two of the following ratings agencies: Moody's, S&P, Fitch. If only two of the three agencies rate the
index on the basis of liquidity and are weighted by their respective world production quantities.                            security, the lower rating is used to determine index eligibility. If only one of the three agencies rates a security, the
                                                                                                                             rating must be investment-grade. They must have an outstanding par value of at least $7 million and be issued as
The Barclays Capital U.S. Aggregate Index represents securities that are SEC-registered, taxable, and dollar                 part of a transaction of at least $75 million. The bonds must be fixed rate, have a dated-date after December 31,
denominated. The index covers the U.S. investment grade fixed rate bond market, with index components for                    1990, and must be at least one year from their maturity date. Remarketed issues, taxable municipal bonds, bonds
government and corporate securities, mortgage pass-through securities, and asset-backed securities. These major              with floating rates, and derivatives are excluded from the benchmark.
sectors are subdivided into more specific indexes that are calculated and reported on a regular basis.
This U.S. Treasury Index is a component of the U.S. Government index.                                                        The Barclays Capital Emerging Markets Index includes USD-denominated debt from emerging markets in the
                                                                                                                             following regions: Americas, Europe, Middle East, Africa, and Asia. As with other fixed income benchmarks
West Texas Intermediate (WTI) is the underlying commodity for the New York Mercantile Exchange's oil futures                 provided by Barclays Capital, the index is rules-based, which allows for an unbiased view of the marketplace and
contracts.                                                                                                                   easy replicability.
                                                                                                                             The Barclays Capital MBS Index covers the mortgage-backed pass-through securities of Ginnie Mae, Fannie
The Barclays Capital High Yield Index covers the universe of fixed rate, non-investment grade debt. Pay-in-kind              Mae, and Freddie Mac. Aggregate components must have a weighted average maturity of at least one year, must
(PIK) bonds, Eurobonds, and debt issues from countries designated as emerging markets (e.g., Argentina, Brazil,              have $250 million par amount outstanding, and must be fixed rate mortgages.
Venezuela, etc.) are excluded, but Canadian and global bonds (SEC registered) of issuers in non-EMG countries
are included. Original issue zeroes, step-up coupon structures, and 144-As are also included.                                The Barclays Capital Corporate Bond Index is the Corporate component of the U.S. Credit index.
                                                                                                                             The Barclays Capital TIPS Index consists of Inflation-Protection securities issued by the U.S. Treasury.
The Barclays Capital 1-3 Month U.S. Treasury Bill Index includes all publicly issued zero-coupon U.S. Treasury
Bills that have a remaining maturity of less than 3 months and more than 1 month, are rated investment grade, and            The J.P. Morgan EMBI Global Index includes U.S. dollar denominated Brady bonds, Eurobonds, traded loans
have $250 million or more of outstanding face value. In addition, the securities must be denominated in U.S.                 and local market debt instruments issued by sovereign and quasi-sovereign entities.
dollars and must be fixed rate and non convertible.
                                                                                                                             The J.P. Morgan Domestic High Yield Index is designed to mirror the investable universe of the U.S. dollar
                                                                                                                             domestic high yield corporate debt market.
The Barclays Capital General Obligation Bond Index is a component of the Barclays Capital Municipal Bond
Index. To be included in the index, bonds must be general obligation bonds rated investment-grade (Baa3/BBB- or              The CS/Tremont Equity Market Neutral Index takes both long and short positions in stocks with the aim of
higher) by at least two of the following ratings agencies: Moody's, S&P, Fitch. If only two of the three agencies rate       minimizing exposure to the systematic risk of the market (i.e., a beta of zero).
the security, the lower rating is used to determine index eligibility. If only one of the three agencies rates a security,
the rating must be investment-grade. They must have an outstanding par value of at least $7 million and be issued            The CS/Tremont Multi-Strategy Index consists of funds that allocate capital based on perceived opportunities
as part of a transaction of at least $75 million. The bonds must be fixed rate, have a dated-date after December             among several hedge fund strategies. Strategies adopted in a multi-strategy fund may include, but are not limited
31, 1990, and must be at least one year from their maturity date. Remarketed issues, taxable municipal bonds,                to, convertible bond arbitrage, equity long/short, statistical arbitrage and merger arbitrage.
bonds with floating rates, and derivatives, are excluded from the benchmark.                                                 *Market Neutral returns for November 2008 are estimates by J.P. Morgan Funds Market Strategy, and are based
                                                                                                                             on a December 8, 2008 published estimate for November returns by CS/Tremont in which the Market Neutral
The Barclays Capital Revenue Bond Index is a component of the Barclays Capital Municipal Bond Index. To
be included in the index, bonds must be revenue bonds rated investment-grade (Baa3/BBB- or higher) by at least               returns were estimated to be +0.85% (with 69% of all CS/Tremont constituents having reported return data).
two of the following ratings agencies: Moody's, S&P, Fitch. If only two of the three agencies rate the security, the         Presumed to be excluded from the November return are three funds, which were later marked to $0 by
lower rating is used to determine index eligibility. If only one of the three agencies rates a security, the rating must     CS/Tremont in connection with the Bernard Madoff scandal. J.P. Morgan Funds believes this distortion is not an
be investment-grade. They must have an outstanding par value of at least $7 million and be issued as part of a               accurate representation of returns in the category. CS/Tremont later published a finalized November return of -
transaction of at least $75 million. The bonds must be fixed rate, have a dated-date after December 31, 1990, and            40.56% for the month, reflecting this mark-down. CS/Tremont assumes no responsibility for these estimates.
must be at least one year from their maturity date. Remarketed issues, taxable municipal bonds, bonds with
floating rates, and derivatives, are excluded from the benchmark.

The Barclays High Yield Municipal Index includes bonds rated Ba1 or lower or non-rated bonds using the middle
rating of Moody’s, S&P and Fitch.

64
J.P. Morgan Asset Management – Definitions, Risks & Disclosures
                                                                                                                      Derivatives may be riskier than other types of investments because they may be more sensitive to changes in
Past performance is no guarantee of comparable future results.                                                        economic or market conditions than other types of investments and could result in losses that significantly
                                                                                                                      exceed the original investment. The use of derivatives may not be successful, resulting in investment losses,
Diversification does not guarantee investment returns and does not eliminate the risk of loss.                        and the cost of such strategies may reduce investment returns.
Bonds are subject to interest rate risks. Bond prices generally fall when interest rates rise.                        Price to forward earnings is a measure of the price-to-earnings ratio (P/E) using forecasted earnings. Price to
The price of equity securities may rise, or fall because of changes in the broad market or changes in a company’s     book value compares a stock's market value to its book value. Price to cash flow is a measure of the
financial condition, sometimes rapidly or unpredictably. These price movements may result from factors affecting      market's expectations of a firm's future financial health. Price to dividends is the ratio of the price of a share
individual companies, sectors or industries, or the securities market as a whole, such as changes in economic or      on a stock exchange to the dividends per share paid in the previous year, used as a measure of a company's
political conditions. Equity securities are subject to “stock market risk” meaning that stock prices in general may   potential as an investment.
decline over short or extended periods of time.
                                                                                                                      There is no guarantee that the use of long and short positions will succeed in limiting an investor's exposure
Small-capitalization investing typically carries more risk than investing in well-established "blue-chip" companies   to domestic stock market movements, capitalization, sector swings or other risk factors. Investing using long
since smaller companies generally have a higher risk of failure. Historically, smaller companies' stock has           and short selling strategies may have higher portfolio turnover rates. Short selling involves certain risks,
experienced a greater degree of market volatility than the average stock.                                             including additional costs associated with covering short positions and a possibility of unlimited loss on certain
                                                                                                                      short sale positions.
Mid-capitalization investing typically carries more risk than investing in well-established "blue-chip" companies.
Historically, mid-cap companies' stock has experienced a greater degree of market volatility than the average         Opinions and estimates offered constitute our judgment and are subject to change without notice, as are
stock.                                                                                                                statements of financial market trends, which are based on current market conditions. We believe the
                                                                                                                      information provided here is reliable, but do not warrant its accuracy or completeness. This material is not
Real estate investments may be subject to a higher degree of market risk because of concentration in a specific       intended as an offer or solicitation for the purchase or sale of any financial instrument. The views and strategies
industry, sector or geographical sector. Real estate investments may be subject to risks including, but not limited   described may not be suitable for all investors. This material has been prepared for informational purposes
to, declines in the value of real estate, risks related to general and economic conditions, changes in the value of   only, and is not intended to provide, and should not be relied on for accounting, legal or tax advice. References
the underlying property owned by the trust and defaults by borrower.                                                  to future returns are not promises or even estimates of actual returns a client portfolio may achieve. Any
                                                                                                                      forecasts contained herein are for illustrative purposes only and are not to be relied upon as advice or
International investing involves a greater degree of risk and increased volatility. Changes in currency exchange      interpreted as a recommendation.
rates and differences in accounting and taxation policies outside the U.S. can raise or lower returns. Also, some
overseas markets may not be as politically and economically stable as the United States and other nations.            The views expressed are those of J.P. Morgan Asset Management. They are subject to change at any time.
Investments in emerging markets can be more volatile. As mentioned above, the normal risks of investing in            These views do not necessarily reflect the opinions of any other firm.
foreign countries are heightened when investing in emerging markets. In addition, the small size of securities
markets and the low trading volume may lead to a lack of liquidity, which leads to increased volatility. Also,        Contact JPMorgan Distribution Services, Inc. at 1-800-480-4111 for a fund prospectus. You
emerging markets may not provide adequate legal protection for private or foreign investment or private property.     can also visit us at www.jpmorganfunds.com. Investors should carefully consider the
                                                                                                                      investment objectives and risks as well as charges and expenses of the mutual fund before
Investments in commodities may have greater volatility than investments in traditional securities, particularly if    investing. The prospectus contains this and other information about the mutual fund. Read
the instruments involve leverage. The value of commodity-linked derivative instruments may be affected by
changes in overall market movements, commodity index volatility, changes in interest rates, or factors affecting a    the prospectus carefully before investing.
particular industry or commodity, such as drought, floods, weather, livestock disease, embargoes, tariffs and         J.P. Morgan Asset Management is the marketing name for the asset management businesses of JPMorgan
international economic, political and regulatory developments. Use of leveraged commodity-linked derivatives          Chase & Co. Those businesses include, but are not limited to, J.P. Morgan Investment Management Inc.,
creates an opportunity for increased return but, at the same time, creates the possibility for greater loss.          Security Capital Research & Management Incorporated and J.P. Morgan Alternative Asset Management, Inc.
                                                                                                                      JPMorgan Distribution Services, Inc., member FINRA/SIPC.
   Can’t find a slide?
                                                                                                                      © JPMorgan Chase & Co., April 2012.
   Please visit www.jpmorganfunds.com/bench
                                                                                                                      Unless otherwise stated, all data are as of March 31, 2012 or most recently available.
   to access slides from previous editions that are
   now “on the bench”.                                                                                                Prepared by:
                                                                                                                      Andrew D. Goldberg, Joseph S. Tanious, Andrés Garcia-Amaya, David M. Lebovitz, Brandon D. Odenath and
                                                                                                                      David Kelly.

  NOT FDIC INSURED ı NO BANK GUARANTEE ı MAY LOSE VALUE                                                                JP-LITTLEBOOK


65

JPMorganGuide2Q2012

  • 1.
    2Q | 2012 As of March 31, 2012 Guide to the Markets
  • 2.
    Table of Contents EQUITIES 4 ECONOMY 16 FIXED INCOME 32 INTERNATIONAL 40 ASSET CLASS 51 U.S. Market Strategy Team Dr. David P. Kelly, CFA david.p.kelly@jpmorgan.com Andrew D. Goldberg andrew.d.goldberg@jpmorgan.com Joseph S. Tanious, CFA joseph.s.tanious@jpmorgan.com Andrés Garcia- Andr és Garcia-Amaya andres.d.garcia@jpmorgan.com Brandon D. Odenath brandon.d.odenath@jpmorgan.com David M. Lebovitz david.m.lebovitz@jpmorgan.com www.jpmorganfunds.com/mi Past performance is no guarantee of comparable future results. 2
  • 3.
    Page Reference Equities Fixed Income 4. Returns by Style 32. Fixed Income Sector Returns 5. Returns by Sector 33. Interest Rates and Inflation 6. U.S. Equity Indexes 34. Fixed Income Yields and Returns 7. S&P 500 Index at Inflection Points 35. The Fed and the Money Supply 8. Equity Scenarios: Bull, Bear and In-between 36. Credit Conditions 9. Investment Style Valuations 37. High Yield Bonds 10. Stock Valuation Measures: S&P 500 Index 38. Municipal Finance 11. Earnings Estimates and Multiples 39. Emerging Market Debt 12. Earnings Drivers and Shareholder Distributions 13. Broad Market Lagged Price to Earnings Ratio International 14. P/E Ratios and Equity Returns 40. Global Equity Markets: Returns and Composition 15. Equity Correlations and Volatility 41. Global Economic Growth 42. Global Monetary Policy Economy 43. The Importance of Exports 16. Economic Growth and the Composition of GDP 44. The Impact of Global Consumers 17. Cyclical Sectors 45. European Crisis: Fiscal Challenges 18. Consumer Finances 46. European Crisis: Financial System Risks 19. Federal Finances 47. Chinese Growth and Economic Policy 20. Federal Revenues, Outlays and Tax Rates 48. Global Equity Valuations – Developed and Emerging Markets 21. Political Perception and Economic Reality 49. International Economic and Demographic Data 22. The Aftermath of the Housing Bubble 50. Current Account Deficit and U.S. Dollar 23. Employment 24. Employment by Sector and Education Asset Class 25. Corporate Profits 51. Asset Class Returns 26. Consumer Price Index 52. Correlations: 10-Years 27. Returns in Different Inflation Environments – 40 years 53. Mutual Fund Flows 28. Oil and the Economy 54. Dividend Income: Domestic and Global 29. Global Oil Supply 55. Global Commodities 30. Consumer Confidence and the Stock Market 56. Gold 31. Confidence and the Capital Markets 57. Historical Returns by Holding Period 58. Diversification and the Average Investor 59. Annual Returns and Intra-year Declines 60. Alternative Investment Returns 61. Cash Accounts 62. Corporate DB Plans and Endowments 3
  • 4.
    Returns by Style Charts reflect index levels (price change only). All returns and annotations reflect total return, including dividends. 1Q 2012 2011 S&P 500 Index Value Blend Growth Value Blend Growth 1,450 Equities Large Large 1,400 11.1% 12.6% 14.7% 0.4% 2.1% 2.6% 1,350 1,300 1Q12: +12.6% Mid Mid 1,250 2011: +2.1% 11.4% 12.9% 14.5% -1.4% -1.5% -1.7% 1,200 1,150 Small Small 1,100 11.6% 12.4% 13.3% -5.5% -4.2% -2.9% Dec-10 Apr-11 Jul-11 Sep-11 Dec-11 Mar-12 Since Market Peak (October 2007) Since Market Low (March 2009) S&P 500 Index Since 10/9/07 Peak: Value Blend Growth Value Blend Growth 1,600 -0.7% Large Large 1,400 -10.6% -0.7% 12.1% 122.9% 122.0% 128.7% 1,200 Mid Mid 1,000 3.4% 7.3% 10.4% 164.0% 159.0% 155.2% Since 3/9/09 Low: +122.0% 800 Small Small -0.1% 4.6% 8.9% 146.9% 152.1% 156.9% 600 Dec-06 Jan-08 Feb-09 Feb-10 Mar-11 Mar-12 Source: Russell Investment Group, Standard & Poor’s, FactSet, J.P. Morgan Asset Management. All calculations are cumulative total return, including dividends reinvested for the stated period. Since Market Peak represents period 10/9/07 – 12/31/11, illustrating market returns since the most recent S&P 500 Index high on 10/9/07. Since Market Low represents period 3/9/09 – 12/31/11, illustrating market returns since the S&P 500 Index low on 3/9/09. Returns are cumulative returns, not annualized. For all time periods, total return is based on Russell-style indexes with the exception of the large blend category, which is reflected by the S&P 500 Index. Past performance is not indicative of future returns. Data are as of 3/31/12. 4
  • 5.
    Returns by Sector x es de r. y e l ap sc In ls og ar ls ls ria ia Di m C St 0 ol es ia 50 gy nc co th st n s. s. er iti ch er du al na P le n n at il S& En Co Co He Te Te Ut In Fi M Equities S&P Weight 14.9% 20.5% 11.4% 10.6% 11.2% 10.9% 10.8% 2.8% 3.4% 3.5% 100.0% Weight Russell Growth Weight 4.3% 30.4% 10.5% 12.5% 10.0% 14.4% 11.9% 0.8% 0.1% 5.2% 100.0% Russell Value Weight 26.8% 9.1% 12.3% 9.2% 11.6% 9.3% 7.7% 4.4% 6.9% 2.6% 100.0% 1Q 2012 22.0 21.5 9.1 11.3 3.9 16.0 5.5 2.1 -1.6 11.2 12.6 2011 -17.1 2.4 12.7 -0.6 4.7 6.1 14.0 6.3 20.0 -9.8 2.1 Return Since Market Peak -51.3 22.5 14.1 -4.8 0.7 28.7 38.3 -8.0 2.4 -3.9 -0.7 (October 2007) Since Market Low 166.0 156.6 84.0 161.6 84.3 197.8 93.9 75.8 79.2 129.0 122.0 (March 2009) Beta to S&P 500 1.35 1.27 0.65 1.15 0.91 1.11 0.53 0.92 0.58 1.25 1.00 β Forward P/E Ratio 11.4x 13.4x 12.4x 13.2x 10.6x 15.4x 15.2x 16.8x 14.3x 12.8x 13.0x 15-yr avg. 12.9x 24.0x 18.9x 17.1x 14.9x 18.6x 18.8x 17.4x 13.5x 16.1x 16.9x P/E Trailing P/E Ratio 14.5x 15.9x 17.0x 15.7x 11.1x 15.3x 17.8x 44.7x 14.7x 15.2x 15.4x 20-yr avg. 16.0x 27.0x 24.3x 20.4x 18.3x 19.8x 21.1x 18.7x 14.3x 19.8x 19.7x Dividend Yield 1.8% 1.0% 2.3% 2.4% 1.9% 1.6% 3.0% 5.5% 4.3% 2.1% 2.1% Div 20-yr avg. 2.2% 0.6% 1.4% 1.8% 1.9% 1.0% 2.1% 3.8% 4.5% 2.1% 1.7% Source: Standard & Poor’s, Russell Investment Group, FactSet, J.P. Morgan Asset Management. All calculations are cumulative total return, not annualized, including dividends for the stated period. Since Market Peak represents period 10/9/07 – 3/31/12. Since Market Low represents period 3/9/09 – 3/31/12. Forward P/E Ratio is a bottom-up calculation based on the most recent S&P 500 Index price, divided by consensus estimates for earnings in the next twelve months (NTM), and is provided by FactSet Market Aggregates. Trailing P/E ratios are bottom-up values defined as month-end price divided by the last twelve months of available reported earnings. Historical data can change as new information becomes available. Note that P/E ratios for the S&P 500 may differ from estimates elsewhere in this book due to the use of a bottom-up calculation of constituent earnings (as described) rather than a top-down calculation. This methodology is used to allow proper comparison of sector level data to broad index level data. Dividend yields are bottom-up values defined as the annualized value of the most recent cash dividend as a percent of month-end price. Beta calculations are based on 10 years of monthly price returns for the S&P 500 and its sub-indices. Past performance is not indicative of future returns. Data are as of 3/31/12. 5
  • 6.
    U.S. Equity Indexes Russell Indexes Growth (585) S&P Indexes Dow Jones Russell Industrials (30) Top 200 S&P 500 Industrials Russell Russell Russell 1000 1000 1000 Russell Equities S&P S&P Mid Mid Cap (800) Cap 400 1500 Russell Russell Value (654) 3000 S&P Small 2000 Cap 600 Mark et Cap W eight Size (Lipper*) Valuation Index W td Av g T otal T op 10 Bottom 100 Large Mid Small Div Yld Fwd P/ E S&P 500 111.6 bn 12,730 bn 20.5% 3.0% 91.3% 8.2% 0.4% 2.1% 13.0x Russell 1000 99.6 14,452 18.3 0.8 82.3 14.2 3.5 2.0 13.5 Large Dow Jones 147.3 3,984 57.0 43.0 100.0 0.0 0.0 2.4 12.6 Russell 1000 Value 79.0 7,112 24.3 0.7 81.6 14.2 4.3 2.5 12.2 Russell 1000 Growth 119.5 7,340 29.2 0.9 83.0 14.2 2.8 1.5 15.1 S&P Mid Cap 400 4.0 1,189 6.6 10.7 1.5 56.5 42.0 1.4 15.6 Mid Russell Mid Cap 8.8 4,201 4.5 2.7 39.4 48.6 12.0 1.7 15.1 All Sm Russell 2000 1.4 1,220 2.5 0.4 0.0 1.2 98.8 1.4 19.0 Russell 3000 91.9 15,672 16.8 0.0 75.9 13.2 10.9 2.0 13.8 Market Cap is a bottom-up weighted average based on share information from Compustat and price information from FactSet's pricing database as provided by Standard & Poor's and Russell Investment Group, respectively. Dividend Yield is calculated based on the trailing 12 months of dividends and is provided by FactSet’s pricing database for S&P and Dow Indexes and Russell for the Russell Indexes. Forward P/E is a bottom-up calculation based on the most recent S&P 500 price, divided by consensus estimates for earnings in the next twelve months (NTM), and is provided by FactSet Market Aggregates. Top 10 represents summed benchmark weight of ten largest stocks in respective index. Bottom 100 represents summed benchmark weight of 100 smallest stocks in respective index. *Lipper mutual fund size parameters are used for illustrative purposes only and are hypothetical distributions based on Lipper mutual fund categories. As of November 2011, Lipper defines large as market cap over $11.7 billion, small as less than $4.1 billion and mid as all values in between. The number of holdings as of 3/31/12 are – Russell 1000: 977; Russell Mid Cap: 779; Russell 2000: 1,941; Russell 3000: 2,918. 6 Data are as of 3/31/12.
  • 7.
    S&P 500 Indexat Inflection Points S&P 500 Index Characteristic Mar-2000 Oct-2007 Mar-2012 Oct. 9, 2007 Mar. 24, 2000 Index level 1,527 1,565 1,408 P/E (fwd) = 15.2x 1,600 P/E (fwd) = 25.6x P/E ratio (fwd) 25.6x 15.2x 13.0x 1,565 1,527 Dividend yield 1.1% 1.8% 2.1% Equities 10-yr. Treasury 6.2% 4.7% 2.2% Mar. 31, 2012 P/E (fwd) = 13.0x 1,408 1,400 +101% 1,200 +106% -57% -49% 1,000 +108% 800 Dec. 31, 1996 Oct. 9, 2002 P/E (fwd) = 16.0x Mar. 9, 2009 P/E (fwd) = 14.1x 741 P/E (fwd) = 10.3x 777 677 600 '97 '98 '99 '00 '01 '02 '03 '04 '05 '06 '07 '08 '09 '10 '11 '12 Source: Standard & Poor’s, First Call, Compustat, FactSet, J.P. Morgan Asset Management. Dividend yield is calculated as the annualized dividend rate divided by price, as provided by Compustat. Forward Price to Earnings Ratio is a bottom-up calculation based on the most recent S&P 500 Index price, divided by consensus estimates for earnings in the next twelve months (NTM), and is provided by FactSet Market Aggregates. Returns are cumulative and based on S&P 500 Index price movement only, and do not include the reinvestment of dividends. Past performance is not indicative of future results. Data are as of 3/31/12. 7
  • 8.
    Equity Scenarios: Bull,Bear and In-between S&P 500 Index: Return Needed to Reach 2007 Peak Bear Market Cycles vs. Subsequent Bull Runs Analysis as of Mar. 31, 2012. Index has risen 108.0% since low of 677. Bear Yrs to Market Market Length of Length Market Bull Run Reach Old Peak Low Decline of Run 1 Yrs 13.1% 13.1% Return Peak Equities 5/29/46 5/19/47 -28.6% 12 257.6% 122 3.1 yrs 2 Yrs 7.4% 15.4% 7/15/57 10/22/57 -20.7% 3 86.4% 50 0.9 yrs 3 Yrs 5.6% 17.7% 12/12/61 6/26/62 -28.0% 6 79.8% 44 1.2 yrs 4 Yrs 4.7% 20.0% 10/9/07 Peak 1,565 2/9/66 10/7/66 -22.2% 8 48.0% 26 0.6 yrs 3/9/09 Trough 677 5 Yrs 4.1% 22.4% 3/31/12 Level 1,408 11/29/68 5/26/70 -36.1% 18 74.2% 31 1.8 yrs Decline Peak to Trough 888 6 Yrs 3.8% 24.9% 1/5/73 10/3/74 -48.4% 21 125.6% 74 5.8 yrs Recovery So Far 731 Distance Left to Peak 157 11/28/80 8/12/82 -27.1% 20 228.8% 60 0.2 yrs 7 Yrs 3.5% 27.4% 8/25/87 12/4/87 -33.5% 3 582.1% 148 1.6 yrs 8 Yrs 3.3% 29.9% X% Implied avg. annualized total return 3/24/00 10/9/02 -49.1% 31 101.5% 60 4.6 yrs 9 Yrs 3.2% 32.5% X% Implied cumulative total return 10/9/07 3/9/09 -56.8% 17 108.0% 37* 10 Yrs 3.1% 35.2% Average: -35.0% 14 mo's 176.0% 68 mo's 2.2 yrs Source: Standard & Poor’s, FactSet, J.P. Morgan Asset Management. (Left) Data assume 2.0% annualized dividend yield. Implied values reflect the average geometric total returns required for the S&P 500 to reach its 10/9/07 peak of 1,565 over each stated time period. Chart is for illustrative purposes only. Past performance does not guarantee future results. (Right) A bear market is defined as a peak-to-trough decline in the S&P 500 Index (price only) of 20% or more. The bull run data reflect the market expansion from the bear market low to the subsequent market peak. All returns are S&P 500 Index returns and do not include dividends. *Current 8 bull run from 3/9/09 through 3/31/12. Data are as of 3/31/12.
  • 9.
    Investment Style Valuations Russell 1000 Growth P/E divided by Russell 1000 Value P/E Current P/E vs. 20-year avg. P/E 3.5x Value Blend Growth 11.9 13.2 14.7 Large 3.0x Most recent: Equities R1000 Growth 14.7 14.0 16.7 21.0 2.5x R1000 Value 11.9 Growth / Value 1.2x* 13.4 15.0 16.9 Mid 2.0x 14.0 16.3 21.9 13.7 15.4 17.2 Small 1.5x 20-yr. average: 1.5x 14.2 17.1 21.3 1.0x '94 '96 '98 '00 '02 '04 '06 '08 '10 '12 Current P/E as % of 20-year avg. P/E Russell 2000 P/E divided by Russell 1000 P/E E.g.: Large Cap Blend stocks are 21.1% 1.3x cheaper than their historical average. Value Blend Growth 1.2x 20-yr. average: 1.0x Large 1.1x 85.1% 78.9% 69.9% 1.0x Most recent: Mid 95.3% 91.7% 77.3% 0.9x R2000 15.4 R1000 13.2 0.8x Small Small / Large 1.2x* 96.4% 89.9% 80.8% 0.7x '94 '96 '98 '00 '02 '04 '06 '08 '10 '12 Source: Russell Investment Group, IBES, FactSet, J.P. Morgan Asset Management. P/E ratios are calculated and provided by Russell based on IBES consensus estimates of earnings over the next twelve months. *Represents the Russell 1000 Growth Index P/E ratio divided by the Russell 1000 Value Index P/E ratio (top) and Russell 2000 Index P/E ratio divided by the Russell 1000 Index P/E ratio (bottom). Data reflect P/Es as provided by Russell based on IBES estimates of next twelve months’ earnings. Data are as of 3/31/12. 9
  • 10.
    Stock Valuation Measures:S&P 500 Index S&P 500 Index: Valuation Measures Historical Averages Valuation 1-year 3-year 5-year 10-year 15-year Latest Measure Description ago avg. avg. avg. avg. P/E Price to Earnings 13.0x 13.2x 13.0x 13.1x 14.5x 16.9x Equities P/B Price to Book 2.3 2.3 2.1 2.3 2.5 3.1 P/CF Price to Cash Flow 8.9 8.8 8.4 8.7 9.9 11.1 P/S Price to Sales 1.3 1.3 1.1 1.2 1.3 1.5 PEG Price/Earnings to Growth 1.6 0.9 1.0 1.2 1.2 1.2 Div. Yield Dividend Yield 2.1% 2.0% 2.2% 2.2% 2.0% 1.9% Q-Ratio: Stock Price Relative to Company Assets S&P 500 Earnings Yield vs. Baa Bond Yield Price to net asset value, all U.S. non-financial corporations Less Attractive 10% 200% S&P 500 Earnings Yield: 9% (Inverse of fwd. P/E) 7.7% 8% 150% 7% 1Q12*: 96.0% 100% More Attractive 6% 40-yr. avg. = 75.3% 5% 50% Moody’s Baa Yield: 5.2% 4% 0% 3% 1970 1975 1980 1985 1990 1995 2000 2005 2010 '94 '96 '98 '00 '02 '04 '06 '08 '10 '12 Source: (Top) Standard & Poor’s, FactSet, J.P. Morgan Asset Management. Price to Earnings is price divided by consensus analyst estimates of earnings per share for the next twelve months. Price to Book is price divided by book value per share. Data post-1992 include intangibles and are provided by Standard & Poor’s. Price to Cash Flow is price divided by consensus analyst estimates of cash flow per share for the next twelve months. Price to Sales is calculated as price divided by consensus analyst estimates of sales per share for the next twelve months. PEG Ratio is calculated as NTM P/E divided by NTM earnings growth. Dividend Yield is calculated as consensus analyst estimates of dividends for the next twelve months divided by price. All consensus analyst estimates are provided by FactSet. (Bottom left) Q-Ratio based on data from the Federal Reserve, table B.102. *1Q12 is an estimate provided by J.P. Morgan Asset Management as of 3/31/12. (Bottom right) Standard & Poor’s, Moody’s, FactSet, J.P. Morgan Asset Management. Data are as of 3/31/12. 10
  • 11.
    Earnings Estimates andMultiples S&P 500 Index: Forward P/E Ratio S&P 500 Operating Earnings Estimates 28x Consensus estimates of the next twelve months’ rolling earnings $120 1Q12: $108.51 24x Equities $100 20x $80 Average: 16.2x $60 16x $40 12x $20 Mar. 2012: 13.0x 8x $0 '94 '96 '98 '00 '02 '04 '06 '08 '10 '12 '02 '03 '04 '05 '06 '07 '08 '09 '10 '11 Forward P/E Ratios by Sector Averages and ranges based on monthly data from April 2002 to March 2012 Example 35x 30x 25x 10-yr. Average 20x range Current 15x 10x 5x Con. Disc Con. Energy Financials Health Industrials Tech Materials Telecom Utilties Staples Care Source: (Top left) Standard & Poor’s, Compustat, FactSet, J.P. Morgan Asset Management. (Top right) Standard & Poor’s, Compustat, FactSet, J.P. Morgan Asset Management. Earnings estimates are for calendar years and taken at quarter end dates throughout the year. (Bottom) Standard & Poor’s, FactSet, J.P. Morgan Asset Management. Forward Price to Earnings is price divided by consensus analyst estimates of earnings per share for the next twelve months. 11 Data are as of 3/31/12.
  • 12.
    Earnings Drivers andShareholder Distributions Year-Over-Year EPS Growth Nominal GDP and S&P 500 Sales Growth S&P 500, quarterly, broken into revenue growth and margin expansion Year-over-year growth, 2000 – 2011 60% 20% 84.9% 15% Sales per share Equities 10% 50% 5% Margin Share of EPS Growth Nominal GDP 0% Revenue Share of EPS Growth -5% -10% 40% -15% Correlation Coefficient: 0.82 -20% '00 '02 '04 '06 '08 '10 30% 44.0% Cash Returned to Shareholders Rolling 4-quarter averages, S&P 500, billions USD $30 $160 Dividends per share 29.8% $140 20% $27 20.0% $120 7.3% $24 6.5% $100 8.1% 10% $21 $80 0.2% $60 11.6% 10.8% 7.8% 8.3% 7.9% $18 6.8% 7.3% 6.8% $40 Share buybacks 0% $15 $20 1Q10 2Q10 3Q10 4Q10 1Q11 2Q11 3Q11 4Q11 '00 '01 '02 '03 '04 '05 '06 '07 '08 '09 '10 '11 '12 Source: Standard & Poor’s, Compustat, BEA, FactSet, J.P. Morgan Asset Management. Data are as of 3/31/12. 12
  • 13.
    Broad Market LaggedPrice to Earnings Ratio Lagged P/E Ratio – All U.S. Corporations Ratio of Market Value of All U.S. Corporations to Adjusted After-Tax Corporate Profits for Prior Four Quarters 35x Equities 30x P/E Ratios Avg. During Recessions 12.6x 25x Avg. During Expansions 13.9x March 31, 2012 12.5x 20x 15x Average: 13.7x 10x Mar. 31, 2012: 12.5x 5x 0x '52 '55 '58 '61 '64 '67 '70 '73 '76 '79 '82 '85 '88 '91 '94 '97 '00 '03 '06 '09 '12 Source: BEA, Federal Reserve Board, Wilshire Associates, J.P. Morgan Asset Management. Data are as of 3/31/12. 13
  • 14.
    P/E Ratios andEquity Returns P/E and Total Return Over 1-yr. Periods P/E and Total Return Over 10-yr. Annualized Periods Quarterly, 1Q 1952 to 1Q 2011 Quarterly, 1Q 1952 to 1Q 2002 60% 60% Current P/E: 12.5 Current P/E: 12.5 Equities 40% 40% 20% 20% 0% 0% 5x 10x 15x 20x 25x 30x 5x 10x 15x 20x 25x 30x -20% -20% -40% -40% Source: BEA, FRB, J.P. Morgan Asset Management. Prices are based on the market value of all US corporations and include quarterly dividends. Valuation based on long-term PE ratio. Note: Orange line denote results of linear regression with R-squared of 0.15 for 1-yr. returns (LHS) and 0.50 for 10-yr. returns (RHS). Data are as of 3/31/12. 14
  • 15.
    Equity Correlations andVolatility Large Cap Stocks Sovereign Debt Correlations Among Stocks Crisis 70% Great Depression / Lehman 60% World War II Bankruptcy 1987 Crash Equities 50% Cuban Missile Crisis OPEC Oil 40% Crisis Tech Bust & 9/11 30% 20% 10% Average: 26.7% Mar. 2012: 33.2% 0% '26 '32 '38 '44 '50 '56 '62 '68 '74 '80 '86 '92 '98 '04 '10 Daily Volatility of DJIA Volatility Level ’08 Peak Latest 3.5% DJIA 3.30% 0.40% Chart shown 3.0% in 3-month moving average 2.5% 2.0% 1.5% 1.0% Average: 0.72% 0.5% 0.0% '26 '32 '38 '44 '50 '56 '62 '69 '75 '81 '87 '93 '99 '06 '12 Source: (Top) Empirical Research Partners LLC, Standard & Poor’s, J.P. Morgan Asset Management. Capitalization weighted correlation of top 750 stocks by market capitalization, daily returns, 1926 – Mar. 29, 2011. (Bottom) Dow Jones, J.P. Morgan Asset Management. Data are represented as three-month moving averages of the daily absolute percentage change in the Dow Jones Industrial Average. 15 Charts shown for illustrative purposes only. Data are as of 3/31/12.
  • 16.
    Economic Growth andthe Composition of GDP Real GDP Components of GDP % chg at annual rate 4Q11 nominal GDP, billions, USD 10% 20-yr avg. 4Q11 2.3% Housing $16,000 Real GDP: 2.6% 3.0% 8% 10.8% Investment ex-housing $14,000 6% 19.7% $685 bn of $12,000 Gov’t Spending Economy 4% output lost $10,000 2% $8,000 0% -2% $6,000 71.0% $788 bn of output Consumption -4% recovered $4,000 -6% $2,000 -8% $0 -10% - 3.8% Net Exports '02 '04 '06 '08 '10 -$2,000 Source: BEA, FactSet, J.P. Morgan Asset Management. GDP values shown in legend are % change vs. prior quarter annualized and reflect revised 4Q11 GDP. Data reflect most recently available as of 3/31/12. 16
  • 17.
    Cyclical Sectors Light Vehicle Sales Manufacturing and Trade Inventories Millions, seasonally adjusted annual rate Days of sales, seasonally adjusted 24 47 46 Jan. 2012: 38.6 22 45 20 44 18 43 Feb. 2012: 16 15.0 42 Average: 15.1 41 Economy 14 40 12 39 10 38 8 37 '94 '96 '98 '00 '02 '04 '06 '08 '10 '12 '94 '96 '98 '00 '02 '04 '06 '08 '10 '12 Housing Starts Real Capital Goods Orders Thousands, seasonally adjusted annual rate Non-defense capital goods orders ex. aircraft, $ bn, seasonally adjusted 2,400 75 70 2,000 Feb. 2012: 59.6 65 1,600 60 Average: 57.7 1,200 Average: 1,446 55 800 50 400 45 Feb. 2012: 698 0 40 '75 '80 '85 '90 '95 '00 '05 '10 '98 '00 '02 '04 '06 '08 '10 '12 Source: (Top left) BEA, FactSet, J.P. Morgan Asset Management. (Top right) Census Bureau, FactSet, J.P. Morgan Asset Management. (Bottom left) Census Bureau, FactSet, J.P. Morgan Asset Management. (Bottom right) Census Bureau, FactSet, J.P. Morgan Asset Management. Capital goods orders deflated using the producer price index for capital goods. Data reflect most recently available as of 3/31/12. 17
  • 18.
    Consumer Finances Consumer Balance Sheet Personal Savings Rate Trillions of dollars outstanding, not seasonally adjusted Annual, % of disposable income 12% $80 10% 2Q-’07 Peak: $80.7tn Total Assets: $72.2 tn YTD 2012: 1Q-’09 Low: $64.5tn 8% $70 4.0% 6% Homes: 25% Economy $60 4% 2% Other tangible: 7% $50 0% '60 '65 '70 '75 '80 '85 '90 '95 '00 '05 '10 Deposits: 11% Household Debt Service Ratio $40 Debt payments as % of disposable personal income, seasonally adjusted 15% Pension funds: 18% 3Q07: $30 14.0% Revolving (e.g.: credit cards): 6% 14% Non-revolving: 12% Other Liabilities: 10% 13% $20 Other financial Total Liabilities: $13.8 tn 12% 1Q80: assets: 38% 11.2% $10 11% 1Q12*: Mortgages: 71% 10.8% 10% $0 '80 '82 '84 '86 '88 '90 '92 '94 '96 '98 '00 '02 '04 '06 '08 '10 '12 Source: (Left) FRB, J.P. Morgan Asset Management. Data includes households and nonprofit organizations. (Right) BEA, FRB, J.P. Morgan Asset Management. Personal savings rate is calculated as personal savings (after-tax income – personal outlays) divided by after-tax income. Employer and employee contributions to retirement funds are included in after-tax income but not in personal outlays, and thus are implicitly included in personal savings. Savings rate data as of February 2012. *1Q12 Household Debt Service Ratio is J.P. Morgan Asset Management estimate. All other data are as of 4Q11. Data reflect most recently available as of 3/31/12. 18
  • 19.
    Federal Finances The 2012 Federal Budget Federal Budget Surplus/Deficit CBO Baseline forecast, trillions USD % of GDP, 1990 – 2022* Forecast $4.0 4% 2011 actual: -8.7% 2% Total Spending: $3.6tn 0% $3.5 Other -2% $504bn (14%) -4% Borrowing: $3.0 Net Int.: $224bn (6%) $1,171bn (32%) -6% Economy CBO Baseline Alt. Scenario Non-defense -8% 2012 -7.6% -7.7% Discretionary: Baseline $2.5 -10% 2013 -3.8% -6.3% $630bn (17%) Alternative -12% 1990 1994 1998 2002 2006 2010 2014 2018 2022 $2.0 Defense: Federal Debt (Accumulated Deficits) $673bn (19%) Net debt % of GDP, 1990 – 2022* Forecast 100% $1.5 Revenues: 80% 2022*: 93.2% Social Security: 2011 actual: 67.7% $2,456bn (68%) $769bn (21%) $1.0 60% 2022: 61.3% 40% $0.5 Medicare & Medicaid: CBO Baseline Alt. Scenario $827bn (23%) 20% Baseline 2012 73.2% 73.3% Alternative 2013 75.8% 78.4% $0.0 0% Total Government Spending Sources of Financing 1990 1994 1998 2002 2006 2010 2014 2018 2022 Source: U.S. Treasury, BEA, CBO, J.P. Morgan Asset Management. 2011 numbers are actuals. 2012 Federal Budget is based on the CBO’s March 2012 Baseline Scenario. *The CBO’s Alternative Scenario as shown in the deficit and debt charts assumes that expiring tax provisions (other than the payroll tax cut) are extended, the AMT is indexed for inflation after 2011, Medicare’s payment rates for physicians’ services are held constant at their current level and the automatic spending cuts required by the Budget Control Act, which are set to take effect in January 2013, do not occur (but discretionary appropriation caps stay in place). Note: Years shown are fiscal years (Oct. 1 through Sep. 30). Top right chart displays federal surplus/deficit (revenues – outlays). 19 Data reflect most recently available as of 3/31/12.
  • 20.
    Federal Revenues, Outlaysand Tax Rates Federal Revenues Federal Outlays 1960 – 2012, % of GDP 1960 – 2012, % of GDP 26% 26% 2012*: 23.4% 22% 22% Average: 20.5% Economy 18% 18% Average: 17.9% 2012*: 15.7% 14% 14% 1960 1970 1980 1990 2000 2010 1960 1970 1980 1990 2000 2010 Average Maximum Tax Rate on Dividends and Capital Gains Tax Rate 40-yr. avg. Current 100% Dividends 44.6% 15.0% Capital Gains 24.7% 15.0% 80% Ordinary Income 47.9% 35.0% 60% 40% 20% 0% 1930's 1940's 1950's 1960's 1970's 1980's 1990's 2000's Current Source: (Top Charts) CBO, White House, J.P. Morgan Asset Management. (Bottom) The Tax Foundation, J.P. Morgan Asset Management. Tax rates based on maximum U.S. individual income tax. *2012 revenues and outlays are estimates based on the CBO’s Alternative Scenario, which was re-estimated on March 13, 2012. This scenario assumes that all expiring tax provisions (excluding the payroll tax cut) are extended, the AMT is indexed for inflation after 2011, Medicare payments are held constant at current levels and the automatic enforcement procedures specified by the Budget Control Act of 2011 do not take effect. 20 Data are as of 3/31/12.
  • 21.
    Political Perception andEconomic Reality Presidential and Congressional Approval Ratings S&P 500 Return by Political Control 88% 1940 to 2011 78% 16% Presidential Approval 15.3% 68% 12% 58% 48% 8% 7.7% 38% Economy 4% 5.0% 28% 3.3% 18% 0% Congressional Approval Dem. President Rep. President 8% 1974 1987 1995 1997 2000 2002 2003 2005 2006 2008 2010 2011 Dem. Congress Split Congress Rep. Congress Split Congress Political Polarization Real GDP Growth by Political Control % of Representatives voting with the majority of their party* 1940 to 2011 100% 7% Senate 6% 6.3% 95% House 5% 90% 4% 85% 3% 3.1% 2% 2.7% 80% 1% 1.4% 75% 0% Dem. President Rep. President 70% 1901 1921 1941 1961 1981 2001 Dem. Congress Split Congress Rep. Congress Split Congress Source: (Top) Gallup Inc., J.P. Morgan Asset Management. (Bottom left) Gallup Inc., J.P. Morgan Asset Management. (Bottom right) Keith T. Poole, J.P. Morgan Asset Management. *In roll call votes where the majority in one party voted the opposite way to the majority in the other. Data compiled by Professors Keith T. Poole and Howard Rosenthal available at www.voteview.com. 21 Data are most recent as of 3/31/12.
  • 22.
    The Aftermath ofthe Housing Bubble Median Existing Home Prices Monthly Rent vs. Monthly Mortgage Payment $ thousands, seasonally adjusted Vacant properties 240 $1,100 Nov. 2005: $227K Peak to 220 Monthly current: $950 Mortgage 200 -26.9% 1Q12*: $800 Payment 180 $706 160 $650 140 Feb. 2012: $166K Economy $500 120 1Q12*: $518 $350 Monthly Rent 100 80 $200 '92 '94 '96 '98 '00 '02 '04 '06 '08 '10 '12 '88 '90 '92 '94 '96 '98 '00 '02 '04 '06 '08 '10 '12 Home Sales and Inventories Affordability: Mortgage Payment on Average New Home Millions, annual rate, seasonally adjusted % of average household personal income 6 Home Sales 9 40% Inventories 8 35% 5 Feb. 2012: 7 30% 4 2.7 6 25% 3 Feb. 2012: 5 20% 10.5% 2 4 15% Feb. 2012: 4.9 1 3 '94 '96 '98 '00 '02 '04 '06 '08 '10 '12 10% '75 '80 '85 '90 '95 '00 '05 '10 Sources: (Top left) National Association of Realtors, FactSet, J.P. Morgan Asset Management. (Top right) Census Bureau, J.P. Morgan Asset Management. Monthly mortgage payment assumes a 20% down payment at prevailing 30-year fixed-rate mortgage rates; analysis based on median asking rent and median mortgage payment based on asking price. *1Q12 estimates provided by J.P. Morgan Asset Management. (Bottom left) Census Bureau, National Association of Realtors, J.P. Morgan Asset Management. Home sales include both new and existing home sales. Existing home sales include single-family, townhouses, condominiums and co-ops. (Bottom right) Census Bureau, FRB, BEA, J.P. Morgan Asset Management. Calculation assumes a 20% down payment, a 30-year fixed-rate mortgage, excludes property tax and homeowners’ insurance and is expressed as a % of pre-tax income. Data reflect most recently available as of 3/31/12. 22
  • 23.
    Employment Civilian Unemployment Rate Employment – Total Private Payroll Seasonally adjusted Total job gain/loss (thousands) 12% 600 11% 400 10% 200 Economy 8.8mm jobs lost 9% 0 Feb. 2012: 8.3% 8% 3.9mm -200 jobs gained 7% -400 6% -600 5% 50-yr. avg.: 6.1% 4% -800 3% -1,000 '70 '80 '90 '00 '10 '02 '03 '04 '05 '06 '07 '08 '09 '10 '11 Source: BLS, FactSet, J.P. Morgan Asset Management. Source: BLS, FactSet, J.P. Morgan Asset Management. Data reflect most recently available as of 3/31/12. 23
  • 24.
    Employment by Sectorand Education 20 Years – Net Job Creation Unemployment Rate by Education Level Net change in millions of payroll jobs, sa 18% Fin. & Bus. Services 6.9 16% Other Separations: 3.9mm Health Care 6.9 14% Feb. 2012: Economy Leisure & Hospitality 4.2 12.9% 12% Feb. 2012: 8.3% Education 4.0 10% Less than HS degree Trade & Retailing 3.3 8% Other Services 1.2 Feb. 2012: 6% HS No College 7.3% Mining & Construction 1.1 4% Some College Feb. 2012: Government 0.9 4.2% 2% Manufacturing -4.9 College or greater 0% -6.0 -4.0 -2.0 0.0 2.0 4.0 6.0 8.0 '92 '94 '96 '98 '00 '02 '04 '06 '08 '10 '12 Source: BLS, FactSet, J.P. Morgan Asset Management. Source: BLS, FactSet, J.P. Morgan Asset Management. Data reflect most recently available as of 3/31/12. 24
  • 25.
    Corporate Profits S&P 500 Earnings Per Share Most recent: Adjusted After-Tax Corporate Profits (% of GDP) Operating basis, quarterly Includes inventory and capital consumption adjustments 2Q07: $24.06 $23.73 $26 11% 4Q11: 10.3% $23 10% $20 9% Economy $17 8% $14 7% $11 50-yr. avg.: 6.2% 6% $8 5% $5 4% $2 -$1 3% '01 '03 '05 '07 '09 '11 '65 '70 '75 '80 '85 '90 '95 '00 '05 '10 Source: Standard & Poor’s, J.P. Morgan Asset Management. Source: BEA, FactSet, J.P. Morgan Asset Management. EPS levels are based on operating earnings per share. Most recently available is a 4Q11 99% complete estimate. Data reflect most recently available as of 3/31/12. 25
  • 26.
    Consumer Price Index CPI and Core CPI CPI Weight in 12-month % chg vs. prior year, seasonally adjusted 50-yr. Avg. Feb. 2012 Components CPI Change 15% Headline CPI: 4.2% 2.9% Food & Bev. 15.3% 3.8% Core CPI: 4.1% 2.2% Housing 41.0% 1.8% 12% Apparel 3.6% 4.2% Transportation 16.9% 5.8% Economy 9% Medical Care 7.1% 3.4% Recreation 6.0% 1.0% 6% Educ. & Comm. 6.8% 1.9% Other 3.4% 1.5% 3% Headline CPI 100.0% 2.9% Less: 0% Energy 9.7% 7.0% Food 13.7% 3.9% -3% '65 '70 '75 '80 '85 '90 '95 '00 '05 '10 Core CPI 76.6% 2.2% Source: BLS, FactSet, J.P. Morgan Asset Management. CPI values shown are % change vs. 1 year ago and reflect February 2012 CPI data. CPI component weights are as of December 2011 and 12-month change reflects non-seasonally adjusted data through February 2012. Core CPI is defined as CPI excluding food and energy prices. Data reflect most recently available as of 3/31/12. 26
  • 27.
    Returns in DifferentInflation Environments – 40 years Rising inflation scenarios Falling inflation scenarios High and Rising Inflation High and Falling Inflation Occurred 14 times since 1972 Occurred 6 times since 1972 25% 25% 23% 20% 20% 18% Above median 15% 13% 15% 10% 7% 8% 5% 10% Economy 5% 2% 5% 0% 0% -5% -5% -10% -10% -15% -15% -15% Bonds Equities Cash Commodities Bonds Equities Cash Commodities Median Inflation: Low and Rising Inflation Low and Falling Inflation 3.3% Occurred 7 times since 1972 Occurred 13 times since 1972 Below median 25% 25% 20% 20% 17% 20% 15% 15% 12% 10% 8% 6% 10% 6% 4% 5% 3% 5% 0% 0% -5% -5% -10% -10% -15% -15% Bonds Equities Cash Commodities Bonds Equities Cash Commodities Source: BLS, Barclays Capital, Robert Shiller, Federal Reserve, Strategas/Ibbotson, Standard and Poor’s, FactSet, J.P. Morgan Asset Management. High or low inflation distinction is relative to median CPI-U inflation for the period 19712to 2011. Rising or falling inflation distinction is relative to previous year CPI-U inflation rate. Bond returns are based on the Barclays U.S. Aggregate index since its inception in 1976 and a composite bond index prior to that. Equity returns based on S&P 500 price return and annual dividend yield. Cash returns are based on the Barclays 1-3 Month T-Bill index since its inception in 1992 and 3-month T-Bill rates prior to that. Commodities returns based on GSCI. For illustrative purposes only. Past performance is not indicative of comparable future returns. 27 Data reflect most recently available as of 3/31/12.
  • 28.
    Oil and theEconomy WTI Crude Oil & Retail Gasoline Prices Economic Drag From Oil Prices $4.50 $160 U.S. Petroleum Imports as a % of GDP 1Q12*: 3.2% Gas 12/31/2000 3/31/2012 Oil 4% Oil $26.72 $103.02 3Q08: 3.8% Gas $1.41 $3.92 $4.00 $140 3% $3.50 $120 2% Economy $3.00 $100 1% $2.50 $80 0% '70 '75 '80 '85 '90 '95 '00 '05 '10 Energy Spending by Income Level $2.00 $60 % of after-tax income Lowest 20% 2nd Middle 20% 4th Top 20% $1.50 $40 Natural Gas 2.4% 1.4% 0.9% 0.7% 0.5% Electricity 9.5% 4.6% 3.1% 2.2% 1.2% $1.00 $20 Fuel Oil & Other Fuels 0.9% 0.4% 0.3% 0.2% 0.2% Gasoline & Motor Oil 10.1% 5.9% 4.8% 3.7% 2.2% $0.50 $0 Total Energy 22.9% 12.3% 9.1% 6.8% 4.0% '94 '96 '98 '00 '02 '04 '06 '08 '10 '12 Source: U.S. Department of Energy, FactSet, J.P. Morgan Asset Management. Price of Source: (Top) BEA, FactSet, J.P. Morgan Asset Management. (Bottom) BLS, J.P. gas based on U.S. retail national average of all formulations and WTI for crude. Morgan Asset Management. Data reflect most recently available as of 3/31/12. *1Q12 drag from oil prices is a J.P. Morgan Asset Management estimate. 28
  • 29.
    Global Oil Supply Middle East Energy Production & Chokepoints U.S. Commercial & Strategic Oil Stocks Feb. 2012: Percent of global liquid fuel production, 2010 Days of net imports 224 days 250 Kuwait Syria 2.9% 200 0.5% Oct. 2005: Suez Canal 129 days 2.1% 150 Iraq Iran 2.8% 4.9% 100 Economy U.S. Commercial Oil Stocks Libya Egypt 50 2.1% 0.8% Saudi Arabia U.S. Strategic Petroleum Reserve 11.7% 0 '94 '96 '98 '00 '02 '04 '06 '08 '10 '12 Strait of Hormuz Sudan 18.0% OPEC Surplus Production Capacity 0.6% Millions of barrels per day UAE 6 3.3% EIA 5 forecast 4 Bab el-Mandeb 3.7% 3 Average: 2.7mm bbl/day Major Producers Major Consum ers 2 Percent of global total, 2010 Percent of global total, 2010 1 Saudi Arabia 12% China 5% United States 22% India 4% Russia 12% Iran 5% China 11% Russia 3% 0 United States 11% Canada 4% Japan 5% Saudi Arabia 3% '01 '02 '03 '04 '05 '06 '07 '08 '09 '10 '11 '12 '13 Source: EIA, J.P. Morgan Asset Management. Forecast from the March EIA Short Term Energy Outlook. Data are as of 3/31/12. 29
  • 30.
    Consumer Confidence andthe Stock Market Consumer Sentiment Index – University of Michigan 130 Average 12-month S&P 500 index return… Sentiment Cycle Peak/Trough and subsequent After a peak: +1.1% After a trough: +23.3% Total period: +6.6% 12-month S&P 500 Index return 120 Jan. 2000 -2.0% 110 Jan. 2004 Economy +4.4% Aug. 1972 Mar. 1984 100 Jan. 2007 -6.2% +13.5% May 1977 -4.2% +1.2% 90 Average: 85.3 80 Mar. 2003 70 +32.8% Oct. 2005 +14.2% 60 Oct. 1990 +29.1% Feb. 1975 Nov. 2008 Aug. 2011 +22.2% 50 +22.3% ? May 1980 +19.2% 40 '72 '74 '76 '78 '80 '82 '84 '86 '88 '90 '92 '94 '96 '98 '00 '02 '04 '06 '08 '10 '12 Source: University of Michigan, FactSet, J.P. Morgan Asset Management. Peak is defined as the highest index value before a series of lower lows, while a trough is defined as the lowest index value before a series of higher highs. Subsequent 12-month S&P 500 returns are price returns only, which excludes dividends. Data reflect most recently available as of 3/31/12. 30
  • 31.
    Confidence and theCapital Markets Multiple Expansion and Contraction Est. impact of a 10pt. rise in sentiment: +2.0 multiple points* S&P 500 forward P/E based on consensus EPS estimates 26x Forward P/E Consumer Sentiment 120 24x 110 22x 100 20x 90 18x 80 Economy 16x 14x 70 12x 60 10x 50 '93 '94 '95 '96 '97 '98 '99 '00 '01 '02 '03 '04 '05 '06 '07 '08 '09 '10 '11 Sentiment & Real Yields Est. impact of a 10pt. rise in sentiment: +54 basis points* Real yield based on nominal 10-yr. yield minus year over year core CPI 6% Real 10-year Yield Consumer Sentiment 120 5% 110 4% 100 3% 90 2% 80 1% 70 0% 60 -1% 50 '93 '94 '95 '96 '97 '98 '99 '00 '01 '02 '03 '04 '05 '06 '07 '08 '09 '10 '11 Source: (Top) Standard & Poor’s, FactSet, J.P. Morgan Asset Management. (Bottom) U.S. Treasury, BLS, University of Michigan, J.P. Morgan Asset Management. Price to Earnings is price divided by consensus analyst estimates of earnings per share for the next twelve months. Real 10- year Treasury yields are calculated as the daily Treasury yield less year-over-year core inflation for that month. *Estimated impact based on 31 coefficients from regression analysis. Data are as of 3/31/12.
  • 32.
    Fixed Income SectorReturns 10-yrs 2000 2001 2002 2003 2004 2005 2006 2007 2008 2009 2010 2011 1Q12 '02 - '11 EMD Corp. TIPS High Yield EMD EMD High Yield TIPS Treas. High Yield High Yield TIPS EMD EMD 13.7% 10.3% 16.7% 29.0% 11.9% 12.3% 11.8% 11.6% 13.7% 58.2% 15.1% 13.6% 5.5% 185.6% Barclays Asset Treas. EMD EMD High Yield EMD Treas. MBS EMD EMD Muni High Yield High Yield Agg Alloc. 13.5% 8.4% 12.2% 26.9% 11.1% 3.6% 10.0% 9.0% 8.3% 34.2% 12.8% 10.7% 5.3% 133.6% Barclays Barclays TIPS MBS Treas. TIPS TIPS Muni MBS Corp. Corp. Treas. Corp. TIPS Agg Agg 13.2% 8.2% 11.8% 10.6% 6.3% 3.5% 5.2% 7.0% 5.2% 18.7% 9.0% 9.8% 2.1% 107.5% Barclays Asset Asset Asset Asset Asset Asset Asset Asset Muni TIPS TIPS MBS Muni Agg Alloc. Alloc. Alloc. Alloc. Alloc. Alloc. Alloc. Alloc. 11.7% 7.9% 10.3% 10.0% 6.0% 2.8% 5.1% 6.9% -1.4% 15.8% 7.6% 8.9% 1.8% 96.0% Fixed Income Barclays Asset Asset Barclays Asset Corp. Corp. Corp. Treas. Muni TIPS Muni Corp. Corp. Agg Alloc. Alloc. Agg Alloc. 11.6% 6.8% 10.1% 8.2% 5.4% 2.8% 4.8% 6.2% -2.4% 12.9% 6.5% 8.2% 1.6% 85.2% Asset Barclays Barclays Barclays MBS Treas. Muni MBS High Yield EMD Muni TIPS TIPS TIPS Alloc. Agg Agg Agg 11.2% 6.7% 10.0% 5.3% 4.7% 2.7% 4.3% 5.2% -2.5% 11.4% 6.3% 7.8% 0.9% 75.4% Asset Barclays Barclays High Yield Muni Muni MBS Corp. Corp. Corp. Treas. EMD MBS Treas. Alloc. Agg Agg 10.2% 5.3% 9.6% 4.1% 4.5% 2.6% 4.3% 4.6% -4.9% 5.9% 5.9% 7.0% 0.6% 74.3% Barclays Barclays Barclays Corp. Muni MBS MBS Treas. Muni EMD MBS MBS MBS MBS Agg Agg Agg 9.1% 5.1% 8.7% 3.1% 4.3% 2.4% 3.1% 3.4% -14.7% 5.9% 5.4% 6.2% 0.3% 73.9% High Yield EMD High Yield Treas. Treas. Corp. TIPS High Yield High Yield Treas. Muni High Yield Treas. Muni -5.9% 1.5% -1.4% 2.2% 3.5% 1.7% 0.4% 1.9% -26.2% -3.6% 2.4% 5.0% -1.3% 68.8% Source: Barclays Capital, FactSet, J.P. Morgan Asset Management. Past performance is not indicative of future returns. Fixed income sectors shown above are provided by Barclays Capital and are represented by: Barclays Capital U.S. Aggregate Index; MBS: Fixed Rate MBS Index; Corporate: U.S. Corporates; Municipals: Muni Bond Index; Emerging Debt: Emerging Markets Index; High Yield: Corporate High Yield Index; Treasuries: Barclays Capital U.S. Treasury; TIPS: Barclays Capital TIPS. The “Asset Allocation” portfolio assumes the following weights: 10% in MBS, 20% in Corporate, 15% in Municipals, 10% in Emerging Debt, 10% in High Yield, 25% in Treasuries, 10% in TIPS. Asset allocation portfolio assumes annual rebalancing. 32 Data are as of 3/31/12.
  • 33.
    Interest Rates andInflation Nominal and Real 10-year Treasury Yields 20% Sep. 30, 1981: 15.84% 15% Average 3/31/12 Nominal Yields 6.50% 2.23% Real Yields 2.61% 0.06% 10% Nominal 10-year Treasury Yield Fixed Income Mar. 31, 2012: 2.23% 5% 0% Mar. 31, 2012: 0.06% -5% Real 10-year Treasury Yield -10% '58 '60 '62 '64 '66 '68 '70 '72 '74 '76 '78 '80 '82 '84 '86 '88 '90 '92 '94 '96 '98 '00 '02 '04 '06 '08 '10 '12 Source: Federal Reserve, BLS, J.P. Morgan Asset Management. Real 10-year Treasury yields are calculated as the daily Treasury yield less year-over-year core inflation for that month except for March 2012, where real yields are calculated by subtracting out February 2012 year-over-year core inflation. Data are as of 3/31/12. 33
  • 34.
    Fixed Income Yieldsand Returns Source: U.S. Treasury, Barclays Yield Return Capital, FactSet, J.P. Morgan Asset Management. Fixed income sectors shown above are U.S. Treasuries # of issues Mkt. Value Avg. Maturity 12/31/2010 3/31/2012 2011 1Q12 provided by Barclays Capital and are 2-Year 2 years 0.61% 0.33% 1.53% -0.08% represented by – Broad Market: US Barclays Capital Index; MBS: Fixed 5-Year # of issues: 142 5 2.01 1.04 9.36 -0.48 Rate MBS Index; Corporate: U.S. Corporates; Municipals: Muni Bond 10-Year Total value: $4.687 tn 10 3.30 2.23 17.18 -2.25 Index; Emerging Debt: Emerging 30-Year 30 4.34 3.35 35.60 -7.71 Markets Index; High Yield: Corporate High Yield Index. TIPS: Treasury Sector Inflation Protection Securities (TIPS). Treasury securities data for # of issues Broad Market 7,887 $16,113 bn 7.1 years 2.97% 2.22% 7.84% 0.30% and market value based on U.S. Treasury benchmarks from Barclays MBS 945 5,044 5.3 3.67 2.74 6.23 0.57 Capital. Yield and return information based on Bellwethers for Treasury Fixed Income Corporates 4,061 3,280 10.4 4.02 3.40 8.15 2.08 securities. Municipals 46,081 1,308 13.5 3.80 2.62 10.70 1.75 Change in bond price is calculated Emerging Debt 480 704 11.1 5.76 5.35 6.97 5.51 using both duration and convexity High Yield 1,893 1,030 6.8 7.51 7.23 4.98 5.34 according to the following formula: New Price = (Price + (Price * -Duration * TIPS 33 753 9.1 2.78 1.93 13.56 0.86 Change in Interest Rates))+(0.5 * Price * Convexity * (Change in Interest Rates)^2) Price Impact of a 1% Rise/Fall in Interest Rates +1% 19.0% 20% *Calculation assumes 2-year Treasury -1% interest rate falls 0.80% to 0.00% as 15% 8.9% interest rates can only fall to 0.00%. 10% 6.2% 6.6% 6.8% 7.6% 4.9% 4.2% 5.0% 3.3% 5% 0.7% Chart is for illustrative purposes only. 0% Past performance is not indicative of comparable future results. -5% -2.0% -4.9% -3.3% -4.2% Data are as of 3/31/12. -5.0% -6.2% -10% -6.6% -6.8% -7.6% -8.9% -15% -20% -19.0% -25% 2-Year 5-Year 10-Year 30-Year Sector MBS High Yield Broad Mkt TIPS EMD Corp. Munis 34
  • 35.
    The Fed andthe Money Supply Federal Funds Rate FOMC Projected Pace of Policy Firming 10% Target Federal Funds Rate at Year-End 9% 5.0% FOMC member Fed Funds Rate 8% projection as of January 25, 2012 Mar. 31, 2012: 4.0% 7% 6% 0-0.25% 3.0% 5% 4% 2.0% 3% 2% 1.0% 1% 0% 0.0% Fixed Income '86 '88 '90 '92 '94 '96 '98 '00 '02 '04 '06 '08 '10 '12 2012 2013 2014 Longer run Excess Reserves, Monetary Base and Multiplier Money Supply Growth $ trillions Year-over-year growth in M2 $3.0 Monetary Base & Reserves M2 Money Multiplier 10x 14% 9x 12% $2.5 Feb. 2012: 9.9% 8x 10% $2.0 7x Monetary Base 8% $1.5 6x Excess Reserves 6% 5x $1.0 4% 4x $0.5 2% 3x $0.0 2x 0% '02 '03 '04 '05 '06 '07 '08 '09 '10 '11 '85 '90 '95 '00 '05 '10 Source: Federal Reserve, FactSet, J.P. Morgan Asset Management. Monetary base is defined as the total amount of a currency that is either circulated in the hands of the public or in the commercial bank deposits held in the central bank's reserves. Money multiplier defined as M2 divided by the monetary base. Data are as of 3/31/12. 35
  • 36.
    Credit Conditions Lending Standards Consumer & Industrial Loan Demand Net percent of banks reporting tighter lending standards Net percent of banks reporting stronger demand 100% 60% Consumer Loans 84% 80% Commercial and Industrial Loans 40% 20% (Medium & Large Firms) 67% 60% 20% 40% 0% 20% 5% -20% 0% -40% 15% Small Firms -20% -60% Large & Medium Firms -3% -40% -80% Fixed Income '98 '00 '02 '04 '06 '08 '10 '12 '92 '94 '96 '98 '00 '02 '04 '06 '08 '10 '12 Delinquency Rates U.S. Corporate Issuance All banks, seasonally adjusted $ trillions 12% $3.5 Residential Mortgages $3.0 10% Consumer Loans $2.5 Total Equity Commercial and Industrial Loans 9.9% Total Debt 8% $2.0 6% $1.5 $1.0 4% 3.1% $0.5 2% 1.6% $0.0 '92 '94 '96 '98 '00 '02 '04 '06 '08 '10 '12 1990 1993 1996 1999 2002 2005 2008 2011 Source: (Top left) Federal Reserve, FactSet, J.P. Morgan Asset Management. (Top right) Federal Reserve, FactSet, J.P. Morgan Asset Management. (Bottom left): Federal Reserve, FactSet, J.P. Morgan Asset Management. (Bottom right) SIFMA, J.P. Morgan Asset Management. All data reflect most recently available releases. 2Q11 – 1Q12 estimates of lending standards on consumer loans are J.P. Morgan Asset Management estimates. 2011 corporate issuance is through February 2012. Data are as of 3/31/12. 36
  • 37.
    High Yield Bonds High Yield Spreads and Defaults 20% Average Latest HY Spreads 6.0% 6.3% HY Defaults 4.3% 1.9% 15% Spreads Default Rates 10% 5% 0% '88 '90 '92 '94 '96 '98 '00 '02 '04 '06 '08 '10 '12 Fixed Income Historical High Yield Recovery Rates Annual High Yield Bond Issuance High yield bonds, cents on the dollar Billions USD 70¢ $350 60¢ $300 50¢ $250 Average: 38.5¢ 40¢ $200 30¢ $150 20¢ $100 10¢ $50 0¢ $0 '88 '90 '92 '94 '96 '98 '00 '02 '04 '06 '08 '10 '86 '88 '90 '92 '94 '96 '98 '00 '02 '04 '06 '08 '10 '12 Source (Top chart): U.S. Treasury, J.P. Morgan, J.P. Morgan Asset Management. Default rates are defined as the par value percentage of the total market trading at or below 50% of par value and include any Chapter 11 filing, prepackaged filing or missed interest payments. (Bottom left): J.P Morgan, Moody’s, J.P. Morgan Asset Management. (Bottom right): J.P. Morgan Asset Management. Yield to worst is defined as the lowest potential yield that can be received on a bond without the issuer actually defaulting and reflects the possibility of the bond being called at an unfavorable time for the holder. Spreads indicated are benchmark yields less comparable maturity Treasury yields. Past performance is not indicative of comparable future results. 2011 issuance and recovery rates are as of March 30, 2012. 37 Data are as of 3/31/12.
  • 38.
    Municipal Finance Muni/Treasury Ratio State & Local Government Debt Service Ratio of Barclays 10-year Municipal Bond yield to 10-year Treasury Percent of current expenditures 8% 240% 7% 220% 4Q11: 5.6% 6% 200% 5% 180% 4% Fixed Income 160% '90 '92 '94 '96 '98 '00 '02 '04 '06 '08 '10 Municipal Bond Issuance* 140% Billions USD, revenue and GO issues $500 120% $400 $300 100% $200 80% Mar. 31, 2012: 111% $100 60% $0 '98 '00 '02 '04 '06 '08 '10 '12 '96 '97 '98 '99 '00 '01 '02 '03 '04 '05 '06 '07 '08 '09 '10 '11 '12 Source (Left chart): Barclays Capital, U.S. Treasury, FactSet, J.P. Morgan Asset Management. (Top right) BEA, J.P. Morgan Asset Management. (Bottom Right) SIFMA, J.P. Morgan Asset Management. *Excludes maturities of 13 months or less and private placements. 2012 issuance data is as of February 2012. Data are as of 3/31/12. 38
  • 39.
    Emerging Market Debt EM & DM Gross Debt to GDP Emerging Markets Bond Index Global Spreads 120% Sovereign and quasi-sovereign issues, USD-denominated bonds 10% Developed 100% Emerging 8% 80% 6% 60% Average: 3.8% 4% 40% 20% 2% Mar. 31, 2012: 3.4% 0% 0% '00 '01 '02 '03 '04 '05 '06 '07 '08 '09 '10 '11 '12 '02 '03 '04 '05 '06 '07 '08 '09 '10 '11 Fixed Income Corporate Emerging Markets Bond Spreads Local Emerging Market Bond Yields Corporate issues, USD-denominated bonds Sovereign issues, local currency-denominated bonds 12% 9% 10% 8% 8% Mar. 31, 2012: Mar. 31, 2012: 3.8% Average: 6.8% 6.4% 6% 7% 4% Average: 3.2% 6% 2% 0% 5% '01 '02 '03 '04 '05 '06 '07 '08 '09 '10 '11 '01 '02 '03 '04 '05 '06 '07 '08 '09 '10 '11 Source: J.P. Morgan, IMF, MorganMarkets, FactSet, J.P. Morgan Asset Management. Spreads measure the credit risk premium over comparable maturity U.S. Treasury bonds. The J.P. Morgan EMBI Global (EMBIG) Index is a USD-denominated external debt index tracking bonds issued by sovereigns and quasi-sovereigns in developing nations. The J.P. Morgan Corporate Emerging Bond Index (CEMBI) is a USD-denominated external debt index tracking bonds issued by corporations. The J.P. Morgan GBI-EM index is a local currency-denominated index tracking bonds issued by emerging market governments. Debt to GDP ratios use IMF definition and data for developed and emerging countries; 2012 ratios are IMF estimates. Past performance is not indicative of comparable future results. 39 Data are as of 3/31/12.
  • 40.
    Global Equity Markets:Returns and Composition World Market Returns – 1Q12, Percent 25% Local currency returns 20% 21.1 USD returns 20.1 19.1 18.6 18.0 15% 15.2 14.1 13.9 12.6 12.6 12.6 12.3 10% 11.3 11.3 11.4 10.3 11.0 10.0 10.8 9.9 9.9 10.1 9.4 9.5 7.6 5% 4.7 0% USA EAFE Europe ex- Pacific ex- Emerging United France Germany Japan China India Brazil Russia (S&P 500) U.K. Japan Markets Kingdom Weights in MSCI All Country World Index Share of Global GDP % global market capitalization Based on purchasing power parity Europe ex-U.K.: United 16% States: Canada: International 19% 2% United U.K.: 8% Emerging Japan: States: Markets: 6% Emerging 49% 46% Markets: Other 13% Developed: Europe Japan: ex-U.K.: 6% 8% United 15% Canada: Pacific: Kingdom: 4% 5% 3% Source: Standard & Poor’s, MSCI, IMF, FactSet, J.P. Morgan Asset Management. All return values are MSCI Gross Index (official) data. Share of global GDP based on purchasing power parity (PPP) as calculated by the IMF for 2011. Definition of emerging markets is based on MSCI and IMF data sources, respectively. 40 Data as of 3/31/12.
  • 41.
    Global Economic Growth Emerging Market Country Real GDP Growth Historical JPMSI Forecast Year-over-year % chg. – forecasts from JPMSI 10% 1Q11 2Q11 3Q11 4Q11 1Q12 2Q12 3Q12 4Q12 8% 6% 4% 2% 0% -2% Emerging Markets China India Mexico Russia Korea South Africa Brazil Developed Market Country Real GDP Growth Year-over-year % chg. – forecasts from JPMSI Historical JPMSI Forecast 10% 1Q11 2Q11 3Q11 4Q11 1Q12 2Q12 3Q12 4Q12 8% International 6% 4% 2% 0% -2% Developed U.S. Canada Japan Germany U.K. France Italy Countries Source: J.P. Morgan Global Economic Research, J.P. Morgan Asset Management. Forecast and aggregate data come from J.P. Morgan Global Economic Research. Data reflect most recently available as of 3/31/12. 41
  • 42.
    Global Monetary Policy Central Bank Assets – Percent of Nominal GDP Real Policy Rates – Monthly 35% 4% 30% 3% 25% 2% Bank of Japan 20% 1% 15% European Central Bank 0% 10% -1% Emerging Markets -2% 5% U.S. Federal Reserve Developed Markets -3% 0% '02 '03 '04 '05 '06 '07 '08 '09 '10 '11 '12 '99 '00 '01 '02 '03 '04 '05 '06 '07 '08 '09 '10 '11 Country Level Monetary Policy and Inflation 14.0% Target Policy Rate Inflation Rate Real Policy Rate 10.5% 7.0% 3.5% International 0.0% -3.5% -7.0% China South Africa Indonesia Russia Thailand Poland India Colombia Hong Kong Canada Australia Turkey Mexico Korea Taiwan Euro area U.K. U.S. Japan Brazil Developed Markets Emerging Markets Source: J.P. Morgan Global Economics Research, J.P. Morgan Asset Management. (Top charts) Emerging and Developed Economy GDP growth and real policy rates represent GDP weighted aggregates estimated by J.P. Morgan Global Economics Research. (Bottom chart) Target policy rates are the short-term target interest rates set by central banks. Inflation rates shown represent year-over-year quarterly rates for 4Q11. Real policy rates are short-term target interest rates set by central banks minus year-over-year inflation. 42 Data are as of 3/31/12.
  • 43.
    The Importance ofExports Exports as a % of GDP – 2010 Goods exports only Brazil 0.9% 2.1% 1.9% 4.7% 9.7% U.S. Eurozone BRIC Other Total India 1.5% 2.4% 2.0% 7.8% 13.7% Russia 0.8% 10.1% 1.9% 12.5% 25.3% China 4.8% 4.8% 1.6% 15.7% 26.9% U.S. 1.4% 1.2% 6.1% 8.8% Japan 2.2% 1.6% 3.9% 6.4% 14.1% U.K. 1.9% 9.3% 1.1% 4.3% 16.6% France 1.0% 12.0% 1.4% 5.5% 19.9% International Italy 1.2% 11.6% 1.7% 6.9% 21.4% Canada 18.4% 2.3% 1.3% 2.6% 24.5% Germany 2.0% 20.9% 3.7% 10.1% 36.7% 0% 5% 10% 15% 20% 25% 30% 35% 40% Source: IMF, J.P. Morgan Asset Management. Numbers represent exports of goods only, and would be higher if services were included. Data reflect most recently available as of 3/31/12. 43
  • 44.
    The Impact ofGlobal Consumers Share of Global Nominal Consumption Foreign Sales, % of Total Sales 40% 35% 35% 30% Mega Cap (Russell 200) 30% 25% Large Cap (Russell 1000) 25% 20% 20% U.S. Consumption % of Global 15% International EM Consumption % of Global Small Cap (Russell 2000) 15% 10% 1990 1994 1998 2002 2006 2010 '90 '92 '94 '96 '98 '00 '02 '04 '06 '08 '10 Source: FactSet, Compustat, Russell, J.P. Morgan Global Economics Research, J.P. Morgan Asset Management. Estimates of global consumption for 2010 and 2011 provided by J.P. Morgan Global Economics Research. Foreign sales as a percentage of total sales is calculated as an unweighted average of individual index constituent companies’ reported sales figures and does not capture all index members due to differences in reporting practices. Data are as of 3/31/12. 44
  • 45.
    European Crisis: FiscalChallenges GDP Growth, Debt to GDP and Borrowing Costs Example of Fiscal Redistribution in the U.S. Bubble size = 10-year 8% government bond yield EM = 10% 6% = 5% Real GDP Growth (2010 – 2012) 4% Germany U.S. 2% France E.U. Italy The E.U. Lacks a Similar Fiscal Mechanism Spain Ireland 0% Portugal -2% Greece International -4% -6% 20% 40% 60% 80% 100% 120% 140% 160% Net Debt-to-GDP Ratio (2011 est.) Source: IMF, BLS, J.P. Morgan Asset Management. Maps are for illustrative purposes only and are intended to show the current sources of stress in each region. The U.S. state colors are based on level of unemployment rate. European country colors are based on levels of sovereign stress, including but not exclusively the measure shown in the above chart on the left. Growth and debt data based on the September 2011 World Economic Outlook. Bond yields as of 3/31/12. Data are as of 3/31/12. 45
  • 46.
    European Crisis: FinancialSystem Risks European Bank Exposure – $ Billions European Sovereign Funding Costs $400 10-year benchmark bond yields, daily Derivative claims 18% 1st LTRO $300 Sovereign debt claims and bank claims 16% $200 Country Yield (3/31/12) Portugal 11.20% $100 14% Ireland 6.79% Spain 5.35% Italy 5.12% $0 Greek Portugese Irish Spanish Italian U.S. banks 12% exposure to Exposure of all European banks to each country’s all GIIPS public sector, banking sector and derivative claims European Central Bank Balance Sheet 10% Trillions of Euros €3.0 Feb. 2012: €2.7tn 8% International €2.5 6% €2.0 4% €1.5 2% Jan-10 Jul-10 Jan-11 Jul-11 Jan-12 Dec-09 Jun-10 Dec-10 Jun-11 Dec-11 Source: FactSet, BIS, ECB, J.P. Morgan Asset Management. Bank exposure based on 4Q11 data. LTRO refers to the ECB’s December Long-Term Refinancing Operation. Data are as of 3/31/12. 46
  • 47.
    Chinese Growth andEconomic Policy China & U.S. Contribution to Global GDP Growth Chinese Inflation and the Money Supply Share of year-over-year change in nominal global GDP Year-over-year % change 40% 10% 30% China Most Recent 35% United States 8% CPI (LHS) 3.2% 30% M2 (RHS) 13.0% 25% 6% 25% 20% 4% 20% 15% 2% 10% 15% 0% 5% 0% * -2% 10% '81 '84 '87 '90 '93 '96 '99 '02 '05 '08 '11 '14 '00 '02 '04 '06 '08 '10 '12 Components of Chinese Nominal GDP Chinese Currency 100% Net Exports: 3% Net Exports: 2% Chinese Renminbi per USD, inverted 6.0 Government: 13% Government 13% Mar. '12: 6.30 80% Investment 6.5 International Spending Investment 60% 35% Spending 7.0 May '10 – Mar. ‘12: 51% Jun. '05 – Jul. '08: +5.9% 40% 7.5 +17.5% Consumption 20% 49% Consumption 8.0 34% 0% 8.5 1990 2010 '02 '03 '04 '05 '06 '07 '08 '09 '10 '11 Source: (Top left) IMF, J.P. Morgan Asset Management. (Top right) National Bureau of Statistics, J.P. Morgan Economics, J.P. Morgan Asset Management. (Bottom left) IMF, J.P. Morgan Asset Management. (Bottom right) FactSet, J.P. Morgan Asset Management. *In 2009, global growth was negligible, while Chinese growth was robust, which resulted in China contributing over 1200% to global growth. Calculations based on PPP exchange rates and 2012 – 2016 growth forecasts are from the IMF. Data reflect most recently available as of 3/31/12. 47
  • 48.
    Global Equity Valuations– Developed and Emerging Markets Developed Market Countries Example +6 Std Dev Std Dev from Global Average +5 Std Dev Expensive +4 Std Dev relative to +3 Std Dev world +2 Std Dev +1 Std Dev Expensive relative to own Current Average history -1 Std Dev Average -2 Std Dev Cheap relative to -3 Std Dev own history Cheap -4 Std Dev relative to -5 Std Dev world World EAFE France Germany U.K. Australia Japan Canada Switzerland United (ACWI) States Emerging Market Countries +6 Std Dev Note: Each valuation index shows an equally weighted Std Dev from Global Average +5 Std Dev +4 Std Dev composite of four metrics: +3 Std Dev price to forward earnings +2 Std Dev (Fwd. P/E), price to current +1 Std Dev book (P/B), price to last 12 International Average months’ cash flow (P/CF) and -1 Std Dev -2 Std Dev price to last 12 months’ -3 Std Dev dividends normalized using -4 Std Dev means and average -5 Std Dev variability over the last 10 World EM Russia China Brazil Taiwan South Korea Mexico India years. (ACWI) Index Africa Source: MSCI, FactSet, J.P. Morgan Asset Management. Note: Each valuation index shows an equally weighted composite of four metrics: price to forward earnings (Fwd. P/E), price to current book (P/B), price to last 12 months’ cash flow (P/CF) and price to last 12 months’ dividends. Results are then normalized using means and average variability over the last 10 years. The grey bars represent valuation index variability relative to that of the All Country World Index (ACWI). See disclosures page at the end for metric definitions. 48 Data are as of 3/31/12.
  • 49.
    International Economic andDemographic Data Economics Demographics GDP USD GDP Per GDP Unempl. Inflation Population Percent Median Migration (CPI) Population (B$s) Capita Growth Rate Growth Age >65 Age per 1000 Developed U.S. $15,094 $48,147 3.0% 8.3% 2.9% 314 mm 0.9% 13.1% 36.9 yrs +3.6 Canada 1,759 51,147 1.8 7.4 2.6 34 0.8 15.9 41.0 +5.7 U.K. 2,481 39,604 -0.8 8.3 3.4 63 0.6 16.5 40.0 +2.6 Germany 3,629 44,556 -0.7 5.8 2.4 81 -0.2 20.6 44.9 +.7 France 2,808 44,401 0.9 10.0 2.3 66 0.5 16.8 39.9 +1.1 Japan 5,855 45,774 -0.7 4.6 0.1 127 -0.1 22.9 44.8 - Italy 2,246 37,046 -2.9 9.2 3.3 61 0.4 20.3 43.5 +4.7 Emerging Russia 1,885 13,236 7.0 6.5 3.7 138 -0.5 13.0 38.7 +0.3 Mexico 1,185 10,803 1.7 5.2 3.9 115 1.1 6.6 27.1 -3.1 Brazil 2,518 12,917 1.3 5.7 5.8 206 1.1 6.7 29.3 -0.1 International China 6,988 5,184 9.2 4.1 3.2 1,343 0.5 8.9 35.5 -0.3 India 1,843 1,527 3.8 9.8 5.2 1,205 1.3 5.5 26.2 -0.1 Source: FactSet, Eurostat, CIA, J.P. Morgan Securities, J.P. Morgan Asset Management. GDP levels represent 2011 data and are from the September 2011 World Economic Outlook published by the IMF, except for the U.S. levels, which come directly from the BEA. All GDP Growth data are from J.P. Morgan Economics and expressed as % change versus prior quarter annualized. All GDP Growth data are for 4Q11. India unemployment is from CIA estimates and is as of 2011, and Italy unemployment is as of 1/31/12. CPI Inflation is shown as % change versus a year ago and all data are for February 2012, except for India and Japan, which are as of January 2012. Unemployment rate for developed countries refers to February 2012 and comes from FactSet Economics, Eurostat and Statistics Canada. Demographic data provided by CIA World Factbook at CIA.gov. Data are as of 3/31/12. 49
  • 50.
    Current Account Deficitand U.S. Dollar Current Account Balance, % of GDP U.S. Dollar Index Nominal trade-weighted exchange index: major currencies -8% 115 4Q05: 110 -6.5% -6% 105 100 95 -4% 4Q11: -3.2% 90 Mar. 2009: 85 84.0 -2% 80 International 75 0% 70 Mar. 2008: 70.3 Mar. 2012: 72.9 65 '92 '94 '96 '98 '00 '02 '04 '06 '08 '10 '12 '94 '96 '98 '00 '02 '04 '06 '08 '10 '12 Source: BEA, FactSet, J.P. Morgan Asset Management. Source: Federal Reserve, FactSet, J.P. Morgan Asset Management. Data are as of 3/31/12 and are reported quarterly. Data are as of 3/31/12. 50
  • 51.
    Asset Class Returns 10-yrs 2000 2001 2002 2003 2004 2005 2006 2007 2008 2009 2010 2011 . 1Q '12 '02 - '11 DJ UBS M SCI M SCI M SCI Barclays M SCI M SCI M SCI REITs REITs REITs REITs REITs REITs Cmdty EM E EM E EM E Agg EM E EM E EM E 26.4% 13.9% 23.9% 56.3% 31.6% 34.5% 35.1% 39.8% 5.2% 79.0% 28.0% 8.3% 14.1% 277.2% DJ UBS M arket Barclays Russell M SCI DJ UBS M SCI M SCI M arket M SCI Russell Barclays S&P REITs Cmdty Neutral Agg 2000 EM E Cmdty EM E EAFE Neutral EAFE 2000 Agg 500 24.2% 9.3% 10.3% 47.3% 26.0% 17.6% 32.6% 11.6% 1.1%* 32.5% 26.9% 7.8% 12.6% 164.2% M arket Barclays M arket M SCI M SCI M SCI M SCI DJ UBS Asset M SCI M arket Russell Barclays REITs Neutral Agg Neutral EAFE EAFE EAFE EAFE Cmdty Alloc. EM E Neutral 2000 Agg 15.0% 8.4% 7.4% 39.2% 20.7% 14.0% 26.9% 11.1% -23.8% 28.0% 19.2% 4.5% 12.4% 75.4% Barclays Russell Russell Russell M arket Russell Russell DJ UBS S&P M SCI Asset REITs REITs REITs Agg 2000 2000 2000 Neutral 2000 2000 Cmdty 500 EAFE Alloc. 11.6% 2.5% 3.8% 37.1% 18.3% 12.2% 18.4% 9.3% -33.8% 27.2% 16.7% 2.1% 11.0% 73.5% Asset M SCI Asset S&P Asset Asset S&P Asset DJ UBS S&P S&P Asset Russell REITs Alloc. EM E Alloc. 500 Alloc. Alloc. 500 Alloc. Cmdty 500 500 Alloc. 2000 0.6% -2.4% -5.4% 28.7% 12.5% 8.0% 15.8% 7.3% -36.6% 26.5% 15.1% -0.2% 10.5% 72.8% Russell Asset M SCI Asset S&P M arket Asset Barclays S&P Asset Asset Russell Asset M arket 2000 Alloc. EM E Alloc. 500 Neutral Alloc. Agg 500 Alloc. Alloc. 2000 Alloc. Neutral -3.0% -3.4% -6.0% 25.2% 10.9% 6.1% 14.9% 7.0% -37.0% 22.5% 12.7% -4.2% 7.5% 72.7% S&P S&P M SCI DJ UBS DJ UBS S&P M arket S&P DJ UBS M SCI M SCI M arket M SCI REITs 500 500 EAFE Cmdty Cmdty 500 Neutral 500 Cmdty EAFE EAFE Neutral EAFE -9.1% -11.9% -15.7% 22.7% 7.6% 4.9% 11.2% 5.5% -37.7% 18.7% 8.2% -11.7% 1.5% 64.8% M SCI M SCI Russell M arket M arket Russell Barclays Russell M SCI Barclays Barclays DJ UBS DJ UBS DJ UBS EAFE EAFE 2000 Neutral Neutral 2000 Agg 2000 EAFE Agg Agg Cmdty Cmdty Cmdty Asset Class -14.0% -21.2% -20.5% 7.1% 6.5% 4.6% 4.3% -1.6% -43.1% 5.9% 6.5% -13.4% 0.9% 58.0% M SCI DJ UBS S&P Barclays Barclays Barclays DJ UBS M SCI M arket M arket M SCI Barclays S&P REITs EM E Cmdty 500 Agg Agg Agg Cmdty EM E Neutral Neutral EM E Agg 500 -30.6% -22.3% -22.1% 4.1% 4.3% 2.4% -2.7% -15.7% -53.2% 4.1% -2.5% -18.2% 0.3% 33.4% Source: Russell, MSCI, Dow Jones, Standard and Poor’s, Credit Suisse, Barclays Capital, NAREIT, FactSet, J.P. Morgan Asset Management. The “Asset Allocation” portfolio assumes the following weights: 25% in the S&P 500, 10% in the Russell 2000, 15% in the MSCI EAFE, 5% in the MSCI EMI, 30% in the Barclays Capital Aggregate, 5% in the CS/Tremont Equity Market Neutral Index, 5% in the DJ UBS Commodity Index and 5% in the NAREIT Equity REIT Index. Balanced portfolio assumes annual rebalancing. All data except commodities represent total return for stated period. Past performance is not indicative of future returns. Data are as of 3/31/12, except for the CS/Tremont Equity Market Neutral Index, which reflects data through 2/29/12. “10-yrs” returns represent cumulative total return and are not annualized. These returns reflect the period from 1/1/02 – 12/31/11. Please see disclosure page at end for index definitions. *Market Neutral returns include estimates found in disclosures. 51 Data are as of 3/31/12.
  • 52.
    Correlations: 10-Years Eq Large Small Core Corp. Hedge Market Cap Cap EAFE EME Bonds HY EMD Cmdty. REITs Funds Neutral* Large Cap 1.00 0.95 0.91 0.85 -0.31 0.79 0.68 0.45 0.76 0.77 0.50 Small Cap 1.00 0.88 0.81 -0.35 0.73 0.61 0.40 0.82 0.74 0.48 EAFE 1.00 0.92 -0.22 0.74 0.64 0.52 0.73 0.85 0.66 EME 1.00 -0.18 0.80 0.75 0.59 0.65 0.88 0.54 Core Bonds 1.00 -0.11 0.15 -0.25 -0.04 -0.22 -0.02 Corp. HY 1.00 0.86 0.52 0.69 0.77 0.40 EMD 1.00 0.41 0.60 0.64 0.35 Commodities 1.00 0.39 0.70 0.49 REITs 1.00 0.59 0.50 Hedge Funds 1.00 0.57 Asset Class Eq Market Neutral* 1.00 Source: Standard & Poor’s, Russell, Barclays Capital Inc., MSCI Inc., Credit Suisse/Tremont, NCREIF, DJ UBS, J.P. Morgan Asset Management. Indexes used – Large Cap: S&P 500 Index; Small Cap: Russell 2000; EAFE: MSCI EAFE; EME: MSCI Emerging Markets; Bonds: Barclays Capital Aggregate; Corp HY: Barclays Capital Corporate High Yield; EMD: Barclays Capital Emerging Market; Cmdty.: DJ UBS Commodity Index; Real Estate: NAREIT Equity REIT Index; Hedge Funds: CS/Tremont Multi-Strategy Index; Equity Market Neutral: CS/Tremont Equity Market Neutral Index. *Market Neutral returns include estimates found in disclosures. All correlation coefficients calculated based on quarterly total return data for period 12/31/01 to 12/31/11. This chart is for illustrative purposes only. 52
  • 53.
    Mutual Fund Flows Fund Flows Billions, USD AUM YTD 2012 2011 2010 2009 2008 2007 2006 2005 2004 2003 2002 2001 2000 Domestic Equity 4,254 (5) (135) (95) (28) (148) (65) (0) 18 101 120 (26) 55 261 World Equity 1,535 4 5 58 28 (80) 139 149 106 71 24 (3) (22) 53 Taxable Bond 2,525 49 136 230 311 22 97 45 26 5 40 125 76 (36) Tax-exempt Bond 522 13 (12) 11 69 8 11 15 5 (15) (7) 17 11 (14) Hybrid 903 16 30 24 10 (26) 42 18 37 49 38 9 9 (36) Money Market 2,653 (39) (124) (525) (539) 637 654 245 62 (157) (263) (46) 375 159 U.S. Equity Fund Flows and Market Performance Difference Between Flows Into Stock and Bond Funds Billions USD, U.S. equity funds, quarterly Billions, USD, U.S. and international funds, monthly $120 Equity Flows S&P 500 1600 $40 Bond flows exceeded equity flows $100 1400 by $35 billion in February 2012 $80 $20 $60 1200 $40 $0 1000 $20 800 -$20 $0 Asset Class -$20 600 -$40 -$40 400 -$60 -$60 -$80 200 Mar '08 Sep '08 Mar '09 Sep '09 Mar '10 Sep '10 Mar '11 Sep '11 '90 '92 '94 '96 '98 '00 '02 '04 '06 '08 '10 '12 Source: Investment Company Institute, J.P. Morgan Asset Management. Data include flows through February 2012 and exclude ETFs. ICI data are subject to periodic revisions. World equity flows are inclusive of emerging market, global equity and regional equity flows. Hybrid flows include asset allocation, balanced fund, flexible portfolio and mixed income flows. 53 Data are as of 3/31/12.
  • 54.
    Dividend Income: Domesticand Global S&P 500 Total Return: Dividends vs. Capital Appreciation Average annualized returns Capital appreciation 20% Dividends 15% 13.9% 13.6% 10% 12.6% 15.3% 3.0% 1.6% 5.5% 5% 4.4% 5.4% 6.0% 5.1% 1.8% 4.7% 3.3% 4.2% 4.4% 4.1% 2.5% 0% -2.7% -5.3% -5% -10% 1926 - 1929 1930's 1940's 1950's 1960's 1970's 1980's 1990's 2000's 1926 to 2011 REIT Dividend Yields Equity Dividend Yields Major world markets by capitalization Major world markets by capitalization 10-year government 6% 10-year government 7% 6.4% 6.2% bond yield bond yield 4.8% 6% 5.4% 5% 5.3% 4.4% 5.1% 5% 3.7% 4.3% 4.2% 4% 3.5% 4% 3.5% 2.7% 2.8% 3% 2.3% Asset Class 3% 2% 2% 2.0% 1% 1% 0% 0% U.S. Singapore Australia France Canada Japan Global U.K. U.S. Australia France U.K. Switzerland ACWI Canada Japan Source: (Top chart) Standard & Poor’s, Ibbotson, J.P. Morgan Asset Management. (Bottom left) FactSet, NAREIT, J.P. Morgan Asset Management. Yields shown are that of the appropriate FTSE NAREIT REIT index, which excludes property development companies. (Bottom right) FactSet, MSCI, J.P. Morgan Asset Management. Yields shown are that of the appropriate MSCI index. Data are as of 3/31/12. 54
  • 55.
    Global Commodities Commodity Prices Oil Demand: Emerging Markets Share Weekly index prices rebased to 100 Emerging markets as % of total global oil consumption 40% 600 Precious metals 38% 36% 500 34% Industrial metals 32% 400 30% '96 '97 '98 '99 '00 '01 '02 '03 '04 '05 '06 '07 '08 '09 '10 Energy 300 Commodity Prices and Inflation Year over year % chg. 8% DJ-UBS Commodity Index (Y/Y % chg.) 80% 6% 60% 200 4% 40% Grains 2% 20% Asset Class 100 0% 0% -2% -20% Livestock -4% Headline CPI (Y/Y % chg.) -40% 0 -6% -60% '02 '03 '04 '05 '06 '07 '08 '09 '10 '11 '94 '96 '98 '00 '02 '04 '06 '08 '10 '12 Source: Dow Jones/UBS, FactSet, J.P. Morgan Asset Management. Source: (Top) USDA, BP Statistical Review of World Energy, J.P. Morgan Asset Management. (Bottom) BLS, Commodity prices represented by the appropriate DJ/UBS Commodity sub-index. DJ/UBS, FactSet, J.P. Morgan Asset Management Data reflect most recently available as of 3/31/12. 55 Data are as of 3/31/12.
  • 56.
    Gold Gold Prices World Gold Production $ / oz Year Troy Ounces Total Value $2,000 2000 83.3 mm $23 bn $1,800 Gold 2001 83.6 mm $23 bn Gold, Inflation adjusted Mar. 2012: $1,600 $1,662.50 2002 82.0 mm $25 bn $1,400 2003 81.7 mm $30 bn $1,200 2004 77.8 mm $32 bn $1,000 Jan. 1980: $850.00 2005 79.4 mm $35 bn $800 2006 76.2 mm $46 bn $600 2007 75.9 mm $53 bn Jan. 1980: $433.72 Mar. 2012: $400 $318.46 2008 73.6 mm $64 bn Asset Class $200 2009 78.8 mm $86 bn $0 2010 80.4 mm $113 bn '75 '80 '85 '90 '95 '00 '05 '10 Source: (Left chart) EcoWin, BLS, U.S. Department of Energy, FactSet, J.P. Morgan Asset Management. (Right table) U.S. Geological Survey, World Gold Council, J.P. Morgan Asset Management. CPI adjusted gold values are calculated using month averages of gold spot prices divided by the CPI value for that month. CPI is rebased to 100 at the start of the chart. Data reflect most recently available as of 3/31/12. 56
  • 57.
    Historical Returns byHolding Period Range of Stock, Bond and Blended Total Returns Annual total returns, 1950 – 2011 60% Annual Avg. Growth of $100,000 Total Return over 20 years 50% Stocks 10.8% $771,337 51% Bonds 6.3% $337,713 40% 43% 50/50 Portfolio 8.9% $552,853 30% 32% 28% 20% 23% 21% 19% 16% 17% 18% 10% 14% 12% 6% 5% 0% -2% -2% 1% 2% -1% 1% 1% -8% -10% -15% Stocks -20% Bonds Asset Class 50/50 Portfolio -30% -37% -40% 1-yr. 5-yr. rolling 10-yr. rolling 20-yr. rolling Sources: Barclays Capital, FactSet, Robert Shiller, Strategas/Ibbotson, Federal Reserve, J.P. Morgan Asset Management. Data are as of 3/31/12. 57
  • 58.
    Diversification and theAverage Investor (Top) Indexes and weights of the Maximizing the Power of Diversification (1994 – 2011) traditional portfolio are as follows: Traditional Portfolio More Diversified Portfolio U.S. stocks: 55% S&P 500, U.S. bonds: 30% Barclays Capital Equity Mkt. Neutral Aggregate. International stocks: 15% MSCI EAFE. Portfolio with 25% Commodities in alternatives is as follows: U.S. 8% stocks: 22.2% S&P 500, 8.8% REIT Russell 2000; International Stocks: S&P 500 26% 8% 4.4% MSCI EM, 13.2% MSCI EAFE; 30% 8% S&P 500 U.S. Bonds: 26.5% Barclays Capital 55% MSCI EAFE Aggregate; Alternatives: 8.3% Russell 2000 CS/Tremont Equity Market Neutral, 4% 8.3% DJ/UBS Commodities, 8.3% Barclays Agg. 22% NAREIT Equity REIT Index. Return 15% 13% MSCI EAFE and standard deviation calculated 9% using Morningstar Direct. MSCI EM Charts are shown for illustrative purposes only. Past returns are no Barclays Agg. guarantee of future results. Diversification does not guarantee Return: 6.75% Return: 7.09% investment returns and does not Standard Deviation: 10.94% Standard Deviation: 9.97% eliminate risk of loss. Data are as of 12/31/11. 20-year Annualized Returns by Asset Class (1992 – 2011) (Bottom) Indexes used are as follows: REITS: NAREIT Equity REIT 12% Index, EAFE: MSCI EAFE, Oil: WTI 10.9% Index, Bonds: Barclays Capital U.S. Aggregate Index, Homes: median 10% sale price of existing single-family 8.6% homes, Gold: USD/troy oz, Inflation: 7.8% 7.6% CPI. Average asset allocation 8% investor return is based on an 6.5% analysis by Dalbar Inc., which utilizes Asset Class the net of aggregate mutual fund 6% sales, redemptions and exchanges each month as a measure of investor 4.0% behavior. Returns are annualized 4% (and total return where applicable) 2.5% 2.5% and represent the 20-year period 2.1% 2% ending 12/31/11 to match Dalbar’s most recent analysis. 0% REITs Oil S&P 500 Gold Bonds EAFE Inflation Homes Average Investor 58
  • 59.
    Annual Returns andIntra-year Declines Intra-year Declines vs. Calendar Year Returns Despite average intra-year drops of 14.5%, annual returns positive in 25 of 32 years 50% 34 35% 31 26 26 27 26 27 26 23 20 20 20% 17 15 15 14 12 13 9 -10 -7 7 -2 4 -10 -13 -23 3 4 5% 1 2 -38 0 -3 -10% -6 -6 -5 -7 -8 -8 -8 -8 -8 -7 -8 -9 -9 -10 -12 -11 -12 -14 -14 -17 -17 -17 -16 -20 -19 -19 -25% -26 -28 -32 -34 -40% Asset Class -47 -55% '80 '81 '82 '83 '84 '85 '86 '87 '88 '89 '90 '91 '92 '93 '94 '95 '96 '97 '98 '99 '00 '01 '02 '03 '04 '05 '06 '07 '08 '09 '10 '11 Source: Standard and Poor’s, FactSet, J.P. Morgan Asset Management. Returns are based on price index only and do not include dividends. Intra-year drops refers to the largest market drops over periods of 6 months or less. For illustrative purposes only. Data are as of 3/31/12. 59
  • 60.
    Alternative Investment Returns Hedge Funds (as of 12/31/11) 1 year 3 year 5 year 10 year CSFB/Tremont HF Index -2.5% 8.6% 3.2% 6.4% Multi-Strategy 1.8% 11.5% 3.1% 6.6% Distressed -4.2% 8.5% 1.9% 7.4% Convertible Arbitrage 1.1% 18.2% 3.5% 4.7% Equity Market Neutral* 4.5% 2.5% 3.6% 5.6% Risk Arbitrage** 0.8% 5.2% 4.2% 4.2% Fixed Income Arbitrage** 4.7% 14.5% 2.1% 4.0% Global Macro 6.4% 10.4% 8.6% 10.6% Real Estate (as of 12/31/11) 1 year 3 year 5 year 10 year NCREIF Property Index 14.3% 2.4% 3.1% 8.1% Apartment 15.5% 4.0% 3.1% 8.0% Industrial 14.6% 1.0% 2.2% 7.3% Office 13.8% 0.9% 2.8% 7.1% Retail 13.8% 4.5% 4.4% 10.7% Private Equity (as of 9/30/11) 1 year 3 year 5 year 10 year U.S. Venture Capital Index 20.9% 4.9% 6.7% 2.6% U.S. Private Equity Index 13.8% 7.3% 8.1% 11.6% Asset Class Source: Cambridge Associates LLC, NCREIF, CS/Tremont, J.P. Morgan Asset Management. Cambridge PE and VC data provided at no charge. Other indexes shown are unmanaged and are for illustrative purposes only. Past performance is no guarantee of future results. Returns for all periods are as of 12/31/11 with the exception of Private Equity and Venture Capital returns, which are as of 9/30/11. All returns are annualized for periods greater than 1 year. Investing in alternative assets involves higher risks than traditional investments and is suitable only for the long term. They may not be tax efficient and have higher fees than traditional investments. They may also be highly leveraged and engage in speculative investment techniques, which can magnify the potential for investment loss or gain. *Market Neutral returns include estimates found in disclosures. **Arbitrage is the simultaneous purchase and sale of an asset in order to profit from a difference in the price. Data are as of 3/31/12. 60
  • 61.
    Cash Accounts Annual Income Generated by $100,000 Investment in a 6-month CD Weight in $10,000 Money Supply $ Billions Money Component Supply $8,000 2006: $5,240 $6,000 M2-M1 7,565 76.2% $4,000 2011: $419 Retail MMMFs 661 6.7% $2,000 $0 Savings deposits 6,167 62.1% 1986 1990 1994 1998 2002 2006 2010 Cash Accounts Total Household Financial Assets Cash as a % of Small time deposits 738 7.4% 28% 6-month CD rate vs. Core CPI Mar. ’09 S&P 500 low 24% Oct. ’02 S&P 500 low Institutional MMMFs 1,721 17.3% 20% Cash in IRA & Keogh 639 6.4% accounts 16% Asset Class 12% Total 9,924 100.0% '98 '00 '02 '04 '06 '08 '10 Source: Federal Reserve, St. Louis Fed, Bankrate.com, J.P. Morgan Asset Management. All cash measures obtained from the Federal Reserve are seasonally adjusted monthly numbers. All numbers are in billions of U.S. dollars. Small-denomination time deposits are those issued in amounts of less than $100,000. All IRA and Keogh account balances at commercial banks and thrift institutions are subtracted from small time deposits. Annual income is for illustrative purposes and is calculated based on the 6-month CD yield on average during each year and $100,000 invested. IRA and Keogh account balances at money market mutual funds are subtracted from retail money funds. Past performance is not indicative of comparable future results. Data are as of 3/31/12. 61
  • 62.
    Corporate DB Plansand Endowments Asset Allocation: Corporate DB Plans vs. Endowments Defined Benefit Plans – Funded Status: S&P 500 companies Endowments overfunded underfunded Corporate Defined Benefit Plans 8% 32.0% 22% Equities 45.3% Fixed Income 13.0% 78% 92% 35.5% 21.9% Hedge Funds 2.7% 1999 2010 10.7% Pension Return Assumptions: S&P 500 companies Private Equity 40% 1999: Average 9.2% 4.7% 33% 2010: Average 7.4% 29% 6.1% 30% 27% 27% Real Estate 3.1% % of companies 20% 20% 16% 16% 12.2% Other Asset Class 4.1% 9% 10% 8% 7% 5% 4.0% 2% 1% 0% 0% 0% Cash 4.7% 0% % of total < 7% 7 to 7.5 to 8 to 8.5 to 9 to 9.5 to > 10% 7.5% 8% 8.5% 9% 9.5% 10% 0% 10% 20% 30% 40% 50% return assumption Source: NACUBO (National Association of College and University Business Officers), Towers Watson, Compustat/FactSet, J.P. Morgan Asset Management. Endowments represents dollar-weighted average data of 842 colleges and universities. Pension Return Assumptions based on all available and reported data from S&P 500 Index companies. Funded Status based on 351 companies reporting pension funding status as of 3/31/11. Return assumption bands are inclusive of upper range. All information is shown for illustrative purposes only. Data are as of 12/31/10. 62
  • 63.
    J.P. Morgan AssetManagement – Index Definitions All indexes are unmanaged and an individual cannot invest directly in an index. Index returns do not The MSCI ACWI (All Country World Index) Index is a free float-adjusted market capitalization weighted index include fees or expenses. that is designed to measure the equity market performance of developed and emerging markets. As of June 2009 the MSCI ACWI consisted of 45 country indices comprising 23 developed and 22 emerging market country indices. The S&P 500 Index is widely regarded as the best single gauge of the U.S. equities market. This world-renowned index includes a representative sample of 500 leading companies in leading industries of the U.S. economy. Although the S&P 500 Index focuses on the large-cap segment of the market, with approximately 75% coverage The MSCI Small Cap IndicesSM target 40% of the eligible Small Cap universe within each industry group, within of U.S. equities, it is also an ideal proxy for the total market. An investor cannot invest directly in an index. each country. MSCI defines the Small Cap universe as all listed securities that have a market capitalization in the range of USD200-1,500 million. The S&P 400 Mid Cap Index is representative of 400 stocks in the mid-range sector of the domestic stock market, representing all major industries. The MSCI Value and Growth IndicesSM cover the full range of developed, emerging and All Country MSCI Equity The Russell 3000 Index® measures the performance of the 3,000 largest U.S. companies based on total market indexes. As of the close of May 30, 2003, MSCI implemented an enhanced methodology for the MSCI Global capitalization. Value and Growth Indices, adopting a two dimensional framework for style segmentation in which value and growth securities are categorized using different attributes - three for value and five for growth including forward- The Russell 1000 Index ® measures the performance of the 1,000 largest companies in the Russell 3000. looking variables. The objective of the index design is to divide constituents of an underlying MSCI Standard Country Index into a value index and a growth index, each targeting 50% of the free float adjusted market The Russell 1000 Growth Index ® measures the performance of those Russell 1000 companies with higher capitalization of the underlying country index. Country Value/Growth indices are then aggregated into regional price-to-book ratios and higher forecasted growth values. Value/Growth indices. Prior to May 30, 2003, the indices used Price/Book Value (P/BV) ratios to divide the The Russell 1000 Value Index ® measures the performance of those Russell 1000 companies with lower price- standard MSCI country indices into value and growth indices. All securities were classified as either "value" to-book ratios and lower forecasted growth values. securities (low P/BV securities) or "growth" securities (high P/BV securities), relative to each MSCI country index. The Russell Midcap Index ® measures the performance of the 800 smallest companies in the Russell 1000 The following MSCI Total Return IndicesSM are calculated with gross dividends: Index. This series approximates the maximum possible dividend reinvestment. The amount reinvested is the dividend The Russell Midcap Growth Index ® measures the performance of those Russell Midcap companies with higher distributed to individuals resident in the country of the company, but does not include tax credits. price-to-book ratios and higher forecasted growth values. The stocks are also members of the Russell 1000 Growth index. The MSCI Europe IndexSM is a free float-adjusted market capitalization index that is designed to measure developed market equity performance in Europe. As of June 2007, the MSCI Europe Index consisted of the The Russell Midcap Value Index ® measures the performance of those Russell Midcap companies with lower following 16 developed market country indices: Austria, Belgium, Denmark, Finland, France, Germany, Greece, price-to-book ratios and lower forecasted growth values. The stocks are also members of the Russell 1000 Value Ireland, Italy, the Netherlands, Norway, Portugal, Spain, Sweden, Switzerland and the United Kingdom. index. The Russell 2000 Index ® measures the performance of the 2,000 smallest companies in the Russell 3000 The MSCI Pacific IndexSM is a free float-adjusted market capitalization index that is designed to measure equity Index. market performance in the Pacific region. As of June 2007, the MSCI Pacific Index consisted of the following 5 Developed Market countries: Australia, Hong Kong, Japan, New Zealand, and Singapore. The Russell 2000 Growth Index ® measures the performance of those Russell 2000 companies with higher price-to-book ratios and higher forecasted growth values. Credit Suisse/Tremont Hedge Fund Index is compiled by Credit Suisse Tremont Index, LLC. It is an asset- The Russell 2000 Value Index ® measures the performance of those Russell 2000 companies with lower price- weighted hedge fund index and includes only funds, as opposed to separate accounts. The Index uses the Credit to-book ratios and lower forecasted growth values. Suisse/Tremont database, which tracks over 4500 funds, and consists only of funds with a minimum of US$50 million under management, a 12-month track record, and audited financial statements. It is calculated and rebalanced on a monthly basis, and shown net of all performance fees and expenses. It is the exclusive property of The MSCI® EAFE (Europe, Australia, Far East) Net Index is recognized as the pre-eminent benchmark in the Credit Suisse Tremont Index, LLC. United States to measure international equity performance. It comprises 21 MSCI country indexes, representing the developed markets outside of North America. The NCREIF Property Index is a quarterly time series composite total rate of return measure of investment performance of a very large pool of individual commercial real estate properties acquired in the private market for The MSCI Emerging Markets IndexSM is a free float-adjusted market capitalization index that is designed to investment purposes only. All properties in the NPI have been acquired, at least in part, on behalf of tax-exempt measure equity market performance in the global emerging markets. As of June 2007, the MSCI Emerging institutional investors - the great majority being pension funds. As such, all properties are held in a fiduciary Markets Index consisted of the following 25 emerging market country indices: Argentina, Brazil, Chile, China, environment. Colombia, Czech Republic, Egypt, Hungary, India, Indonesia, Israel, Jordan, Korea, Malaysia, Mexico, Morocco, Pakistan, Peru, Philippines, Poland, Russia, South Africa, Taiwan, Thailand, and Turkey. The NAREIT EQUITY REIT Index is designed to provide the most comprehensive assessment of overall industry performance, and includes all tax-qualified real estate investment trusts (REITs) that are listed on the NYSE, the American Stock Exchange or the NASDAQ National Market List. 63
  • 64.
    J.P. Morgan AssetManagement – Index Definitions All indexes are unmanaged and an individual cannot invest directly in an index. Index returns do not The Barclays Capital Taxable Municipal Bond Index is a rules-based, market-value weighted index engineered include fees or expenses. for the long-term taxable bond market. To be included in the index, bonds must be rated investment-grade (Baa3/BBB- or higher) by at least two of the following ratings agencies if all three rate the bond: Moody's, S&P, The Dow Jones-UBS Commodity Index is composed of futures contracts on physical commodities and Fitch. If only two of the three agencies rate the security, the lower rating is used to determine index eligibility. If represents nineteen separate commodities traded on U.S. exchanges, with the exception of aluminum, nickel, and only one of the three agencies rates a security, the rating must be investment-grade. They must have an zinc. outstanding par value of at least $7 million and be issued as part of a transaction of at least $75 million. The bonds must be fixed rate and must be at least one year from their maturity date. Remarketed issues (unless coverted to The S&P GSCI Index is a composite index of commodity sector returns representing an unleveraged, long-only fixed rate), bonds with floating rates, and derivatives, are excluded from the benchmark. investment in commodity futures that is broadly diversified across the spectrum of commodities. The returns are Municipal Bond Index: To be included in the index, bonds must be rated investment-grade (Baa3/BBB- or higher) calculated on a fully collateralized basis with full reinvestment. Individual components qualify for inclusion in the by at least two of the following ratings agencies: Moody's, S&P, Fitch. If only two of the three agencies rate the index on the basis of liquidity and are weighted by their respective world production quantities. security, the lower rating is used to determine index eligibility. If only one of the three agencies rates a security, the rating must be investment-grade. They must have an outstanding par value of at least $7 million and be issued as The Barclays Capital U.S. Aggregate Index represents securities that are SEC-registered, taxable, and dollar part of a transaction of at least $75 million. The bonds must be fixed rate, have a dated-date after December 31, denominated. The index covers the U.S. investment grade fixed rate bond market, with index components for 1990, and must be at least one year from their maturity date. Remarketed issues, taxable municipal bonds, bonds government and corporate securities, mortgage pass-through securities, and asset-backed securities. These major with floating rates, and derivatives are excluded from the benchmark. sectors are subdivided into more specific indexes that are calculated and reported on a regular basis. This U.S. Treasury Index is a component of the U.S. Government index. The Barclays Capital Emerging Markets Index includes USD-denominated debt from emerging markets in the following regions: Americas, Europe, Middle East, Africa, and Asia. As with other fixed income benchmarks West Texas Intermediate (WTI) is the underlying commodity for the New York Mercantile Exchange's oil futures provided by Barclays Capital, the index is rules-based, which allows for an unbiased view of the marketplace and contracts. easy replicability. The Barclays Capital MBS Index covers the mortgage-backed pass-through securities of Ginnie Mae, Fannie The Barclays Capital High Yield Index covers the universe of fixed rate, non-investment grade debt. Pay-in-kind Mae, and Freddie Mac. Aggregate components must have a weighted average maturity of at least one year, must (PIK) bonds, Eurobonds, and debt issues from countries designated as emerging markets (e.g., Argentina, Brazil, have $250 million par amount outstanding, and must be fixed rate mortgages. Venezuela, etc.) are excluded, but Canadian and global bonds (SEC registered) of issuers in non-EMG countries are included. Original issue zeroes, step-up coupon structures, and 144-As are also included. The Barclays Capital Corporate Bond Index is the Corporate component of the U.S. Credit index. The Barclays Capital TIPS Index consists of Inflation-Protection securities issued by the U.S. Treasury. The Barclays Capital 1-3 Month U.S. Treasury Bill Index includes all publicly issued zero-coupon U.S. Treasury Bills that have a remaining maturity of less than 3 months and more than 1 month, are rated investment grade, and The J.P. Morgan EMBI Global Index includes U.S. dollar denominated Brady bonds, Eurobonds, traded loans have $250 million or more of outstanding face value. In addition, the securities must be denominated in U.S. and local market debt instruments issued by sovereign and quasi-sovereign entities. dollars and must be fixed rate and non convertible. The J.P. Morgan Domestic High Yield Index is designed to mirror the investable universe of the U.S. dollar domestic high yield corporate debt market. The Barclays Capital General Obligation Bond Index is a component of the Barclays Capital Municipal Bond Index. To be included in the index, bonds must be general obligation bonds rated investment-grade (Baa3/BBB- or The CS/Tremont Equity Market Neutral Index takes both long and short positions in stocks with the aim of higher) by at least two of the following ratings agencies: Moody's, S&P, Fitch. If only two of the three agencies rate minimizing exposure to the systematic risk of the market (i.e., a beta of zero). the security, the lower rating is used to determine index eligibility. If only one of the three agencies rates a security, the rating must be investment-grade. They must have an outstanding par value of at least $7 million and be issued The CS/Tremont Multi-Strategy Index consists of funds that allocate capital based on perceived opportunities as part of a transaction of at least $75 million. The bonds must be fixed rate, have a dated-date after December among several hedge fund strategies. Strategies adopted in a multi-strategy fund may include, but are not limited 31, 1990, and must be at least one year from their maturity date. Remarketed issues, taxable municipal bonds, to, convertible bond arbitrage, equity long/short, statistical arbitrage and merger arbitrage. bonds with floating rates, and derivatives, are excluded from the benchmark. *Market Neutral returns for November 2008 are estimates by J.P. Morgan Funds Market Strategy, and are based on a December 8, 2008 published estimate for November returns by CS/Tremont in which the Market Neutral The Barclays Capital Revenue Bond Index is a component of the Barclays Capital Municipal Bond Index. To be included in the index, bonds must be revenue bonds rated investment-grade (Baa3/BBB- or higher) by at least returns were estimated to be +0.85% (with 69% of all CS/Tremont constituents having reported return data). two of the following ratings agencies: Moody's, S&P, Fitch. If only two of the three agencies rate the security, the Presumed to be excluded from the November return are three funds, which were later marked to $0 by lower rating is used to determine index eligibility. If only one of the three agencies rates a security, the rating must CS/Tremont in connection with the Bernard Madoff scandal. J.P. Morgan Funds believes this distortion is not an be investment-grade. They must have an outstanding par value of at least $7 million and be issued as part of a accurate representation of returns in the category. CS/Tremont later published a finalized November return of - transaction of at least $75 million. The bonds must be fixed rate, have a dated-date after December 31, 1990, and 40.56% for the month, reflecting this mark-down. CS/Tremont assumes no responsibility for these estimates. must be at least one year from their maturity date. Remarketed issues, taxable municipal bonds, bonds with floating rates, and derivatives, are excluded from the benchmark. The Barclays High Yield Municipal Index includes bonds rated Ba1 or lower or non-rated bonds using the middle rating of Moody’s, S&P and Fitch. 64
  • 65.
    J.P. Morgan AssetManagement – Definitions, Risks & Disclosures Derivatives may be riskier than other types of investments because they may be more sensitive to changes in Past performance is no guarantee of comparable future results. economic or market conditions than other types of investments and could result in losses that significantly exceed the original investment. The use of derivatives may not be successful, resulting in investment losses, Diversification does not guarantee investment returns and does not eliminate the risk of loss. and the cost of such strategies may reduce investment returns. Bonds are subject to interest rate risks. Bond prices generally fall when interest rates rise. Price to forward earnings is a measure of the price-to-earnings ratio (P/E) using forecasted earnings. Price to The price of equity securities may rise, or fall because of changes in the broad market or changes in a company’s book value compares a stock's market value to its book value. Price to cash flow is a measure of the financial condition, sometimes rapidly or unpredictably. These price movements may result from factors affecting market's expectations of a firm's future financial health. Price to dividends is the ratio of the price of a share individual companies, sectors or industries, or the securities market as a whole, such as changes in economic or on a stock exchange to the dividends per share paid in the previous year, used as a measure of a company's political conditions. Equity securities are subject to “stock market risk” meaning that stock prices in general may potential as an investment. decline over short or extended periods of time. There is no guarantee that the use of long and short positions will succeed in limiting an investor's exposure Small-capitalization investing typically carries more risk than investing in well-established "blue-chip" companies to domestic stock market movements, capitalization, sector swings or other risk factors. Investing using long since smaller companies generally have a higher risk of failure. Historically, smaller companies' stock has and short selling strategies may have higher portfolio turnover rates. Short selling involves certain risks, experienced a greater degree of market volatility than the average stock. including additional costs associated with covering short positions and a possibility of unlimited loss on certain short sale positions. Mid-capitalization investing typically carries more risk than investing in well-established "blue-chip" companies. Historically, mid-cap companies' stock has experienced a greater degree of market volatility than the average Opinions and estimates offered constitute our judgment and are subject to change without notice, as are stock. statements of financial market trends, which are based on current market conditions. We believe the information provided here is reliable, but do not warrant its accuracy or completeness. This material is not Real estate investments may be subject to a higher degree of market risk because of concentration in a specific intended as an offer or solicitation for the purchase or sale of any financial instrument. The views and strategies industry, sector or geographical sector. Real estate investments may be subject to risks including, but not limited described may not be suitable for all investors. This material has been prepared for informational purposes to, declines in the value of real estate, risks related to general and economic conditions, changes in the value of only, and is not intended to provide, and should not be relied on for accounting, legal or tax advice. References the underlying property owned by the trust and defaults by borrower. to future returns are not promises or even estimates of actual returns a client portfolio may achieve. Any forecasts contained herein are for illustrative purposes only and are not to be relied upon as advice or International investing involves a greater degree of risk and increased volatility. Changes in currency exchange interpreted as a recommendation. rates and differences in accounting and taxation policies outside the U.S. can raise or lower returns. Also, some overseas markets may not be as politically and economically stable as the United States and other nations. The views expressed are those of J.P. Morgan Asset Management. They are subject to change at any time. Investments in emerging markets can be more volatile. As mentioned above, the normal risks of investing in These views do not necessarily reflect the opinions of any other firm. foreign countries are heightened when investing in emerging markets. In addition, the small size of securities markets and the low trading volume may lead to a lack of liquidity, which leads to increased volatility. Also, Contact JPMorgan Distribution Services, Inc. at 1-800-480-4111 for a fund prospectus. You emerging markets may not provide adequate legal protection for private or foreign investment or private property. can also visit us at www.jpmorganfunds.com. Investors should carefully consider the investment objectives and risks as well as charges and expenses of the mutual fund before Investments in commodities may have greater volatility than investments in traditional securities, particularly if investing. The prospectus contains this and other information about the mutual fund. Read the instruments involve leverage. The value of commodity-linked derivative instruments may be affected by changes in overall market movements, commodity index volatility, changes in interest rates, or factors affecting a the prospectus carefully before investing. particular industry or commodity, such as drought, floods, weather, livestock disease, embargoes, tariffs and J.P. Morgan Asset Management is the marketing name for the asset management businesses of JPMorgan international economic, political and regulatory developments. Use of leveraged commodity-linked derivatives Chase & Co. Those businesses include, but are not limited to, J.P. Morgan Investment Management Inc., creates an opportunity for increased return but, at the same time, creates the possibility for greater loss. Security Capital Research & Management Incorporated and J.P. Morgan Alternative Asset Management, Inc. JPMorgan Distribution Services, Inc., member FINRA/SIPC. Can’t find a slide? © JPMorgan Chase & Co., April 2012. Please visit www.jpmorganfunds.com/bench Unless otherwise stated, all data are as of March 31, 2012 or most recently available. to access slides from previous editions that are now “on the bench”. Prepared by: Andrew D. Goldberg, Joseph S. Tanious, Andrés Garcia-Amaya, David M. Lebovitz, Brandon D. Odenath and David Kelly. NOT FDIC INSURED ı NO BANK GUARANTEE ı MAY LOSE VALUE JP-LITTLEBOOK 65