Download as PDF, PPTX


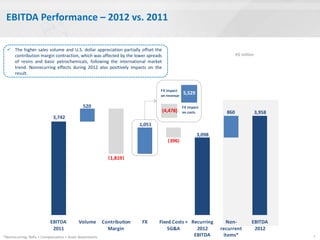

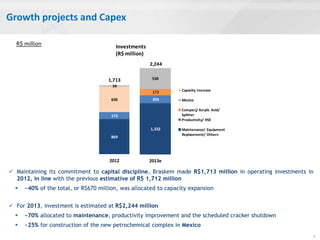


Braskem reported financial results for 4Q12 and full year 2012. For 4Q12, Braskem's EBITDA was R$1.4 billion including gains from asset sales, and net revenue was R$9.2 billion. For 2012, Braskem's EBITDA was R$4 billion including non-recurring items, and the company expanded its market share in Brazil to 71% on thermoplastic resin sales of 3.5 million tons. Braskem also made progress on projects in Mexico and Comperj while maintaining its commitment to financial health.


