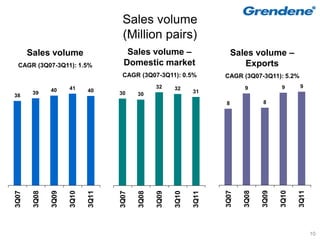
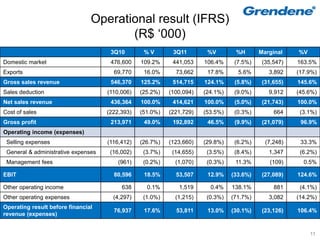
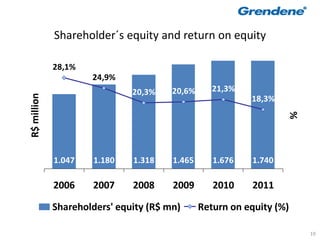
3Q11
November 2011
Disclaimer
This presentation contains statements that can represent expectations about
future events or results, These statements are based on certain suppositions
and analyses made by the company in accordance with its experience, with
the economic environment and market conditions, and expected future
developments, many of which are beyond the company’s control, Important
factors could lead to significant differences between real results and the
statements on expectations about future events or results, including the
company’s business strategy, Brazilian and international economic conditions,
technology, financial strategy, developments in the footwear industry,
conditions of the financial market, and uncertainty on the company’s future
results from operations, plans, objectives, expectations and intentions –
among other factors, In view of these aspects, the company’s results could
differ significantly from those indicated or implicit in any statements of
expectations about future events or results,
                                                                                2   2
Agenda
Results
Guidance


                    3
Results (in IFRS)


                    4
Main financial and economic indicators
R$ million               3Q10           3Q10           Var. % 3Q10-3Q11
Net sales revenue               214.0          192.9               (9.9%)
Net income                      104.8           83.5              (20.3%)

Margin %                 3Q10           3Q11               Var. p.p.
Gross                        49.0%          46.5%                        2.5
EBIT                         18.5%          12.9%                      (5.6)
EBITDA                       20.1%          14.6%                      (5.5)
Net                          24.0%          20.1%                      (3.9)


                                                                               5
Gross sales revenue (IFRS)
                                   (R$ million)
Gross sales revenue                Gross sales revenue                Gross sales revenue
  CAGR (3Q07-3Q11): 5.6%            Domestic market                        Exports
                                    CAGR (3Q07-3Q11): 5.0%             CAGR (3Q7-3Q11): 9.6%

                     546                                                                           74
                            515                                               68            70
              476                                       477
       458                                                     441
414                                              422
                                          390                                        54
                                                                       51
                                   363
3Q07

       3Q08

              3Q09

                     3Q10

                            3Q11


                                                                       3Q07

                                                                              3Q08

                                                                                     3Q09

                                                                                            3Q10

                                                                                                   3Q11
                                   3Q07

                                          3Q08

                                                 3Q09

                                                        3Q10

                                                               3Q11


                                                                                                          6
Market %


       Gross sales revenue                       Sales volume
12,3% 14,8% 11,3% 12,8% 14,3%          20,1% 23,4% 19,2% 22,4% 23,2%


87,7% 85,2% 88,7% 87,2% 85,7%          79,9% 76,6% 80,8% 77,6% 76,8%


3Q07     3Q08   3Q09     3Q10   3Q11   3Q07     3Q08   3Q09     3Q10   3Q11
       Domestic market     Exports            Domestic market     Exports


                                                                              7
Results (IFRS)
                                     (R$ million)
Gross profit / Gross margin                           EBIT / EBIT margin
         CAGR (3Q07-3Q11): 6.1%                       CAGR (3Q07-3Q11): (0.9%)


                                                                      81
                            214
                                    193
                                                       63
            166
 152                149                        56                             54
                            49,0%
 46,4%     46,0%                    46,5%
                    39,7%
                                                      17,5%
                                                              36     18,5%
                                              16,9%

                                                                             12,9%
                                                              9,5%


                                               3Q07

                                                       3Q08

                                                              3Q09

                                                                      3Q10

                                                                              3Q11
  3Q07

             3Q08

                     3Q09

                             3Q10

                                     3Q11


                                                                                     8
Results (IFRS)
                                 (R$ million)
   EBITDA / EBITDA margin                  Net income / Net margin
        CAGR (3Q07-3Q11): (0.7%)                  CAGR (3Q07-3Q11): 1.2%


                         88                                         105


         69                                                                  84
                                           80
 62                                61                73
                                                             66
                                          24,3%                     24,0%

                 42     20,1%                       20,3%                   20,1%
19,0%   19,2%
                                                            17,5%
                                 14,6%
                11,3%


                                           3Q07

                                                     3Q08

                                                             3Q09

                                                                     3Q10

                                                                             3Q11
 3Q07

         3Q08

                 3Q09

                         3Q10

                                   3Q11


                                                                                    9
Sales volume
                                     (Million pairs)
       Sales volume                    Sales volume –                      Sales volume –
 CAGR (3Q07-3Q11): 1.5%               Domestic market                         Exports
                                     CAGR (3Q07-3Q11): 0.5%            CAGR (3Q07-3Q11): 5.2%
                      41                          32     32                   9             9      9
               40            40                                 31
        39                          30     30
38
                                                                       8             8


                                                                       3Q07

                                                                              3Q08

                                                                                     3Q09

                                                                                            3Q10

                                                                                                   3Q11
3Q07

        3Q08

               3Q09

                      3Q10

                             3Q11


                                    3Q07

                                           3Q08

                                                  3Q09

                                                         3Q10

                                                                3Q11


                                                                                                          10
Operational result (IFRS)
                                       (R$ ‘000)
                                      3Q10        %V        3Q11        %V        %H       Marginal    %V
Domestic market                       476,600    109.2%     441,053    106.4%     (7.5%)    (35,547)   163.5%
Exports                                69,770     16.0%      73,662     17.8%      5.6%       3,892    (17.9%)
Gross sales revenue                   546,370    125.2%     514,715    124.1%     (5.8%)    (31,655)   145.6%
Sales deduction                      (110,006)   (25.2%)   (100,094)   (24.1%)    (9.0%)      9,912    (45.6%)
Net sales revenue                     436,364    100.0%     414,621    100.0%     (5.0%)    (21,743)   100.0%
Cost of sales                        (222,393)   (51.0%)   (221,729)   (53.5%)    (0.3%)        664     (3.1%)
Gross profit                          213,971     49.0%     192,892     46.5%     (9.9%)    (21,079)    96.9%
Operating income (expenses)
 Selling expenses                    (116,412)   (26.7%)   (123,660)   (29.8%)    (6.2%)     (7,248)    33.3%
 General & administrative expenses    (16,002)    (3.7%)    (14,655)    (3.5%)    (8.4%)      1,347     (6.2%)
 Management fees                         (961)    (0.2%)     (1,070)    (0.3%)    11.3%       (109)      0.5%

EBIT                                   80,596     18.5%      53,507     12.9%    (33.6%)    (27,089)   124.6%

Other operating income                    638      0.1%       1,519      0.4%    138.1%         881     (4.1%)
Other operating expenses               (4,297)    (1.0%)     (1,215)    (0.3%)   (71.7%)      3,082    (14.2%)
Operating result before financial
                                       76,937     17.6%      53,811     13.0%    (30.1%)    (23,126)   106.4%
revenue (expenses)


                                                                                                            11
9M11


       12
Main financial and economic indicators
R$ million                           9M10            9M11         Var. % 9M10-9M11
Net sales revenue                       1,116.4             975.7            (12.6%)
Net income                                189.7             183.9             (3.1%)

Margin %                             9M10            9M11              Var. p.p.
Gross                                    37.7%           40.8%                       3.1
EBIT                                     10.2%            9.5%                     (0.7)
EBITDA                                   12.1%           11.7%                     (0.4)
Net                                      17.0%           18.8%                       1.8

Share                                             2010                 9M11
Profit per share R$                                  R$1.0388              R$0.6115
Share price (Dec. 31 – Sep. 30) R$                      R$9.32                R$7.75
Book value per share R$                                 R$5.57                R$5.79
Market cap (R$)                             R$2,802,710,400.00    R$2,330,580,000.00

                                                                                           13
Gross sales revenue (IFRS)
                                      (R$ million)
Gross sales revenue                    Gross sales revenue – Gross sales revenue -
 CAGR (9M10-9M11): 5.4%                  Domestic market           Exports
                                         CAGR (9M10-9M11): 5.0%             CAGR (9M10-9M11): 7.0%
                                                             1.125
                                                                                                 269
                       1.394
                                                      973            995                  245
               1.219           1.221                                                                    227
                                               867
                                        818                                        209
       1.076
991
                                                                            173
9M07

        9M08

                9M09

                        9M10

                                9M11


                                                                            9M07

                                                                                   9M08

                                                                                          9M09

                                                                                                 9M10

                                                                                                        9M11
                                        9M07

                                               9M08

                                                      9M09

                                                              9M10

                                                                     9M11


                                                                                                               14
Market %


  Receita bruta de vendas                  Volume de pares
14,9% 19,4% 20,1% 19,3% 18,6%
                                   23,9%
                                           33,3% 29,2% 33,8% 29,8%


82,6% 80,6% 79,9% 80,7% 81,4%
                                   71,4%
                                           66,7% 70,8% 66,2% 70,2%


9M07 9M08 9M09 9M10 9M11           9M07 9M08 9M09 9M10 9M11
     M.Interno   Exportação                M.Interno   Exportação


                                                                     15
Results (IFRS)
                                     (R$ million)
Gross profit / Gross margin                           EBIT / EBIT margin
         CAGR (9M07-9M11): 6,1%                       CAGR (9M07-9M11): 0,8%


                            421                                       114
                                    398
                    375                                        97
                                                       94                      93
            336                                90
 315


 40,1%     39,8%                    40,8%
                    38,5%   37,7%


                                              11,5%   11,2%
                                                              10,0%   10,2%   9,5%


                                               9M07

                                                       9M08

                                                               9M09

                                                                       9M10

                                                                               9M11
  9M07

             9M08

                     9M09

                             9M10

                                     9M11


                                                                                      16
Results (IFRS)
                                 (R$ million)
   EBITDA / EBITDA margin                  Net income / Net margin
        CAGR (9M07-9M11): 0.8%                    CAGR (9M07-9M11): 3.4%


                                                            187     190     184
                        135
                                          161       157
        113     117              114
111


                                          20,5%
                                                    18,6%   19,2%           18,8%
                                                                    17,0%
14,2%   13,4%
                12,0%   12,1%    11,7%


                                           9M07

                                                     9M08

                                                             9M09

                                                                     9M10

                                                                             9M11
 9M07

         9M08

                 9M09

                         9M10

                                  9M11


                                                                                    17
Sales volume
                                     (Million pairs)
       Sales volume                    Sales volume –                    Sales volume –
 CAGR (9M07-9M11): 1.3%               Domestic market                       Exports
                                     CAGR (9M07-9M11): 0.9%            CAGR (9M07-9M11): 2.3%

                                                         80                                 41
                      120                         76
               108                         69                   70            35
       104                          68
                             100                                                     32
95                                                                                                 30
                                                                       27


                                                                       9M07

                                                                              9M08

                                                                                     9M09

                                                                                            9M10

                                                                                                   9M11
9M07

        9M08

               9M09

                      9M10

                             9M11


                                    9M07

                                           9M08

                                                  9M09

                                                         9M10

                                                                9M11


                                                                                                          18
Shareholder´s equity and return on equity

             28,1%
                     24,9%
                              20,3%    20,6%      21,3%
                                                          18,3%
R$ million


                                                                  %
             1.047   1.180    1.318    1.465      1.676   1.740

             2006    2007     2008     2009       2010    2011

             Shareholders' equity (R$ mn)      Return on equity (%)

                                                                      19
Operational result (IFRS)
                                       (R$ ‘000)
                                      9M10        %V        9M11        %V        %H       Marginal    %V
Domestic market                      1,125,162   100.8%     994,752    102.0%    (11.6%)   (130,410)    92.7%
Exports                               268,840     24.1%     226,556     23.2%    (15.7%)    (42,284)    30.1%
Gross sales revenue                  1,394,002   124.9%    1,221,308   125.2%    (12.4%)   (172,694)   122.8%
Sales deduction                      (277,623)   (24.9%)   (245,583)   (25.2%)   (11.5%)     32,040    (22.8%)
Net sales revenue                    1,116,379   100.0%     975,725    100.0%    (12.6%)   (140,654)   100.0%
Cost of sales                        (695,609)   (62.3%)   (577,467)   (59.2%)   (17.0%)    118,142    (84.0%)
Gross profit                          420,770     37.7%     398,258     40.8%     (5.4%)    (22,512)    16.0%
Operating income (expenses)
 Selling expenses                    (262,355)   (23.5%)   (260,766)   (26.7%)    (0.6%)      1,589     (1.1%)
 General & administrative expenses    (42,216)    (3.8%)    (41,473)    (4.3%)    (1.8%)        743     (0.5%)
 Management fees                       (1,978)    (0.2%)     (3,082)    (0.3%)    55.8%      (1,104)     0.8%

EBIT                                  114,221     10.2%      92,937      9.5%    (18.6%)    (21,284)    15.1%

Other operating income                  2,639      0.2%       5,327      0.5%    101.9%       2,688     (1.9%)
Other operating expenses               (5,311)    (0.5%)     (2,837)    (0.3%)   (46.6%)     (2,474)    (1.8%)
Operating result before financial
                                      111,549     10.0%      95,427      9.8%    (14.5%)    (16,122)    11.5%
revenue (expenses)


                                                                                                            20
Net cash, cash and cash equivalents
                     and debt
                                                          1.151       1.184
                                                                                 1.119
                                              1.031
              860        845        859                               1.021
                                                          983                     942
                                    815        852
                         793
R$ milion


              756


             (104)       (52)       (45)
                                              (178)       (167)       (164)      (177)

            31/03/10   30/06/10   30/09/10   31/12/10   31/03/11     30/06/11   30/09/11
                         Cash and cash equivalents      Debt       Net cash

                                     Strong cash flow
                                                                                           21
Dividends
                                                                   R$ 0,4400
        R$ 0,3991                                    R$ 0,4048
                      R$ 0,3633      R$ 0,3667                       74,9%


          46,0%          45,5%
  R$


                                         40,4%


                                                                               %
                                                       38,9%


           4,9%          6,7%            5,8%          4,7%          6,8%


           2007          2008            2009          2010          9M11

              Dividendo per share (R$)     Dividend yield (%)    Payout (%)

Dividend yield: Profit per share divided by average value of the share in the year.
                                                                                      22
Low need for Capex
             40
                                 35
             35                         33

             30                                        27
                           24                   24
             25
R$ million


                  20
             20
             15
             10
             5
             0
                  2007    2008   2009   2010   9M10   9M11


                                                             23
Perspectivas
                                         Targets for:
                                   2009 – 2013 / 2011-2015
                          Growth of gross revenue at a CAGR
                          between 8% and 12% in the five years.
                          Growth of net profit at a CAGR between
                          12 and 15% in the five years.
                          Advertising expenses: average: 8% - 10%
                          of net revenue in this period.

Our view is that, in this period, we may have years with greater
growth that these rates, as was the case in 2009, and others with
less growth, but on average we intend to meet this target.
                                                                    24
Thank You!
                        Francisco Schmitt
                    Investor Relations Officer
                   schmitt@grendene.com.br                40 years old
                        (5554) 2109.9022

                         Cátia Gastmann
                            Secretary
                    catia@grendene.com.br
                       (5554) 2109.9011


                      Further information
Internet: http://ri.grendene.com.br / Email: dri@grendene.com.br

                                                                         25

Grendene - 3Q11 Results

  • 1.
  • 2.
    Disclaimer This presentation containsstatements that can represent expectations about future events or results, These statements are based on certain suppositions and analyses made by the company in accordance with its experience, with the economic environment and market conditions, and expected future developments, many of which are beyond the company’s control, Important factors could lead to significant differences between real results and the statements on expectations about future events or results, including the company’s business strategy, Brazilian and international economic conditions, technology, financial strategy, developments in the footwear industry, conditions of the financial market, and uncertainty on the company’s future results from operations, plans, objectives, expectations and intentions – among other factors, In view of these aspects, the company’s results could differ significantly from those indicated or implicit in any statements of expectations about future events or results, 2 2
  • 3.
  • 4.
  • 5.
    Main financial andeconomic indicators R$ million 3Q10 3Q10 Var. % 3Q10-3Q11 Net sales revenue 214.0 192.9 (9.9%) Net income 104.8 83.5 (20.3%) Margin % 3Q10 3Q11 Var. p.p. Gross 49.0% 46.5% 2.5 EBIT 18.5% 12.9% (5.6) EBITDA 20.1% 14.6% (5.5) Net 24.0% 20.1% (3.9) 5
  • 6.
    Gross sales revenue(IFRS) (R$ million) Gross sales revenue Gross sales revenue Gross sales revenue CAGR (3Q07-3Q11): 5.6% Domestic market Exports CAGR (3Q07-3Q11): 5.0% CAGR (3Q7-3Q11): 9.6% 546 74 515 68 70 476 477 458 441 414 422 390 54 51 363 3Q07 3Q08 3Q09 3Q10 3Q11 3Q07 3Q08 3Q09 3Q10 3Q11 3Q07 3Q08 3Q09 3Q10 3Q11 6
  • 7.
    Market % Gross sales revenue Sales volume 12,3% 14,8% 11,3% 12,8% 14,3% 20,1% 23,4% 19,2% 22,4% 23,2% 87,7% 85,2% 88,7% 87,2% 85,7% 79,9% 76,6% 80,8% 77,6% 76,8% 3Q07 3Q08 3Q09 3Q10 3Q11 3Q07 3Q08 3Q09 3Q10 3Q11 Domestic market Exports Domestic market Exports 7
  • 8.
    Results (IFRS) (R$ million) Gross profit / Gross margin EBIT / EBIT margin CAGR (3Q07-3Q11): 6.1% CAGR (3Q07-3Q11): (0.9%) 81 214 193 63 166 152 149 56 54 49,0% 46,4% 46,0% 46,5% 39,7% 17,5% 36 18,5% 16,9% 12,9% 9,5% 3Q07 3Q08 3Q09 3Q10 3Q11 3Q07 3Q08 3Q09 3Q10 3Q11 8
  • 9.
    Results (IFRS) (R$ million) EBITDA / EBITDA margin Net income / Net margin CAGR (3Q07-3Q11): (0.7%) CAGR (3Q07-3Q11): 1.2% 88 105 69 84 80 62 61 73 66 24,3% 24,0% 42 20,1% 20,3% 20,1% 19,0% 19,2% 17,5% 14,6% 11,3% 3Q07 3Q08 3Q09 3Q10 3Q11 3Q07 3Q08 3Q09 3Q10 3Q11 9
  • 10.
    Sales volume (Million pairs) Sales volume Sales volume – Sales volume – CAGR (3Q07-3Q11): 1.5% Domestic market Exports CAGR (3Q07-3Q11): 0.5% CAGR (3Q07-3Q11): 5.2% 41 32 32 9 9 9 40 40 31 39 30 30 38 8 8 3Q07 3Q08 3Q09 3Q10 3Q11 3Q07 3Q08 3Q09 3Q10 3Q11 3Q07 3Q08 3Q09 3Q10 3Q11 10
  • 11.
    Operational result (IFRS) (R$ ‘000) 3Q10 %V 3Q11 %V %H Marginal %V Domestic market 476,600 109.2% 441,053 106.4% (7.5%) (35,547) 163.5% Exports 69,770 16.0% 73,662 17.8% 5.6% 3,892 (17.9%) Gross sales revenue 546,370 125.2% 514,715 124.1% (5.8%) (31,655) 145.6% Sales deduction (110,006) (25.2%) (100,094) (24.1%) (9.0%) 9,912 (45.6%) Net sales revenue 436,364 100.0% 414,621 100.0% (5.0%) (21,743) 100.0% Cost of sales (222,393) (51.0%) (221,729) (53.5%) (0.3%) 664 (3.1%) Gross profit 213,971 49.0% 192,892 46.5% (9.9%) (21,079) 96.9% Operating income (expenses) Selling expenses (116,412) (26.7%) (123,660) (29.8%) (6.2%) (7,248) 33.3% General & administrative expenses (16,002) (3.7%) (14,655) (3.5%) (8.4%) 1,347 (6.2%) Management fees (961) (0.2%) (1,070) (0.3%) 11.3% (109) 0.5% EBIT 80,596 18.5% 53,507 12.9% (33.6%) (27,089) 124.6% Other operating income 638 0.1% 1,519 0.4% 138.1% 881 (4.1%) Other operating expenses (4,297) (1.0%) (1,215) (0.3%) (71.7%) 3,082 (14.2%) Operating result before financial 76,937 17.6% 53,811 13.0% (30.1%) (23,126) 106.4% revenue (expenses) 11
  • 12.
  • 13.
    Main financial andeconomic indicators R$ million 9M10 9M11 Var. % 9M10-9M11 Net sales revenue 1,116.4 975.7 (12.6%) Net income 189.7 183.9 (3.1%) Margin % 9M10 9M11 Var. p.p. Gross 37.7% 40.8% 3.1 EBIT 10.2% 9.5% (0.7) EBITDA 12.1% 11.7% (0.4) Net 17.0% 18.8% 1.8 Share 2010 9M11 Profit per share R$ R$1.0388 R$0.6115 Share price (Dec. 31 – Sep. 30) R$ R$9.32 R$7.75 Book value per share R$ R$5.57 R$5.79 Market cap (R$) R$2,802,710,400.00 R$2,330,580,000.00 13
  • 14.
    Gross sales revenue(IFRS) (R$ million) Gross sales revenue Gross sales revenue – Gross sales revenue - CAGR (9M10-9M11): 5.4% Domestic market Exports CAGR (9M10-9M11): 5.0% CAGR (9M10-9M11): 7.0% 1.125 269 1.394 973 995 245 1.219 1.221 227 867 818 209 1.076 991 173 9M07 9M08 9M09 9M10 9M11 9M07 9M08 9M09 9M10 9M11 9M07 9M08 9M09 9M10 9M11 14
  • 15.
    Market % Receita bruta de vendas Volume de pares 14,9% 19,4% 20,1% 19,3% 18,6% 23,9% 33,3% 29,2% 33,8% 29,8% 82,6% 80,6% 79,9% 80,7% 81,4% 71,4% 66,7% 70,8% 66,2% 70,2% 9M07 9M08 9M09 9M10 9M11 9M07 9M08 9M09 9M10 9M11 M.Interno Exportação M.Interno Exportação 15
  • 16.
    Results (IFRS) (R$ million) Gross profit / Gross margin EBIT / EBIT margin CAGR (9M07-9M11): 6,1% CAGR (9M07-9M11): 0,8% 421 114 398 375 97 94 93 336 90 315 40,1% 39,8% 40,8% 38,5% 37,7% 11,5% 11,2% 10,0% 10,2% 9,5% 9M07 9M08 9M09 9M10 9M11 9M07 9M08 9M09 9M10 9M11 16
  • 17.
    Results (IFRS) (R$ million) EBITDA / EBITDA margin Net income / Net margin CAGR (9M07-9M11): 0.8% CAGR (9M07-9M11): 3.4% 187 190 184 135 161 157 113 117 114 111 20,5% 18,6% 19,2% 18,8% 17,0% 14,2% 13,4% 12,0% 12,1% 11,7% 9M07 9M08 9M09 9M10 9M11 9M07 9M08 9M09 9M10 9M11 17
  • 18.
    Sales volume (Million pairs) Sales volume Sales volume – Sales volume – CAGR (9M07-9M11): 1.3% Domestic market Exports CAGR (9M07-9M11): 0.9% CAGR (9M07-9M11): 2.3% 80 41 120 76 108 69 70 35 104 68 100 32 95 30 27 9M07 9M08 9M09 9M10 9M11 9M07 9M08 9M09 9M10 9M11 9M07 9M08 9M09 9M10 9M11 18
  • 19.
    Shareholder´s equity andreturn on equity 28,1% 24,9% 20,3% 20,6% 21,3% 18,3% R$ million % 1.047 1.180 1.318 1.465 1.676 1.740 2006 2007 2008 2009 2010 2011 Shareholders' equity (R$ mn) Return on equity (%) 19
  • 20.
    Operational result (IFRS) (R$ ‘000) 9M10 %V 9M11 %V %H Marginal %V Domestic market 1,125,162 100.8% 994,752 102.0% (11.6%) (130,410) 92.7% Exports 268,840 24.1% 226,556 23.2% (15.7%) (42,284) 30.1% Gross sales revenue 1,394,002 124.9% 1,221,308 125.2% (12.4%) (172,694) 122.8% Sales deduction (277,623) (24.9%) (245,583) (25.2%) (11.5%) 32,040 (22.8%) Net sales revenue 1,116,379 100.0% 975,725 100.0% (12.6%) (140,654) 100.0% Cost of sales (695,609) (62.3%) (577,467) (59.2%) (17.0%) 118,142 (84.0%) Gross profit 420,770 37.7% 398,258 40.8% (5.4%) (22,512) 16.0% Operating income (expenses) Selling expenses (262,355) (23.5%) (260,766) (26.7%) (0.6%) 1,589 (1.1%) General & administrative expenses (42,216) (3.8%) (41,473) (4.3%) (1.8%) 743 (0.5%) Management fees (1,978) (0.2%) (3,082) (0.3%) 55.8% (1,104) 0.8% EBIT 114,221 10.2% 92,937 9.5% (18.6%) (21,284) 15.1% Other operating income 2,639 0.2% 5,327 0.5% 101.9% 2,688 (1.9%) Other operating expenses (5,311) (0.5%) (2,837) (0.3%) (46.6%) (2,474) (1.8%) Operating result before financial 111,549 10.0% 95,427 9.8% (14.5%) (16,122) 11.5% revenue (expenses) 20
  • 21.
    Net cash, cashand cash equivalents and debt 1.151 1.184 1.119 1.031 860 845 859 1.021 983 942 815 852 793 R$ milion 756 (104) (52) (45) (178) (167) (164) (177) 31/03/10 30/06/10 30/09/10 31/12/10 31/03/11 30/06/11 30/09/11 Cash and cash equivalents Debt Net cash Strong cash flow 21
  • 22.
    Dividends R$ 0,4400 R$ 0,3991 R$ 0,4048 R$ 0,3633 R$ 0,3667 74,9% 46,0% 45,5% R$ 40,4% % 38,9% 4,9% 6,7% 5,8% 4,7% 6,8% 2007 2008 2009 2010 9M11 Dividendo per share (R$) Dividend yield (%) Payout (%) Dividend yield: Profit per share divided by average value of the share in the year. 22
  • 23.
    Low need forCapex 40 35 35 33 30 27 24 24 25 R$ million 20 20 15 10 5 0 2007 2008 2009 2010 9M10 9M11 23
  • 24.
    Perspectivas Targets for: 2009 – 2013 / 2011-2015 Growth of gross revenue at a CAGR between 8% and 12% in the five years. Growth of net profit at a CAGR between 12 and 15% in the five years. Advertising expenses: average: 8% - 10% of net revenue in this period. Our view is that, in this period, we may have years with greater growth that these rates, as was the case in 2009, and others with less growth, but on average we intend to meet this target. 24
  • 25.
    Thank You! Francisco Schmitt Investor Relations Officer schmitt@grendene.com.br 40 years old (5554) 2109.9022 Cátia Gastmann Secretary catia@grendene.com.br (5554) 2109.9011 Further information Internet: http://ri.grendene.com.br / Email: dri@grendene.com.br 25