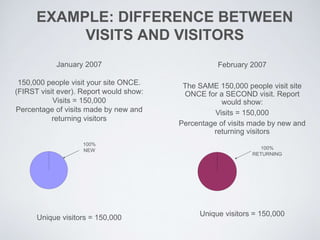
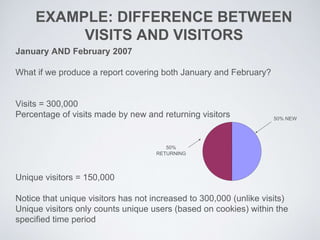
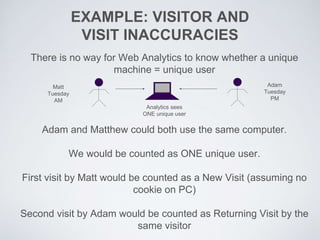
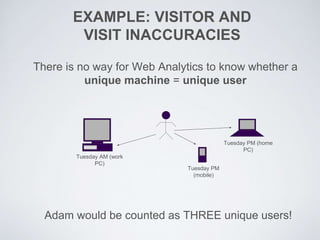
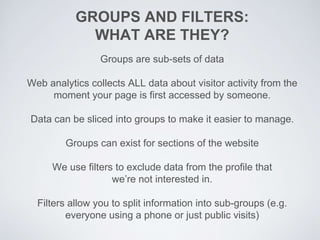
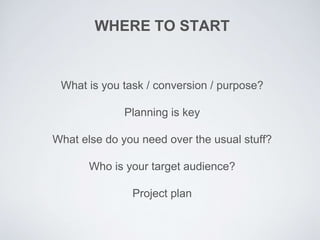
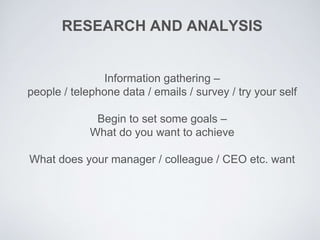
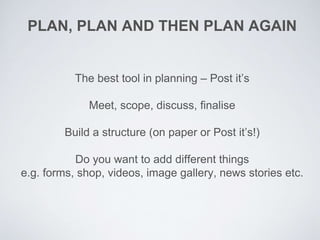
UNDERSTANDING
WEB ANALYTICS
ITS VIDEO TIME
Web Analytics for Beginners
https://www.youtube.com/watch?v=PnVZ7_OA7Qo
WHY MIGHT YOU USE WEB ANALYTICS?
Web analytics won’t give you straight answers - it will help
YOU analyse your content and make better decisions.
For example:
How long do you/your colleagues spend creating and
updating web content?
Is this investment worth while?
Which content is most popular?
How successful are marketing campaigns
Did your press advertisements drive people to your page
How many people responded?
Where are your visits coming from?
METRICS – WHAT DO THEY MEAN?
Hits – “How Idiots Track Success”
These refer to every type of file on the website – including images,
video, audio. Therefore, a single page will contain many hits.
Never use hits to measure web usage.
Visits
Number of visits to this page by any number of unique
computers / internet-enabled devices.
A visit is a series of actions that begins when a visitor views the first
page from the server, and ends when the visitor leaves the site or
remains idle beyond the idle-time limit (30 min).
Views
Number of times this page was viewed by visitors
Visitors
Individual computers/devices that have accessed our website.
Unique visitors are monitored by ‘cookies’ which are
issued to the device.
Cookies are issues for 10 years. If someone deletes a cookie, or
the cookie expires then the machine (person) will be treated
as a new visitor.
Visitors is a measure relating to unique machines NOT people.
METRICS – WHAT DO THEY MEAN?
Visitors
Not all visitors have a person behind the device!
Spiders, crawlers, robots etc
These are automated programs that scan the web by following links
These consists of:
the Good: search engine spiders (eg GoogleBot) which indexes pages
the Bad: crawlers that steal email addresses for spamming
the Ugly: they would affect your web statistics – but are blocked
Many people misunderstand the various metrics,
and as a result the terms are often confused.
Let’s look at some examples…
METRICS – WHAT DO THEY MEAN?
EXAMPLE: DIFFERENCE BETWEEN
VISITS AND VISITORS
January 2007
150,000 people visit your site ONCE.
(FIRST visit ever). Report would show:
Visits = 150,000
Percentage of visits made by new and
returning visitors
Unique visitors = 150,000
February 2007
The SAME 150,000 people visit site
ONCE for a SECOND visit. Report
would show:
Visits = 150,000
Percentage of visits made by new and
returning visitors
Unique visitors = 150,000
100%
NEW 100%
RETURNING
EXAMPLE: DIFFERENCE BETWEEN
VISITS AND VISITORS
January AND February 2007
What if we produce a report covering both January and February?
Visits = 300,000
Percentage of visits made by new and returning visitors
Unique visitors = 150,000
Notice that unique visitors has not increased to 300,000 (unlike visits)
Unique visitors only counts unique users (based on cookies) within the
specified time period
50% NEW
50%
RETURNING
EXAMPLE: VISITOR AND
VISIT INACCURACIES
There is no way for Web Analytics to know whether a unique
machine = unique user
Adam and Matthew could both use the same computer.
We would be counted as ONE unique user.
First visit by Matt would be counted as a New Visit (assuming no
cookie on PC)
Second visit by Adam would be counted as Returning Visit by the
same visitor
Matt
Tuesday
AM
Adam
Tuesday
PM
Analytics sees
ONE unique user
EXAMPLE: VISITOR AND
VISIT INACCURACIES
There is no way for Web Analytics to know whether a
unique machine = unique user
Adam would be counted as THREE unique users!
Tuesday AM (work
PC)
Tuesday PM
(mobile)
Tuesday PM (home
PC)
EXAMPLE: VISITOR AND
VISIT INACCURACIES
People delete cookies
People block cookies
Cookies expire
Therefore, beware taking the figures as 100%
accurate, but trends can be useful
GROUPS AND FILTERS:
WHAT ARE THEY?
Groups are sub-sets of data
Web analytics collects ALL data about visitor activity from the
moment your page is first accessed by someone.
Data can be sliced into groups to make it easier to manage.
Groups can exist for sections of the website
We use filters to exclude data from the profile that
we’re not interested in.
Filters allow you to split information into sub-groups (e.g.
everyone using a phone or just public visits)
ITS VIDEO TIME
Funny Web Analytics Commercial
https://www.youtube.com/watch?v=6VuxmB07Em0
DESIGN CHANGES
WHERE TO START
What is you task / conversion / purpose?
Planning is key
What else do you need over the usual stuff?
Who is your target audience?
Project plan
RESEARCH AND ANALYSIS
Information gathering –
people / telephone data / emails / survey / try your self
Begin to set some goals –
What do you want to achieve
What does your manager / colleague / CEO etc. want
PLAN, PLAN AND THEN PLAN AGAIN
The best tool in planning – Post it’s
Meet, scope, discuss, finalise
Build a structure (on paper or Post it’s!)
Do you want to add different things
e.g. forms, shop, videos, image gallery, news stories etc.
DESIGN AND DEVELOP
Now you know what you want, what do you need to do it?
Visual look and feel
Create mock ups / plans
Always think about the end user
Usability and Accessibility
SELECT THE GREEN
BOX TO CONTINUE
CONTENT
Use the right text –
Plain English, check for misspellings, broken links etc.
Use all features available - would a video guide be better?
Are images needed?
Remember SEO (Search Engine Optimisation)
ITS VIDEO TIME
Can People Explain Intangible Concepts
https://www.youtube.com/watch?v=NGYLAKYNVX8
BUILD AND DEVELOPMENT
Always think about the end user
Usability and Accessibility
Responsive design
Don’t make it live when it is built
TEST, TEST AND THEN TEST AGAIN
User testing – But not just the person sitting next to you!
Does it work? Both technically and for the end user
Does it do what you planned / wanted it to do?
Wash, rinse and repeat – Build, test, change, test, change
as many times as needed
SET IT FREE – RELEASE DAY
Make it live!
But don’t forget about it!
Ongoing monitoring
And remember to update the content when needed!
ANY QUESTIONS?

Analytics and design changes

  • 2.
  • 3.
    ITS VIDEO TIME WebAnalytics for Beginners https://www.youtube.com/watch?v=PnVZ7_OA7Qo
  • 4.
    WHY MIGHT YOUUSE WEB ANALYTICS? Web analytics won’t give you straight answers - it will help YOU analyse your content and make better decisions. For example: How long do you/your colleagues spend creating and updating web content? Is this investment worth while? Which content is most popular? How successful are marketing campaigns Did your press advertisements drive people to your page How many people responded? Where are your visits coming from?
  • 5.
    METRICS – WHATDO THEY MEAN? Hits – “How Idiots Track Success” These refer to every type of file on the website – including images, video, audio. Therefore, a single page will contain many hits. Never use hits to measure web usage. Visits Number of visits to this page by any number of unique computers / internet-enabled devices. A visit is a series of actions that begins when a visitor views the first page from the server, and ends when the visitor leaves the site or remains idle beyond the idle-time limit (30 min). Views Number of times this page was viewed by visitors
  • 6.
    Visitors Individual computers/devices thathave accessed our website. Unique visitors are monitored by ‘cookies’ which are issued to the device. Cookies are issues for 10 years. If someone deletes a cookie, or the cookie expires then the machine (person) will be treated as a new visitor. Visitors is a measure relating to unique machines NOT people. METRICS – WHAT DO THEY MEAN?
  • 7.
    Visitors Not all visitorshave a person behind the device! Spiders, crawlers, robots etc These are automated programs that scan the web by following links These consists of: the Good: search engine spiders (eg GoogleBot) which indexes pages the Bad: crawlers that steal email addresses for spamming the Ugly: they would affect your web statistics – but are blocked Many people misunderstand the various metrics, and as a result the terms are often confused. Let’s look at some examples… METRICS – WHAT DO THEY MEAN?
  • 8.
    EXAMPLE: DIFFERENCE BETWEEN VISITSAND VISITORS January 2007 150,000 people visit your site ONCE. (FIRST visit ever). Report would show: Visits = 150,000 Percentage of visits made by new and returning visitors Unique visitors = 150,000 February 2007 The SAME 150,000 people visit site ONCE for a SECOND visit. Report would show: Visits = 150,000 Percentage of visits made by new and returning visitors Unique visitors = 150,000 100% NEW 100% RETURNING
  • 9.
    EXAMPLE: DIFFERENCE BETWEEN VISITSAND VISITORS January AND February 2007 What if we produce a report covering both January and February? Visits = 300,000 Percentage of visits made by new and returning visitors Unique visitors = 150,000 Notice that unique visitors has not increased to 300,000 (unlike visits) Unique visitors only counts unique users (based on cookies) within the specified time period 50% NEW 50% RETURNING
  • 10.
    EXAMPLE: VISITOR AND VISITINACCURACIES There is no way for Web Analytics to know whether a unique machine = unique user Adam and Matthew could both use the same computer. We would be counted as ONE unique user. First visit by Matt would be counted as a New Visit (assuming no cookie on PC) Second visit by Adam would be counted as Returning Visit by the same visitor Matt Tuesday AM Adam Tuesday PM Analytics sees ONE unique user
  • 11.
    EXAMPLE: VISITOR AND VISITINACCURACIES There is no way for Web Analytics to know whether a unique machine = unique user Adam would be counted as THREE unique users! Tuesday AM (work PC) Tuesday PM (mobile) Tuesday PM (home PC)
  • 12.
    EXAMPLE: VISITOR AND VISITINACCURACIES People delete cookies People block cookies Cookies expire Therefore, beware taking the figures as 100% accurate, but trends can be useful
  • 13.
    GROUPS AND FILTERS: WHATARE THEY? Groups are sub-sets of data Web analytics collects ALL data about visitor activity from the moment your page is first accessed by someone. Data can be sliced into groups to make it easier to manage. Groups can exist for sections of the website We use filters to exclude data from the profile that we’re not interested in. Filters allow you to split information into sub-groups (e.g. everyone using a phone or just public visits)
  • 14.
    ITS VIDEO TIME FunnyWeb Analytics Commercial https://www.youtube.com/watch?v=6VuxmB07Em0
  • 15.
  • 16.
    WHERE TO START Whatis you task / conversion / purpose? Planning is key What else do you need over the usual stuff? Who is your target audience? Project plan
  • 17.
    RESEARCH AND ANALYSIS Informationgathering – people / telephone data / emails / survey / try your self Begin to set some goals – What do you want to achieve What does your manager / colleague / CEO etc. want
  • 18.
    PLAN, PLAN ANDTHEN PLAN AGAIN The best tool in planning – Post it’s Meet, scope, discuss, finalise Build a structure (on paper or Post it’s!) Do you want to add different things e.g. forms, shop, videos, image gallery, news stories etc.
  • 19.
    DESIGN AND DEVELOP Nowyou know what you want, what do you need to do it? Visual look and feel Create mock ups / plans Always think about the end user Usability and Accessibility
  • 20.
  • 21.
    CONTENT Use the righttext – Plain English, check for misspellings, broken links etc. Use all features available - would a video guide be better? Are images needed? Remember SEO (Search Engine Optimisation)
  • 23.
    ITS VIDEO TIME CanPeople Explain Intangible Concepts https://www.youtube.com/watch?v=NGYLAKYNVX8
  • 24.
    BUILD AND DEVELOPMENT Alwaysthink about the end user Usability and Accessibility Responsive design Don’t make it live when it is built
  • 25.
    TEST, TEST ANDTHEN TEST AGAIN User testing – But not just the person sitting next to you! Does it work? Both technically and for the end user Does it do what you planned / wanted it to do? Wash, rinse and repeat – Build, test, change, test, change as many times as needed
  • 26.
    SET IT FREE– RELEASE DAY Make it live! But don’t forget about it! Ongoing monitoring And remember to update the content when needed!
  • 27.