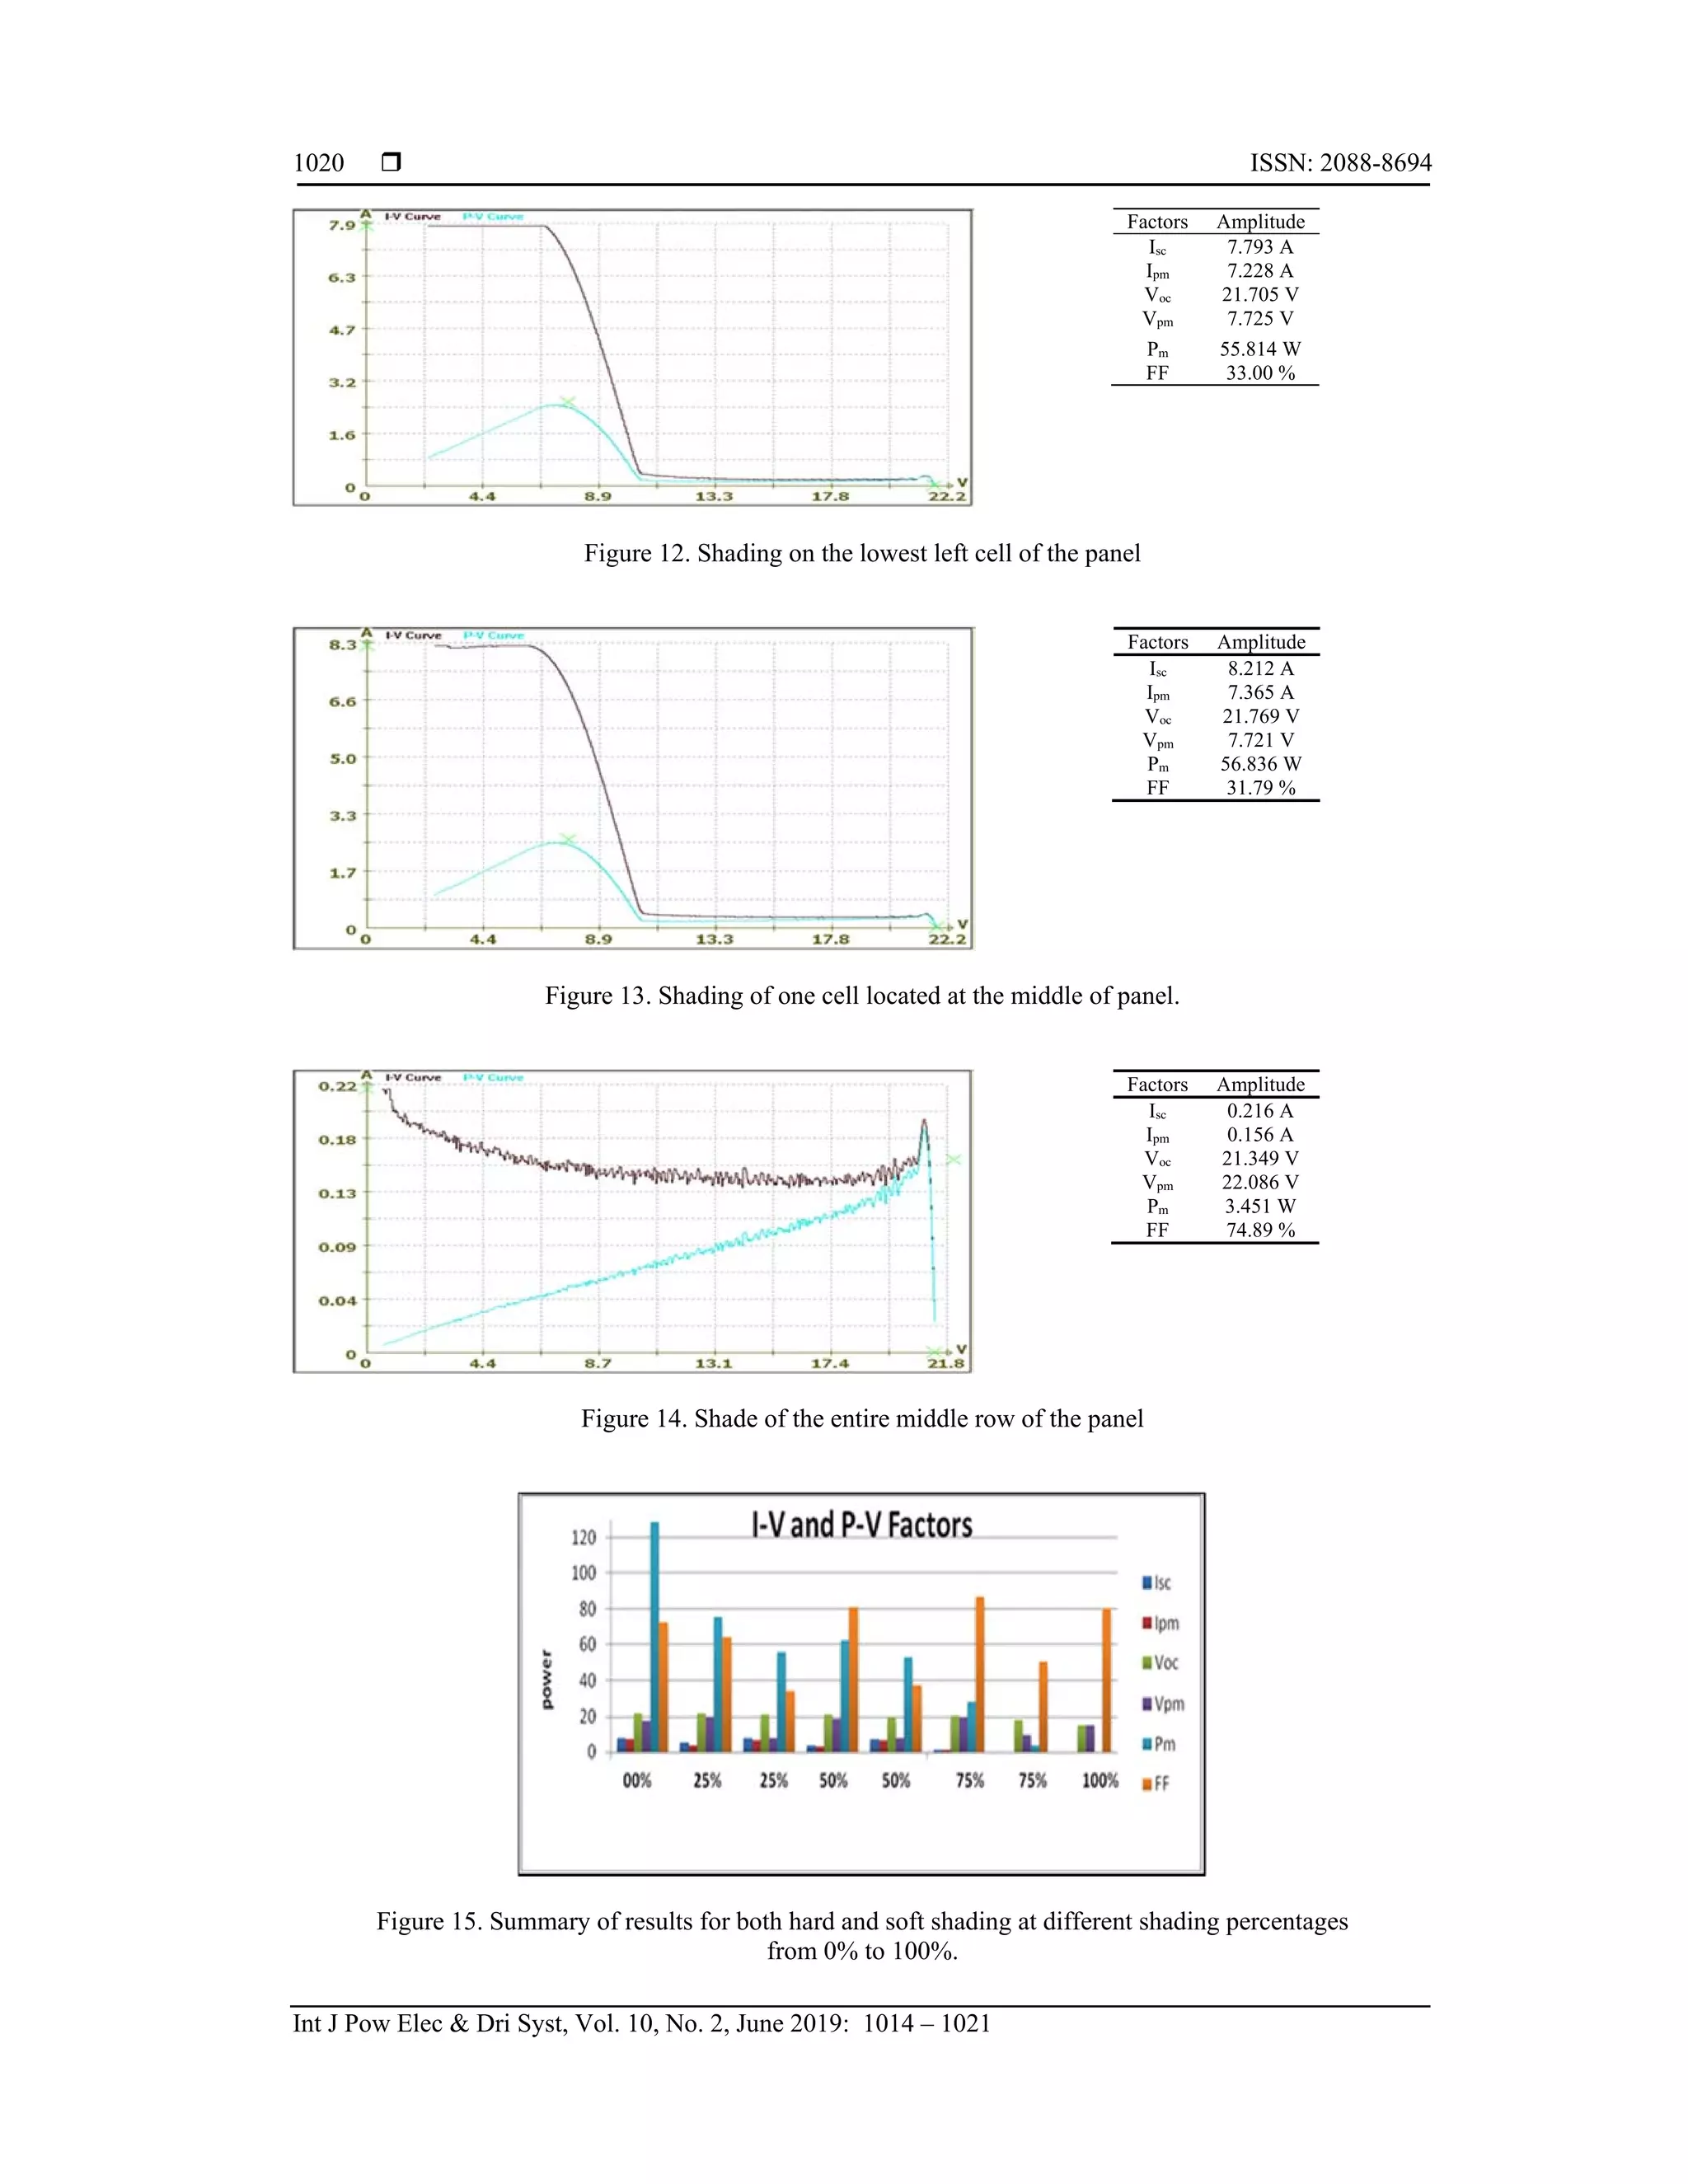
This paper analyzes the impact of shading on photovoltaic module performance using a solar module tester, specifically focusing on hard and soft shading scenarios. The study reveals that both types of shading significantly reduce output power, efficiency, and fill factor, with hard shading causing more severe effects than soft shading. It concludes that for optimal solar panel performance, installation in shading-free areas is crucial.
![International Journal of Power Electronics and Drive System (IJPEDS)
Vol. 10, No. 2, June 2019, pp. 1014~1021
ISSN: 2088-8694, DOI: 10.11591/ijpeds.v10.i2.pp1014-1021 1014
Journal homepage: http://iaescore.com/journals/index.php/IJPEDS
Analysis of the hard and soft shading impact on photovoltaic
module performance using solar module tester
Mustafa Hamid Al-Jumaili1
, Ahmed Subhi Abdalkafor2
, Mohammed Qasim Taha3
1 Renewable Energy Research Center (RERC), University of Anbar, Iraq
2 Career Development Center, University of Anbar, Iraq
3 College of Applied Sciences-Hit, University of Anbar, Iraq
Article Info ABSTRACT
Article history:
Received Oct 12, 2018
Revised Jan 20, 2019
Accepted Mar 4, 2019
Solar cells are a major alternate source of sustainable energy in the usual
condition of depleting non- renewable energy sources. Nowadays, this source
is getting more and more important due to its use in large and small-scale
installations. One of the major causes of energy losses in photovoltaic (PV)
modules is the shading. It can happen due to clouds passing, near trees,
and/or neighboring structures. Generally, there are two types of PV module
Shading which are either partial shading or complete shading. Both have a
significant impact on the solar module output power. This paper is an attempt
of carrying out a study of the electrical characteristics of a solar module with
various percentages of simulated shading. The solar module tester (SMT)
simulator was used in this study. The study approved the direct correlation
between short-circuit current and solar irradiance. The advantage of using
SMT is its stable irradiance in comparison to the practical unstable solar
irradiance within the same period. The results of both methods of shading
simulation show that shading has a significant impact on the performance of
solar panel in terms of efficiency, fill factor and output power. For better
performance, solar panels should install in shading free places as much as it
is possible.
Keywords:
Maximum power point,
Photovoltaic,
Shading,
Solar module tester,
Solara® PV.
Copyright © 2019 Institute of Advanced Engineering and Science.
All rights reserved.
Corresponding Author:
Mohammed Qasim Taha,
College of Applied Sciences-Hit,
University of Anbar, Iraq.
Email: as.mohammad_taha@uoanbar.edu.iq
1. INTRODUCTION
Lately, sustainable energy has become a hot topic attracting a lot of researcher’s interest. Energy is a
highly needed source for nation’s development, yet traditional energy sources are considered as highly
depleted sources. All that leads to researching new energy resources such as wind, water, the geothermal and
solar energy. Solar energy is inexhaustible green energy, and environmentally friendly [1]. Fossil fuel will
continue dominating the main global energy consumption. Nations’ awareness of fossil fuel using and the
planet's carbon emissions because of climate change and global warming [2]. Therefore, sustainable energy
resources such as wind and solar energy will play an important role in the energy of the world in the near
future [3]. Solar energy is a promising option for renewable energy and it has gained the interest of the world.
Conversion of solar energy into electrical energy is static, quiet, and environment-friendly [4]. Therefore,
photovoltaic industry growth was very fast in past years. Photovoltaic (PV) system performance is affected
by several factors including the strength of irradiance, shading, temperature, degradation, soiling, mismatch
losses, tilt angle etc.
Non-ideal operating conditions is one of the most affecting parameters on the PV system
performance. One of these non-ideal conditions is working under reduced irradiance due shading effect [5].
Shading may be uniform or nonuniform if it covers the whole surface of the panel is considered as uniform](https://image.slidesharecdn.com/474mar1917100mameditulfah-210624015855/75/Analysis-of-the-hard-and-soft-shading-impact-on-photovoltaic-module-performance-using-solar-module-tester-1-2048.jpg)
![Int J Pow Elec & Dri Syst ISSN: 2088-8694
Analysis of the hard and soft shading impact on photovoltaic module … (Mustafa Hamid Al-Jumaili)
1015
shading. While if the shading covers only part of the PV panel then it considered as a non-uniform shading.
In both cases, it has a significant impact on the solar cell output power [6]. Under partial shading conditions,
the power from the PV module can be dramatically reduced and maximum power point tracking control will
be affected [1]. The accurate partial shading modeling of PV system was introduced in ref. [7, 8]. The authors
were used a two-diode model to represent the PV cell. The model requires only four parameters to get better
accuracy at low irradiance level, allowing for more accurate prediction of PV system performance during
partial shading condition. A large array simulation model was used and interfaced with MPPT algorithms and
power electronic converters [9]. The accurateness of the modeling technique was validated by real-time
simulator data and compared with the Neural Network model, P&O and single-diode model. This study is
very useful for companies and expertise in the field of renewable energy because of its accuracy, simplicity,
and the fast of applying [10].
The available photovoltaic modules have the configuration of series-connected, parallel connected
or combination of both connections of cells. Some parameters have a direct effect on the output of any solar
module such as solar irradiance, cell temperature, tilt angle shaded condition. Therefore, the generated
electricity of a solar panel is highly affected by the strength of solar irradiance. The amount of falling
sunlight on the module determines the current generated by a PV module [11, 12]. Based on this background
and since the solar irradiance level is not at standard level (1000W/m2) most of the daytime, this paper aims
to analyze and study the effect of shading on whole and a partial surface of the PV module based on solar
module tester. Pulsed light and decaying solar simulator are used in our simulation which has the ability of
control the solar irradiance level, calculating the series resistance of module fill factor, short circuit voltage,
open circuit voltage, short circuit current, peak power, and the temperature during the test.
2. SOLAR SIMULATOR
Currently, three types of solar simulators are available [13]: the first type is constant light simulator
which needs heat load, cooling, and high power consumption. The second type is pulsed light simulator
where there is no sample heating, fast measurement, and no temperature leveling. The third type is the pulsed
light with the decaying simulator, this simulator can measure different levels of irradiation, series resistance
measurement, and high peak irradiance can be reached easily [14]. The standard parameters of solar cell
classes are given in Table 1.
Table 1. Standard parameters for solar simulators classes according to ASTM standard
Classification Spectral Match
(each interval)
Irradiance Spatial
Non-Uniformity
Temporal Instability
Class A 0.75–1.25 2% 2%
Class B 0.6–1.4 5% 5%
Class C 0.4–2.0 10% 10%
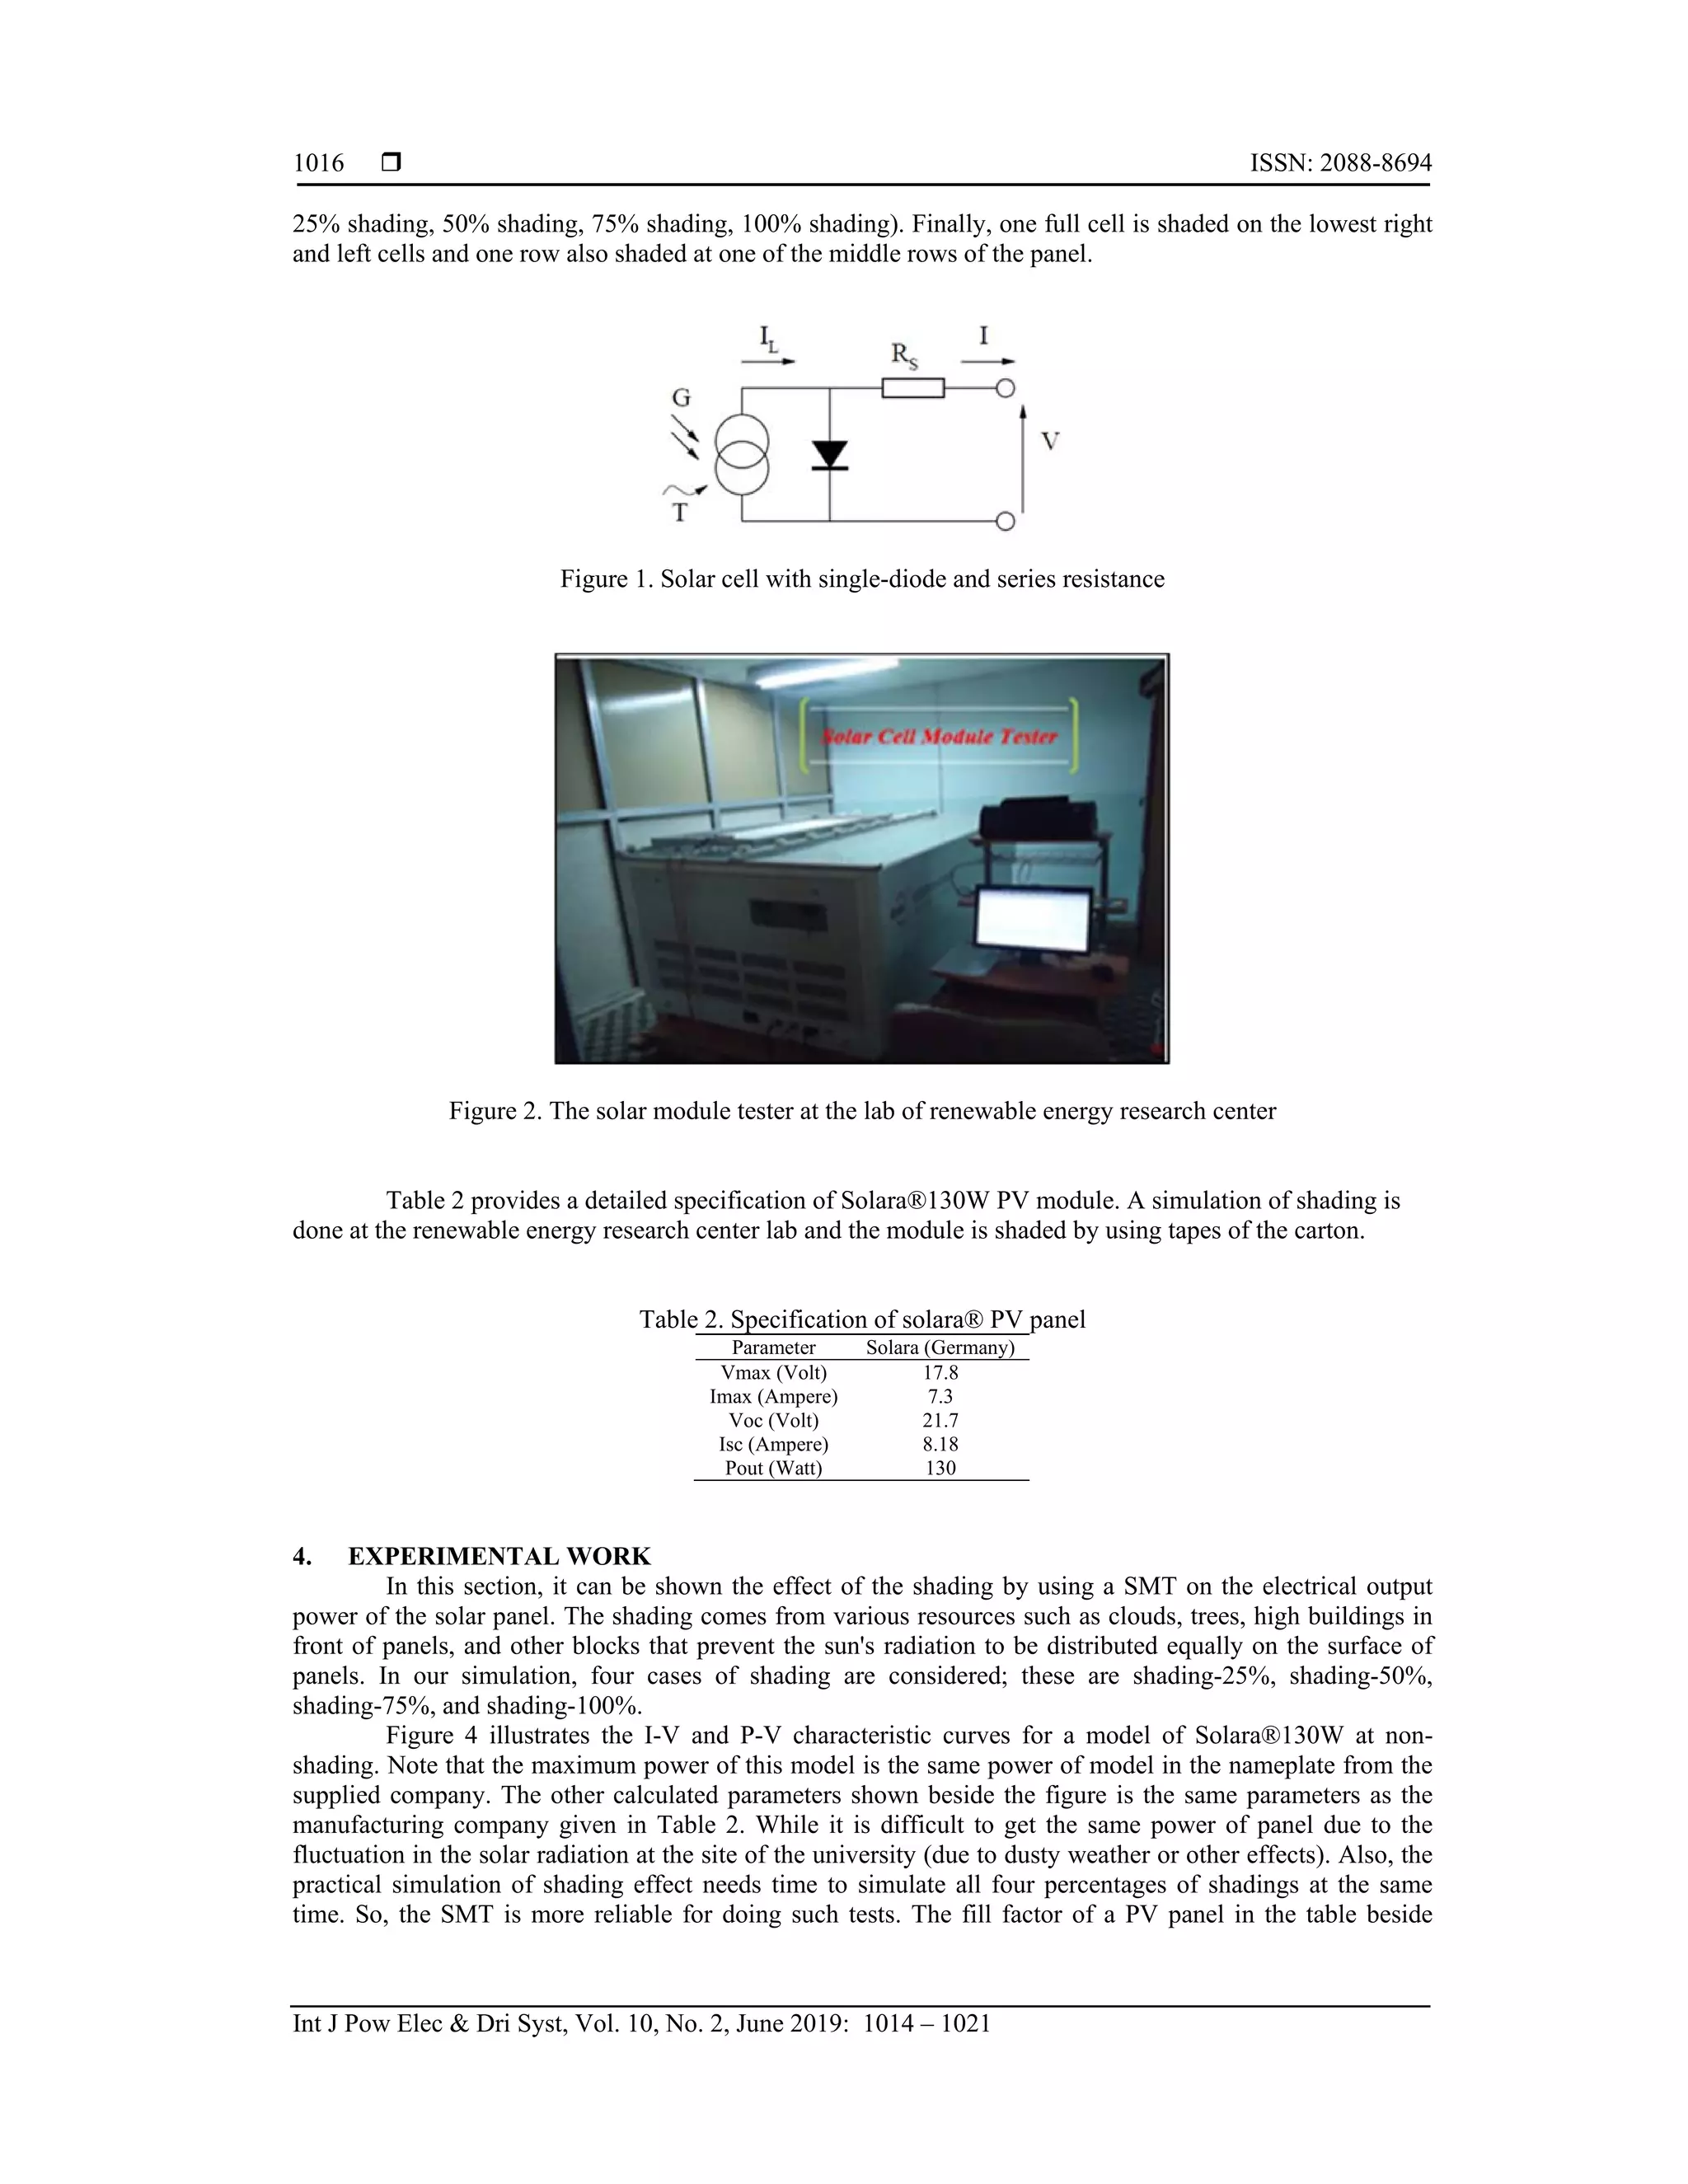
3. SOLAR CELL MATHEMATICAL MODEL
A single diode solar cell equivalent circuit is shown in Figure 1, the equivalent circuit consists of a
parallel connected current source with a diode and the whole group is connected in series with the resistance.
There is a direct proportion between the falling light on the cell and its output current (photocurrent IL). The
solar cell is considered as inactive device during the night time or full darkness, instead, the cell works as a p-
n junction diode. It doesn't produce any power in terms of current or voltage. Yet, it will generate a current
called dark current or diode current when it is connected to an external power supply with a large voltage.
The diode type determines the I–V characteristics of the cell, a detailed algorithm of the single diode solar
cell equivalent circuit is given by refs. [15, 16].
The reason for choosing Solara® PV for modeling in this paper is the suitability of this module to
the traditional applications of a PV solar system. The used Solara® PV module has 36 polycrystalline silicon
cells in a series connecting and it is providing a nominal maximum power of 130W. Standard conditions test
are used for data measurements by a solar simulator, which is: Illumination of 1kW/m2 at AM 1.5 spectral
distribution and temperature of the module of 25 C or as specified on curves.
A Solar Module Tester (SMT) (module type: GSMT, class-AAA) can extract the most PV
characteristics [17]. The SMT exists in the laboratory of Renewable Energy Research Center-University of
Anbar as shown in Figure 2, and is used for evaluation of shading effect on the performance of
Solara®130W panel. All analysis has been done by an scmt #286 DAQ-2017 software. The PV panel is in a
horizontal plane at standard height and more than one test on the panel can be done (i.e. without shading,](https://image.slidesharecdn.com/474mar1917100mameditulfah-210624015855/75/Analysis-of-the-hard-and-soft-shading-impact-on-photovoltaic-module-performance-using-solar-module-tester-2-2048.jpg)
![Int J Pow Elec & Dri Syst ISSN: 2088-8694
Analysis of the hard and soft shading impact on photovoltaic module … (Mustafa Hamid Al-Jumaili)
1017
Figure 3 is the ratio of the PV cells actual power output (Vpm x Ipm) versus its dummy output power (Voc x
Isc). The evaluating of solar cells performance is highly depending on fill factor ratio.
Typically, the fill factor of commercial solar cells is > 0.7. The crystalline cells fill factor lies
between 0.4 and 0.65 on grade B, while in thin film solar cells or amorphous cells between 0.4 and 0.7. The
solar cell series resistance can be determined using the ratio of fill factor. The fill factor is a parameter of
interest given by the relation [12]:
FF=(Vpm*Ipm)/(Voc*Isc) (1)
The photovoltaic conversion efficiency, another important parameter, measures the amount of light energy
that can be converted into electrical energy and is given by [13]:
η=Pm/Pin=FF*Isc*Voc/Pin (2)
Where Pm is the maximum power of the device and Pin is the incident power.
Figure 3. The fill factor of a solar panel
The lower fill factor produces less power at its maximum power point contrasted with the higher fill
factor of the panel. To specify the solar cell grade, every single solar panel is tested for its fill factor during
the manufacturing process of commercial grade solar panels. If the fill factor below 0.7, the panels are
considered as Grade-B cells, then they are sliced and may be used for a personal or any other use. In Figure 4
the fill factor is 72.36% which is within the accepted range.
Factors Amplitude
Isc 8.160 A
Ipm 7.273 A
Voc 21.872 V
Vpm 17.756 V
Pm 129.140 W
FF 72.36 %
Figure 4. Simulation results at no shading for Solara® 130W PV panel](https://image.slidesharecdn.com/474mar1917100mameditulfah-210624015855/75/Analysis-of-the-hard-and-soft-shading-impact-on-photovoltaic-module-performance-using-solar-module-tester-4-2048.jpg)
![Int J Pow Elec & Dri Syst ISSN: 2088-8694
Analysis of the hard and soft shading impact on photovoltaic module … (Mustafa Hamid Al-Jumaili)
1021
5. CONCLUSION
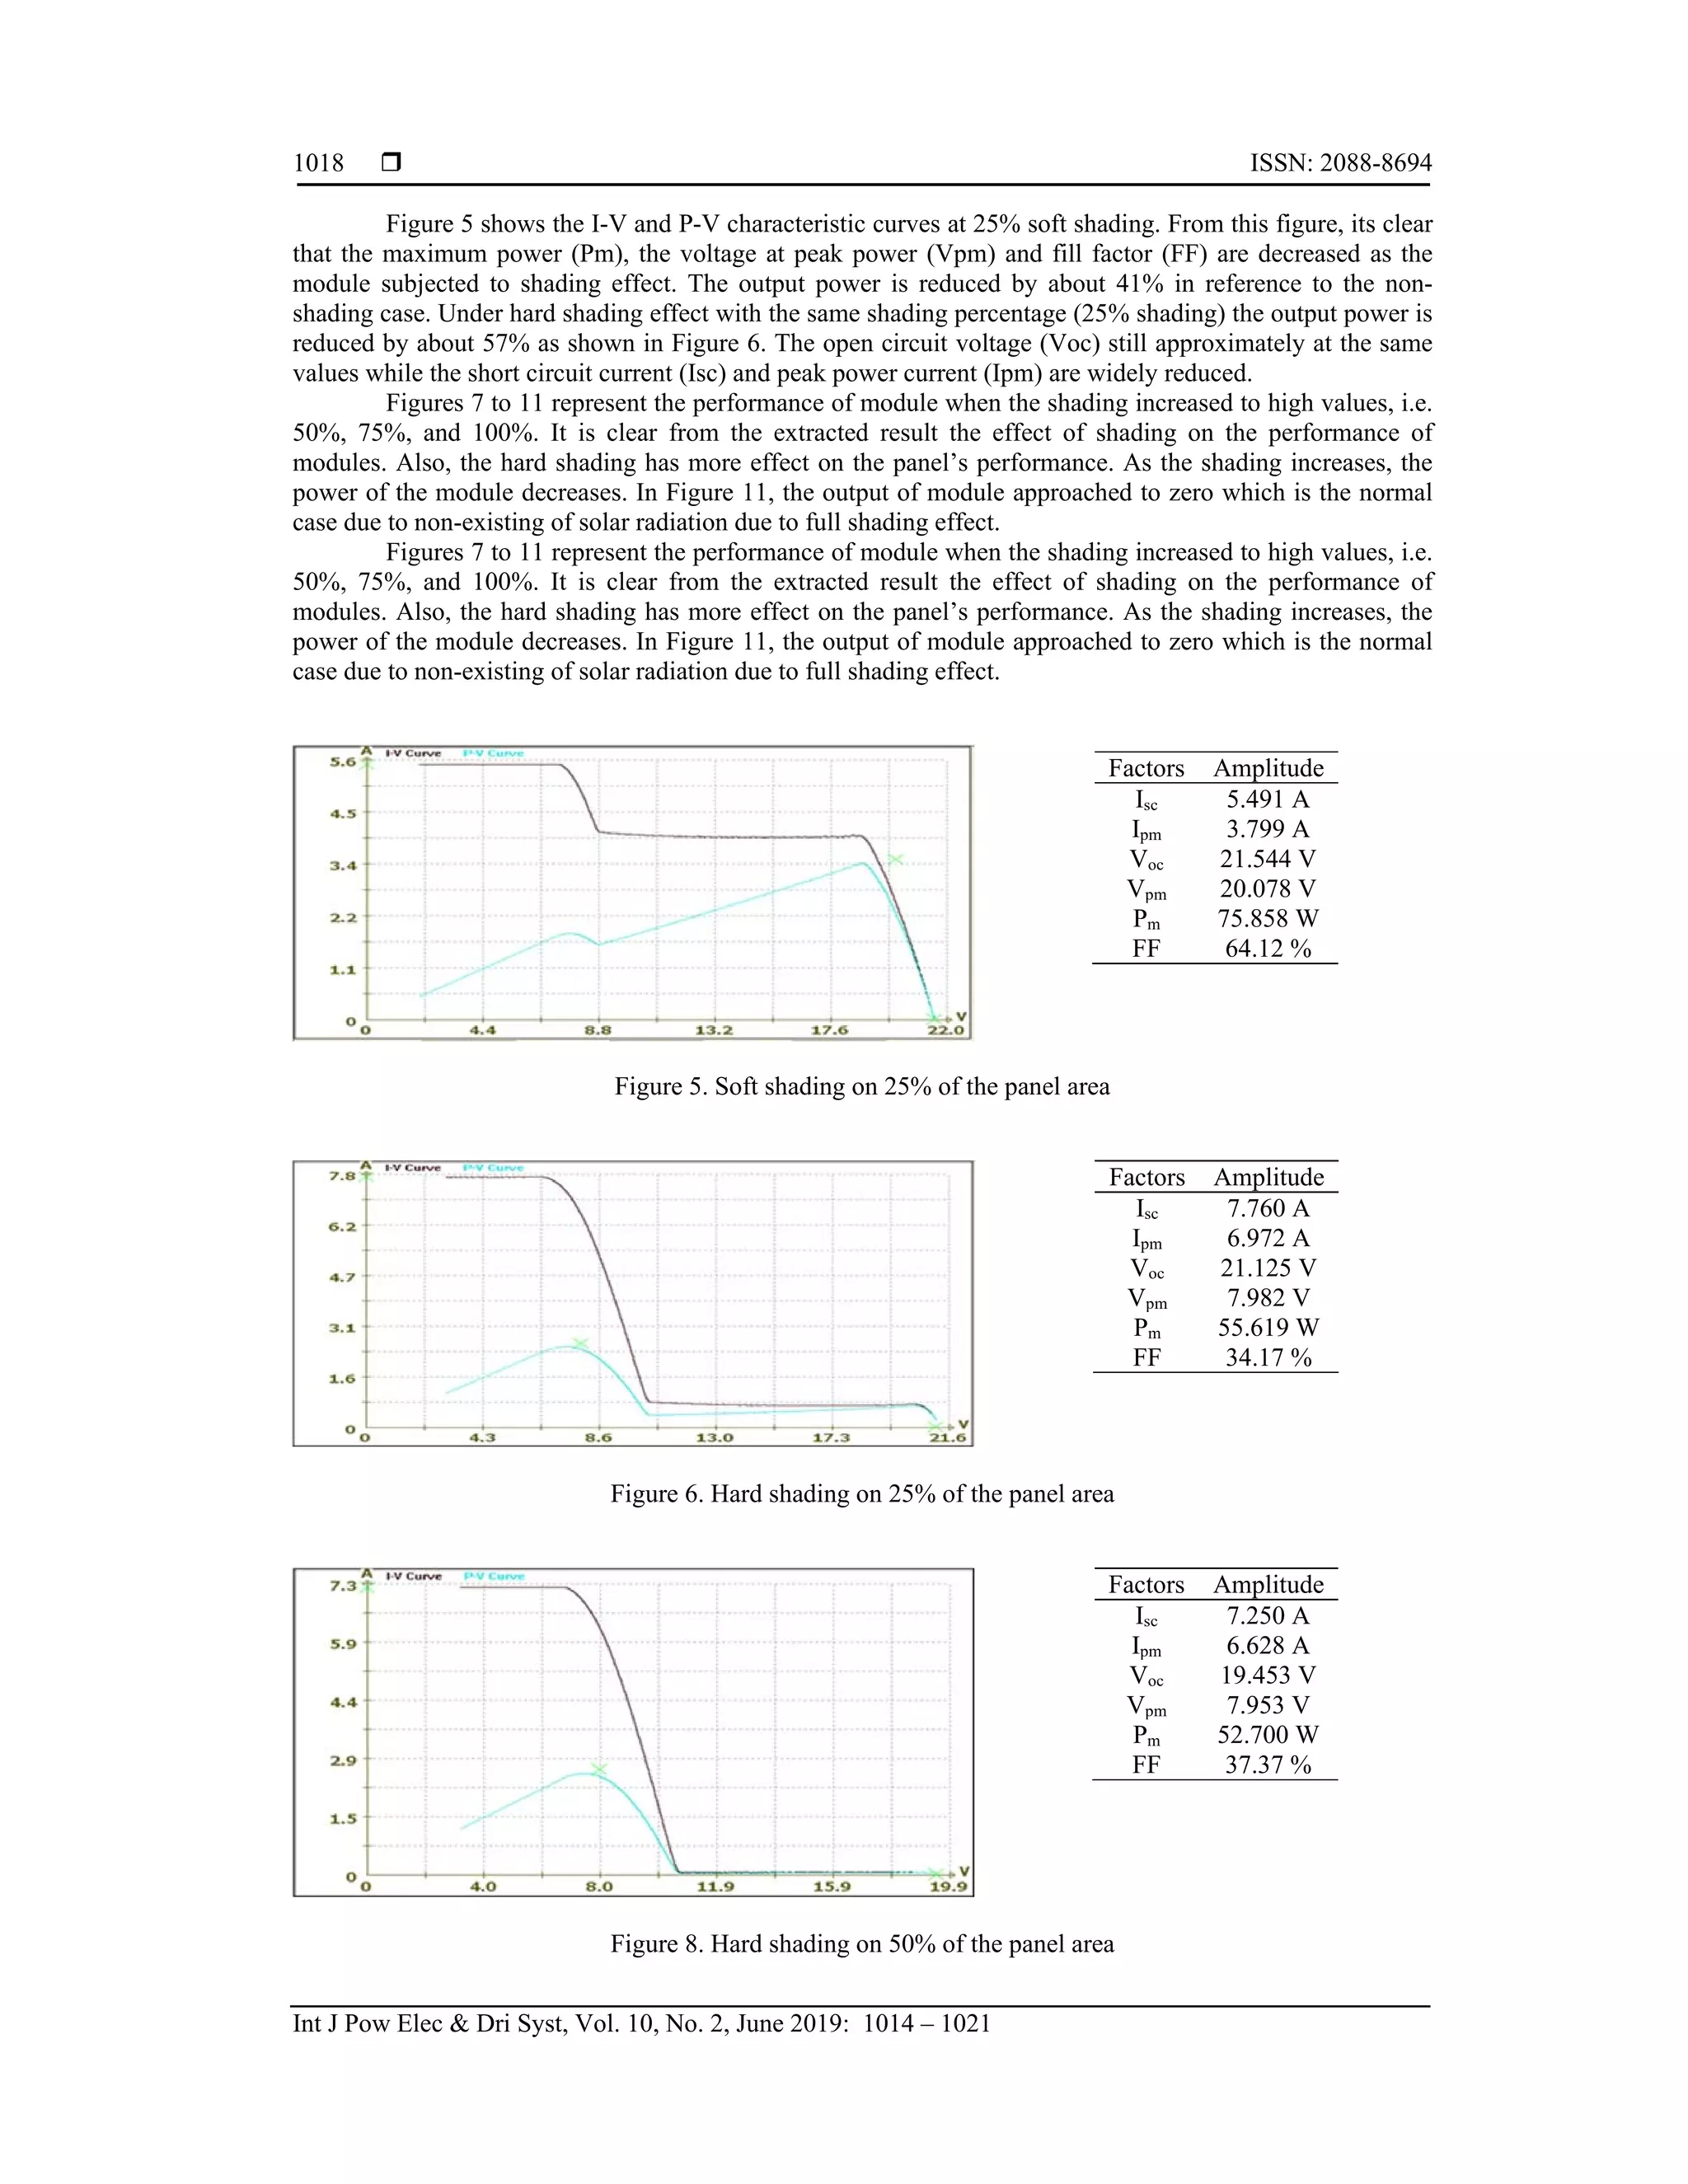
In this study, the effect of the hard and soft shading on PV module performance was investigated by
using the solar module tester. The results show that the shading can play an important role in the performance
of PV systems. The solar module tester was used to simulate the standard sun radiation (1000W/m2). The
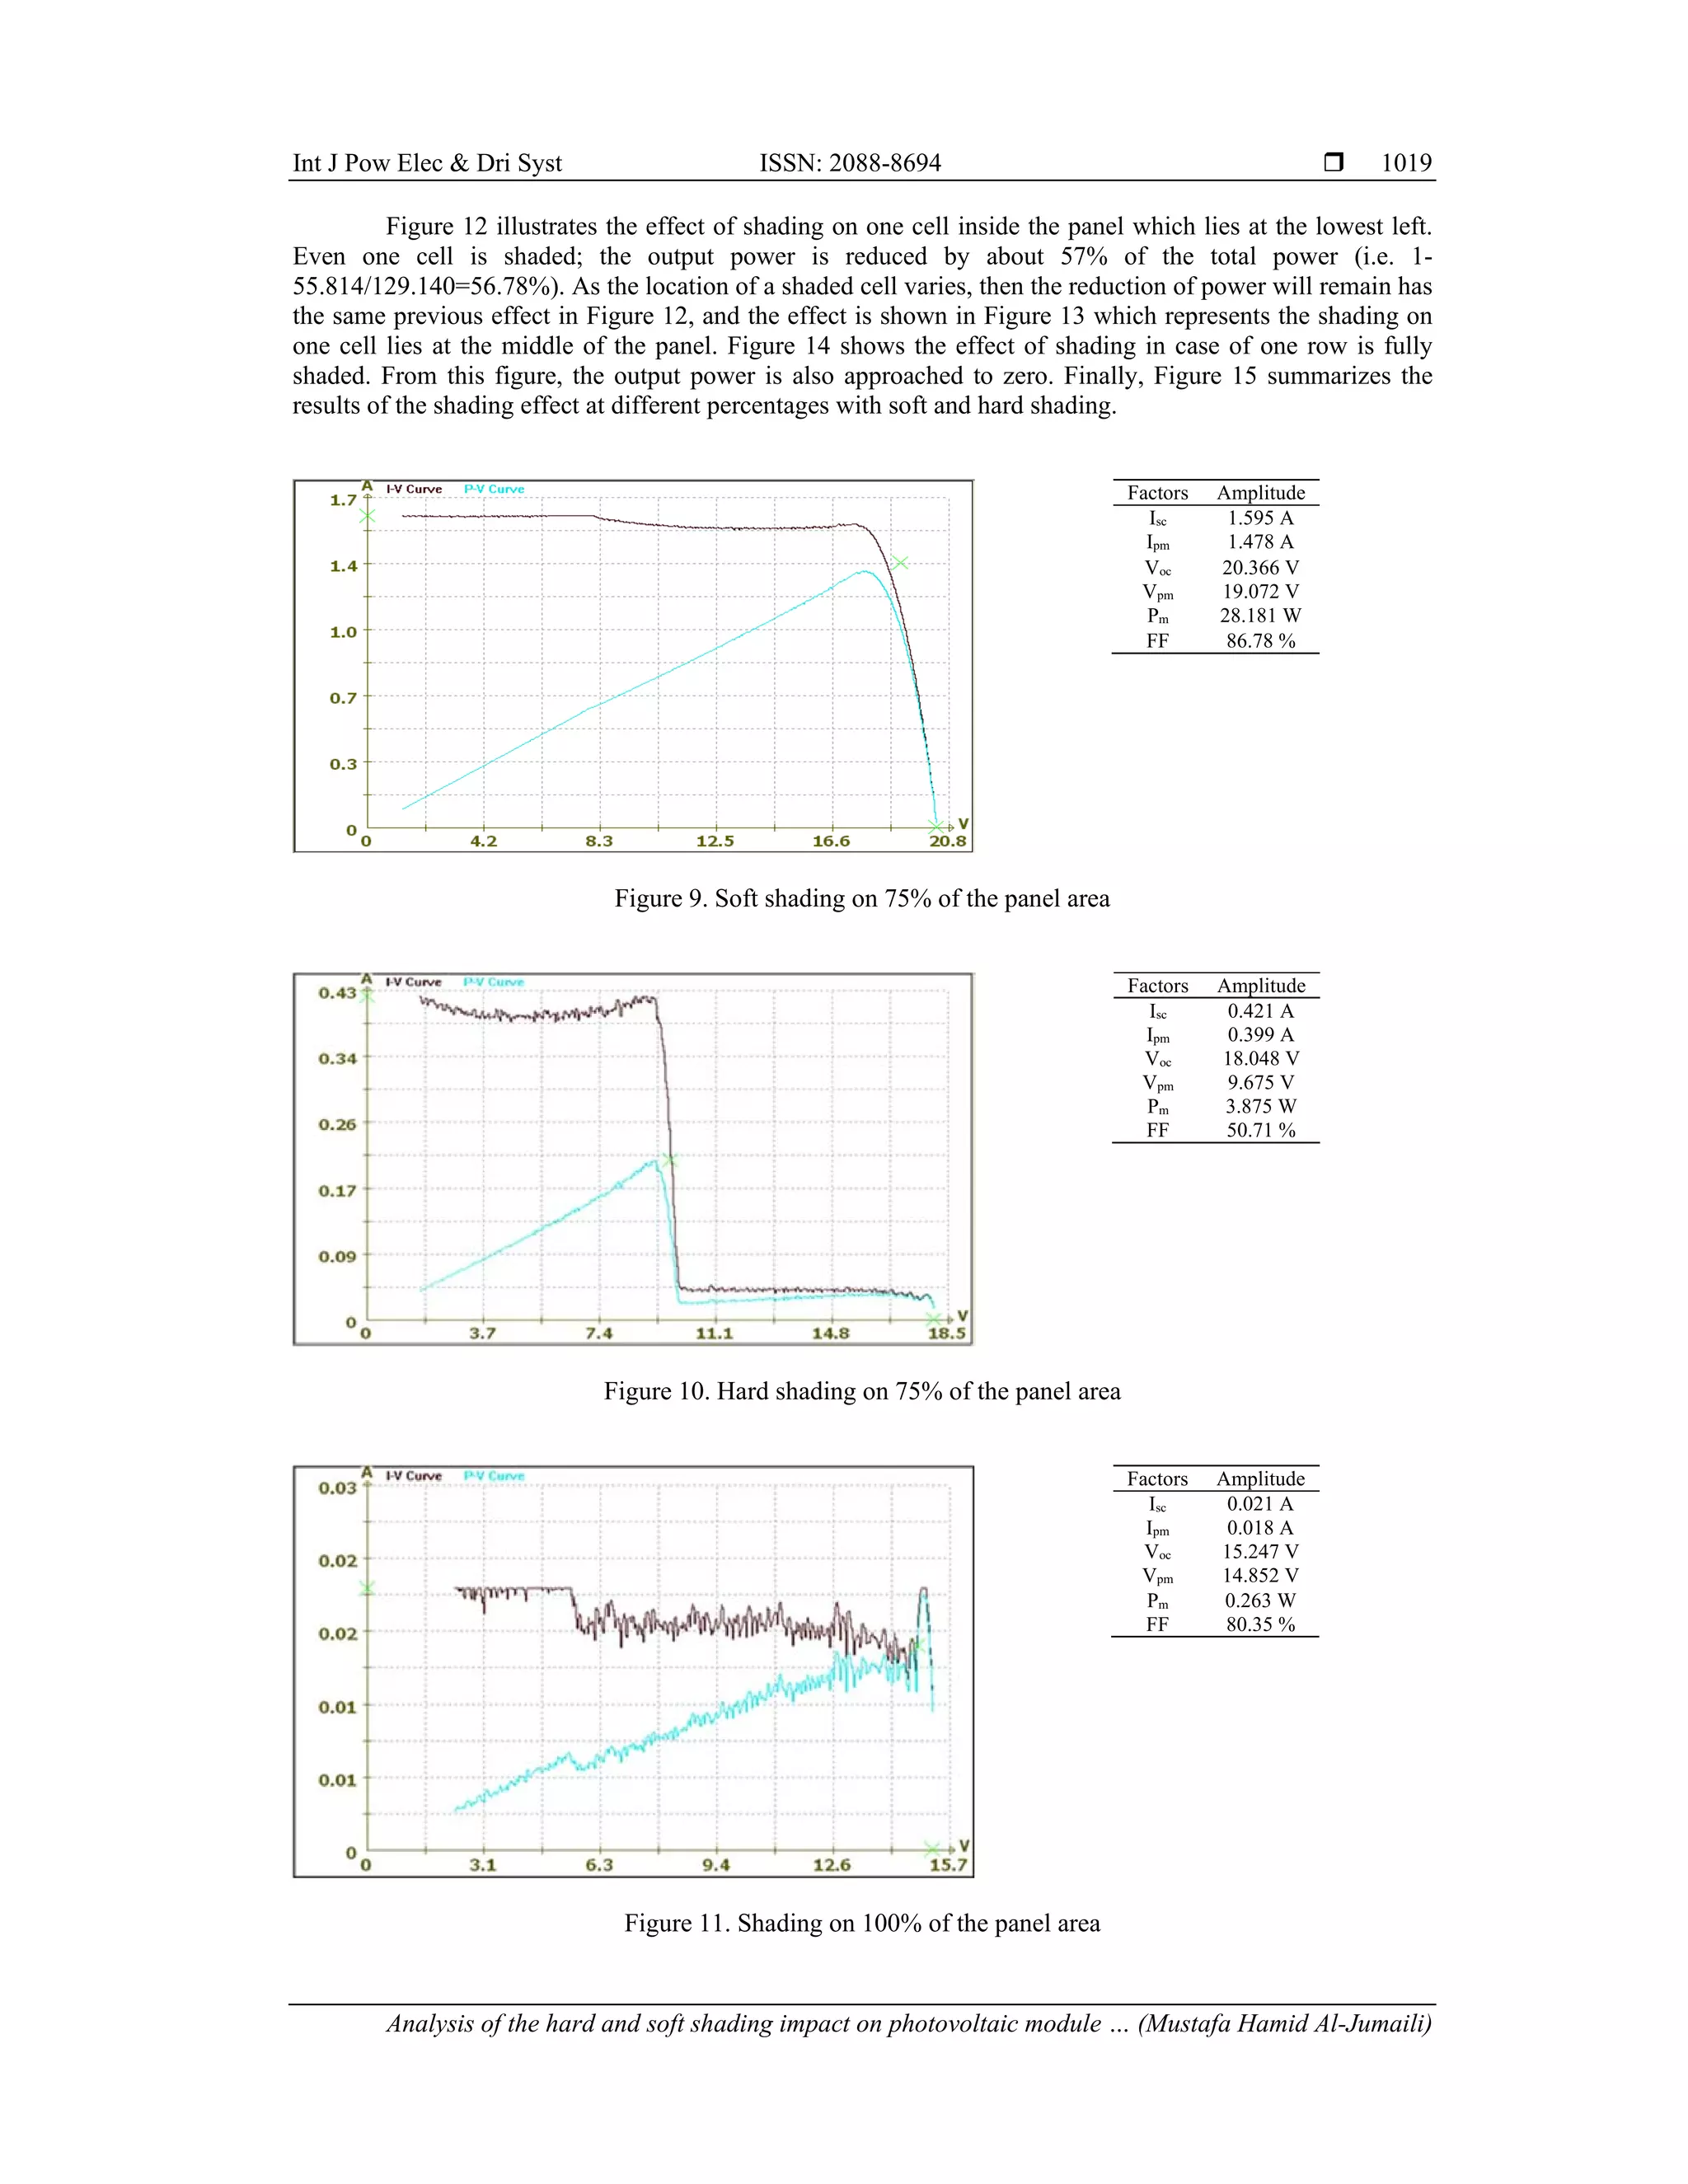
output power of module was reduced by 41% when the shading was 25% of the panel area and the power of
module was zero at complete hard shading case. When one cell was shaded, the power reduced by 57%. So,
it is important to choose the suitable site for installing the solar system to get the maximum power from the
modules.
ACKNOWLEDGMENT
This research is supported and revised by the Scientific Committee in the Renewable Energy
Research Center at the University of Anbar.
REFERENCES
[1] Y. Jiang, J. A. A. Qahouq and M. Orabi, "Matlabsolara PV/Pspice Hybrid Simulation Modeling of Solar PV
Cell/Module," in Twenty-Sixth Annual ConferenceApplied Power Electronics Conference and Exposition (APEC),
6-11 march-2011, 2011.
[2] S. Samal and P. K. Hota, “Power Quality Improvement by Solar Photo-voltaic / Wind Energy Integrated System
Using Unified Power Quality Conditioner,” International Journal of Power Electronics and Drive System
(IJPEDS), Vol. 8, No. 3, September 2017, pp. 1416–1426.
[3] H. Tsai, "Insolation-oriented model of photovoltaic module using Matlab/Simulink," Solar Energy, vol. 84, no. 7,
pp. 1318-1326, 2010.
[4] Syafaruddin, E. Karatepe and T. Hiyama, "Polar coordinate fuzzy controller based real-time maximum-power point
control of photovoltaic system," Renewable Energy, vol. 34, no. 12, pp. 2597-2606, 2009.
[5] E. V. Paraskevadaki and S. A. Papathanassiou, "Evaluation of MPP Voltage and Power of mc-Si PV Modules in
Partial Shading Conditions," IEEE Transaction on Energy Conversion, vol. 26, no. 3, 2011.
[6] KashifIshaque, Z. Salam and Syafaruddin, "A comprehensive Matlab Simulink PV system simulator with partial
shading capability based on two-diode model," Solar Energy, vol. 85, p. 2217–2227, 2011.
[7] KashifIshaque, Z. Salam, H. Taheri and Syafaruddin, "Modeling and simulation of photovoltaic (PV) system during
partial shading based on a two-diode model," Simulation Modelling Practice and Theory, vol. 19,
p. 1613–626, 2011.
[8] H. Patel and V. Agarwal, "Matlab-based modeling to study the effects of partial shading on PV array
characteristics," IEEE Transaction on Energy Conversion, vol. 23, no. 1, pp. 302-310, 2008.
[9] Mohammed Qasim Taha, Mustafa H. Al-Jumaili, Abdullah Khalid Ahmed, "Modeling the dielectric mediums
impact on coaxial transmission line performance", Journal of Engineering and Applied Sciences,
Volume 13 Issue 20, 2018.
[10] Younes S. Alwan, Mohammad Sami Zidan, Mohammed Qasim Taha, "Evaluation of Mobile Microwave Electric
Field Severity at Al-Door Residential Complex in Iraq", Indonesian Journal of Electrical Engineering and
Computer Science (IJEECS), Vol 14, No 3: June 2019.
[11] G. Walker, "Evaluating MPPT Converter Topologies Using Matlab PV Model," University of Queensland, 2016.
[12] E. H. Sabbar, M. H. Saleh, S. M. Salih and S. H. Salih, "Deposition of SeTe/Si Thin Film via Thermal
Evaporation," American Journal of Condensed Matter Physics, vol. 3, no. 5, pp. 119-122, 2013.
[13] Ehsan H. Sabbar, Mustafa. H. Saleh and Salih M. Salih, "A Fabricated Solar Cell from ZnO/a-Si/Polymers,"
International Journal of Advanced Science and Technology, vol. 44, pp. 89-98, July, 2012.
[14] Mohammed Qasim Taha, Aymen Lpiza, "Design a New PWM Switching Technique in Multilevel Converters",
IEEE Connecticut Conference on Industrial Electronics Technology & Automation 2016, University of Bridgeport,
CT, United States of America, October 14, 2016 – October 15, 2016.
[15] M. Villalva, J. Gazoli and E. Filho, "Modeling and circuit based simulation of photovoltaic arrays," in Proceedings
of Power Electronics Conference, Bonito, Brazil, 2009.
[16] Abdelkader Mezouari, R. Elgouri, M. Alareqi, K. Mateur, H. Dahou4, L. Hlou, “A New Photovoltaic Blocks
Mutualization System for Micro-Grids Using an Arduino Board and Labview” International Journal of Power
Electronics and Drive System (IJPEDS), Vol. 9, No. 1, March 2018, pp. 98-104
[17] C. S. Chin, P. Neelakantan, S. S. Yang, B. Chua and K. T. K. Teo, "Effect of Partially Shaded Conditions on
Photovoltaic Array’s Maximum Power Point Tracking," IJSSST, vol. 12, no. 3, pp. 52-59, 2012.](https://image.slidesharecdn.com/474mar1917100mameditulfah-210624015855/75/Analysis-of-the-hard-and-soft-shading-impact-on-photovoltaic-module-performance-using-solar-module-tester-8-2048.jpg)