The increasing demand of clear communication in any situation and in any environment leads
people to find a better way to communicate. Since the presence of tree canopies can affect the ability of a GSM
signals through its way, one of the hardest environment is forested areas. In order to find a better way to
communicate, the propagation features of the environment should be known.This study investigates the
attenuation characteristics of GSM (2G, 3G and 4G) frequencies in the forest. Some theoretical models from
literature were studied and simulated. The electrical field of the transmitted signal was measured in Sakarya.
Due to weather and seasonal conditions, experiment was re-modeled with the trees with small, thin trunk and
high amount of leaves. Finally, the literature data and experimental data were compared and discussed.
Introduce variable/ Indices using landsat imageKabir Uddin
Image Index is a “synthetic image layer” created from the existing bands of a multispectral image. This new layer often provides unique and valuable information not found in any of the other individual bands.
Image index is a calculated result or generated product from satellite band/channels
It helps to identify different land cover from mathematical definition .
Implementation of Charged Particles Deposition in Stochastic Lung Model and C...Hussain Majid
Freshly generated aerosols in workplace atmosphere may have charges well above the Boltzmann equilibrium (Forsyth et al. 1998). Similarly, aerosols produced by commercial metered dose inhalers can produce elementary charges up to several ten thousands (Kwok et al. 2005). In-vivo and in-vitro experiments have shown enhanced deposition in the lung due to electro-statically charged particles. Enhanced deposition due to charged particles in the lung is mainly caused by the image charge force (Yu, 1985). Several models have been developed to predict the effect of charged particles deposition in the lung with good agreement with the experimental data (Melandri et al. 1983; Yu 1985; Hashish et al. 1994). In the present study, enhanced deposition in the human lung due to charged particles has been estimated using the stochastic airway generation model IDEAL.
Av Ingemar Pongratz
Vi tillbringade några dagar i Khao Takiab, mest för att slappa riktigt ordentligt. Det är bra mycket mindre folk där och mycket lugnare men nu är vi tillbaka i Hua Hin
Mer om Ingemar Pongratz på:
http://ingemarpongratz.brandyourself.com/
Automatic Book Picking Robot For Librariesshaik nayeem
To automate the process of book finding and picking we suggest a robot with an arm which will be able to find out the book with the required tag and then pick it and place it on the table.
##CONTENT##
Introduction
Voltage control
Power system control
Control of reactive power and power factor
Interconnected control and frequency ties
Supervisory control
Line compensation
Series compensation
Series and shunt compensation schemes for ac transmission system
Copywriting and design of the presentation for the event agency Event Garden. For details see some pages of this presentation here: http://liblab.co/portfolio/eventgarden-radio-naprokat-prezentatsiya
Also you can see my whole portfolio on http://liblab.co/portfolio/
Создание презентации для ивент-агентства Event Garden (маркетинг и структурирование, копирайтинг, дизайн). Агентство предлагает уникальную услугу на российском рынке - радио напрокат.
Remote sensing implies to the collection of data
about an object from a distance. With the use of LiDAR
remote sensing technology, the three dimensional
distribution of plant canopies and vegetation structural
attributes can be accurately estimated. The measure of
difference in reflectance from leaves of plants, due to the
presence of chlorophyll pigments in different ratios, can be
helpful to locate and characterize the plant remote
location through remote sensing technology and
Geographic Information System (GIS). The present study
highlights the importance of remote sensing technology and
GIS in detection of herbs located distantly.
Separability Analysis of Integrated Spaceborne Radar and Optical Data: Sudan ...rsmahabir
Abstract-The purpose of this study was to determine via spectral separability using divergence measures the best individual and combinations of various numbers of bands for five land cover/ land use classes along the Blue Nile in Sudan. The data for this analysis were a stack of 15 layers including RADARSAT-2 C-band and PALSAR L-band quad-polarized radar registered with ASTER optical data, as well as four variance texture measures extracted from the RADARSAT-2 images. Spectral signatures were obtained for each class and examined by various separability measures. This examination is useful for better understanding the relative value of different types of remote sensing data and best band combinations for possible visual analysis and for improving land cover/ land use classification accuracy. Results show that the best single band for analysis was the RADARSAT-2 VH variance texture measure. The best pair of bands was the ASTER visible red and the RADARSAT-2 HV variance texture, which also included the PALSAR VH band for the best three band combination, all bands being very different data types. Further, based upon the divergence values, only eight bands are needed to achieve maximum separation between land cover/ land use classes. Beyond this point, classification accuracy is expected to decrease, with as few as six bands needed to reach viable classification accuracy.
Similar to Analysis of reflectance spectra for identification of vegetation substance (20)
Development and Field Evaluation of a Multichannel LoRa Sensor for IoT Monito...Redmond R. Shamshiri
Evaluation of long-range wireless transceivers with respect to their power consumption, network connectivity, and coverage under extreme field conditions is necessary prior to their deployment in large scale commercial orchards. This paper reports on the development and field performance of an affordable multi-channel wireless data acquisition for IoT monitoring of environmental variations in berry orchards. A connectivity board was custom-designed based on the powerful dual-core 32-bit microcontroller with WiFi antenna and LoRa modulation at 868MHz. The objective was to verify the possibility of transmitting multiple sensor readings with lower power consumption while increasing the reliability and stability of wireless communication at long distances (over 1.7 km). Collected data from the wireless sensor was compared and found to be consistent with measurements of a data logger installed in the same locations. The presented paper highlights the advantages of LoRa sensors for digital agriculture and the experience in real-time monitoring of environmental parameters in berry orchards.
SunBot: Autonomous Nursing Assistant for Emission-Free Berry Production, Gene...Redmond R. Shamshiri
This paper is dedicated to the general concept and simulation framework used to develop an autonomous electric tractor-mower combination. Thus enabling preliminary studies and experiments to construct a functional model of an autonomous electric tractor that is capable of sensing the environment, navigate in shrubbery orchards, identify and avoid obstacles. For this cause a distributed ROS-based framework has been designed mirroring the modular control architecture of the different ECU’s and the main on-board controller. The applied V-REP, ROS simulation offers standard features such as hardware abstraction, low-level device control, commonly used functionalities, message-passing between processes, and package management. The framework reduces efforts in code and application development that can be shared by all sensors and actuators. The simulation framework was applied to tune algorithms, test and validate different sensing and control strategies.
Smart Management of Oil Palm Plantations with Autonomous UAV Imagery and Robu...Redmond R. Shamshiri
A Breakthrough in Oil Palm Precision Agriculture: Smart Management of Oil Palm Plantations with Autonomous UAV Imagery and Robust Machine Vision
Link to the publication
https://www.researchgate.net/publication/306348123_A_Breakthrough_in_Oil_Palm_Precision_Agriculture_Smart_Management_of_Oil_Palm_Plantations_with_Autonomous_UAV_Imagery_and_Robust_Machine_Vision
Development of a Field Robot Platform for Mechanical Weed Control in Greenhou...Redmond R. Shamshiri
A prototype robot that moves on a monorail along the greenhouse for weed elimination between cucumber plants was designed and developed. The robot benefits from three arrays of ultrasonic sensors for weed detection and a PIC18 F4550-E/P microcontroller board for processing. The feedback from the sensors activates a robotic arm, which moves inside the rows of the cucumber plants for cutting the weeds using rotating blades. Several experiments were carried out inside a greenhouse to find the best combination of arm motor (AM) speed, blade rotation (BR) speed, and blade design. We assigned three BR speeds of 3500, 2500, and 1500 rpm, and two AM speed of 10 and 30 rpm to three blade designs of S-shape, triangular shape, and circular shape. Results indicated that different types of blades, different BR speed, and different AM speed had significant effects (P < 0.05) on the percentage of weeds cut (PWC); however, no significant interaction effects were observed. The comparison between the interaction effect of the factors (three blade designs, three BR speeds, and two AM speeds) showed that maximum mean PWC was equal to 78.2% with standard deviation of 3.9% and was achieved with the S-shape blade when the BR speed was 3500 rpm, and the AM speed was 10 rpm. Using this setting, the maximum PWC that the robot achieved in a random experiment was 95%. The lowest mean PWC was observed with the triangular-shaped blade (mean of 50.39% and SD = 1.86), which resulted from BR speed of 1500 rpm and AM speed of 30 rpm. This study can contribute to the commercialization of a reliable and affordable robot for automated weed control in greenhouse cultivation of cucumber.
Fundamental Research on Unmanned Aerial Vehicles to Support Precision Agricul...Redmond R. Shamshiri
Unmanned aerial vehicles carrying multimodal sensors for precision agriculture (PA) applications face adaptation challenges to satisfy reliability, accuracy, and timeliness. Unlike ground platforms, UAV/drones are subjected to additional considerations such as payload, flight time, stabilization, autonomous missions, and external disturbances. For instance, in oil palm plantations (OPP), accruing high resolution images to generate multidimensional maps necessitates lower altitude mission flights with greater stability. This chapter addresses various UAV-based smart farming and PA solutions for OPP including health assessment and disease detection, pest monitoring, yield estimation, creation of virtual plantations, and dynamic Web-mapping. Stabilization of UAVs was discussed as one of the key factors for acquiring high quality aerial images. For this purpose, a case study was presented on stabilizing a fixed-wing Osprey drone crop surveillance that can be adapted as a remote sensing research platform. The objective was to design three controllers (including PID, LQR with full state feedback, and LQR plus observer) to improve the automatic flight mission. Dynamic equations were decoupled into lateral and longitudinal directions, where the longitudinal dynamics were modeled as a fourth order two-inputs-two-outputs system. State variables were defined as velocity, angle of attack, pitch rate, and pitch angle, all assumed to be available to the controller. A special case was considered in which only velocity and pitch rate were measurable. The control objective was to stabilize the system for a velocity step input of 10m/s. The performance of noise effects, model error, and complementary sensitivity was analyzed.
Research and development in agricultural robotics: A perspective of digital f...Redmond R. Shamshiri
Digital farming is the practice of modern technologies such as sensors, robotics, and data analysis for shifting from tedious operations to continuously automated processes. This paper reviews some of the latest achievements in agricultural robotics, specifically those that are used for autonomous weed control, field scouting, and harvesting. Object identification, task planning algorithms, digitalization and optimization of sensors are highlighted as some of the facing challenges in the context of digital farming. The concepts of multi-robots, human-robot collaboration, and environment reconstruction from aerial images and ground-based sensors for the creation of virtual farms were highlighted as some of the gateways of digital farming. It was shown that one of the trends and research focuses in agricultural field robotics is towards building a swarm of small scale robots and drones that collaborate together to optimize farming inputs and reveal denied or concealed information. For the case of robotic harvesting, an autonomous framework with several simple axis manipulators can be faster and more efficient than the currently adapted professional expensive manipulators. While robots are becoming the inseparable parts of the modern farms, our conclusion is that it is not realistic to expect an entirely automated farming system in the future.
An Overview of the System of Rice Intensification for Paddy Fields of MalaysiaRedmond R. Shamshiri
Objectives: The objective of this paper was to present a general overview of rice agronomic practices and transplanting operations by considering the interactions of soil, plant, and machine relationship in line with the System of Rice Intensification (SRI) cultivation practice. Methods: Some of the problems challenging Malaysian rice growers, as well as yield increase and total rice production in the last four decades, were first addressed and discussed. The trend in the world rice production between 1961 and 2014 was used to predict the production in 2020 and to show that Southeast Asian countries are expected to increase their production by 27.2%. Findings: A consistently increasing pattern from 3.1 tons/ha during 1981 to 4.1 tons/ha in 2014 was observed in the rice yield of Malaysia due to the advances in technology and improved farming operations coupled with integrated management and control of resources. Various literature were reviewed and their findings of the best transplanting practices were summarized to discuss how SRI contributes to the production of higher rice yield with improved transplanting practices through a more effective root system. Our review shows that wider spacing, availability of solar radiation, medium temperature, soil aeration, and nutrient supply promote shorter Phyllochrons which increase the number of tillers in rice. In this regard, modification and development of a transplanter that complies with SRI specification require determination of optimum transplanting spacing, seed rate, and planting pattern to significantly improve yield. Improvement: It was concluded that for maximum yield, the SRI method in Malaysia should emphasize on the planting of one seedling per hill with space of 0.25 m for optimum water consumption, nutrient and pest management.
Robotic Harvesting of Fruiting Vegetables: A Simulation Approach in V-REP, RO...Redmond R. Shamshiri
In modern agriculture, there is a high demand to move from tedious manual harvesting to a continuously automated operation. This chapter reports on designing a simulation and control platform in V-REP, ROS and MATLAB for experimenting with sensors and manipulators in robotic harvesting of sweet pepper. The objective was to provide a completely simulated environment for improvement of visual servoing task through easy testing and debugging of control algorithms with zero damage risk to the real robot and to the actual equipment. A simulated workspace, including an exact replica of different robot manipulators, sensing mechanisms, and sweet pepper plant, and fruit system was created in V-REP. Image moment method visual servoing with eye-in-hand configuration was implemented in MATLAB, and was tested on four robotic platforms including Fanuc LR Mate 200iD, NOVABOT, multiple linear actuators, and multiple SCARA arms. Data from simulation experiments were used as inputs of the control algorithm in MATLAB, whose output were sent back to the simulated workspace and to the actual robots. ROS was used for exchanging data between the simulated environment and the real workspace via its publish and subscribe architecture. Results provided a framework for experimenting with different sensing and acting scenarios, and verified the performance functionality of the simulator.
Choosing the Best UAV Drones for Precision Agriculture and Smart Farming: Agr...Redmond R. Shamshiri
Best Drones For Agriculture, Exploring agricultural drones, Agricultural Drone Technology, Agricultural Drones for Sale, Choosing the Best UAV Drones for Precision Agriculture and Smart Farming: Agricultural drone buyer’s guide for farmers and agriculture service professionals
An Introduction to Controlled Greenhouse Plant Production Systems For Tropica...Redmond R. Shamshiri
Introduction, Greenhouses in the Netherlands vs. Malaysia, Some Definitions, History, Simple fact yet ignored, Concept of Adaptive Solution applied to Greenhouse, Introduction to Greenhouse Automation and Control System Engineering, Open-field vs. Closed-field, Vegetable production in the highlands and lowlands of Malaysia Malaysian Strategy and Policy on Vegetable Production (2011-2020)
Robotic Harvesting of Fruiting Vegetables, “Acceleration by Simulation”Redmond R. Shamshiri
Robotic Harvesting of Fruiting Vegetables, “Acceleration by Simulation”
Presented at the Acceleration Workshop Robotics & Crop Sensing in Greenhouses, 11-12 September 2017. Delf University of Technology, The Netherlands
Robotic Harvesting with NOVABOT innovative manipulator
https://youtu.be/R38IoVcOVt0
Robotic Harvesting with multiple SCARA manipulators
https://youtu.be/TLLW3S-55ls
Robotic Harvesting with Array of Linear Actuators
https://youtu.be/iFu7FAxLvmg
Robotic Harvesting with fanuc lr mate 200id (Visual Servo Control in V-REP, ROS, MATLAB)
https://youtu.be/BwRBUeB812s
Robotic Harvesting, Simulation of Environment and Fruit/Plant Scan
https://youtu.be/XD3J7b0cDGM
Advanced Visual Servo Control in V-REP for Robotic harvesting of sweet pepper
https://youtu.be/VupoirQOL0Y
Robotic Harvesting of Sweet Pepper, Ubuntu, V-REP, ROS Environment Setup
https://youtu.be/tKagjNQ9FW4
Real-time, robust and rapid red-pepper fruit detection with Matlab
https://youtu.be/rFV6Y5ivLF8
Talk
https://youtu.be/QZawPeg3wEQ
Dynamic Assessment of Air Temperature for Tomato (Lycopersicon Esculentum) Cu...Redmond R. Shamshiri
Net-screen covered greenhouses operating on natural ventilation are used as a sustainable approach for closed-field cultivation of fruits and vegetables and to eliminate insect passage and subsequent production damage. The objective of this work was to develop a real-time assessment framework for evaluating air-temperature inside an insect-proof net-screen greenhouse in tropical lowlands of Malaysia prior to cultivation of tomato. Mathematical description of a growth response model was implemented and used in a computer application. A custom-designed data acquisition system was built for collecting 6 months of air-temperature data, during July to December 2014. For each measured air-temperature (T), an optimality degree, denoted by Opt(T), was calculated with respect to different light conditions (sun, cloud, night) and different growth stages. Interactive three-dimensional plots were generated to demonstrate variations in Opt(T) values due to different hours and days in a growth season. Results showed that, air temperature was never less than 25% optimal for early growth, and 51% for vegetative to mature fruiting growth stages. The average Opt(T) in the entire 6 months was between 65 and 75%. The presented framework allows tomato growers to automatically collect and process raw air temperature data and to simulate growth responses at different growth stages and light conditions. The software database can be used to track and record Opt(T) values from any greenhouses with different structure design, covering materials, cooling system and growing seasons, and to contribute to knowledge-based decision support systems and energy balance models.
Palestine last event orientationfvgnh .pptxRaedMohamed3
An EFL lesson about the current events in Palestine. It is intended to be for intermediate students who wish to increase their listening skills through a short lesson in power point.
Instructions for Submissions thorugh G- Classroom.pptxJheel Barad
This presentation provides a briefing on how to upload submissions and documents in Google Classroom. It was prepared as part of an orientation for new Sainik School in-service teacher trainees. As a training officer, my goal is to ensure that you are comfortable and proficient with this essential tool for managing assignments and fostering student engagement.
Welcome to TechSoup New Member Orientation and Q&A (May 2024).pdfTechSoup
In this webinar you will learn how your organization can access TechSoup's wide variety of product discount and donation programs. From hardware to software, we'll give you a tour of the tools available to help your nonprofit with productivity, collaboration, financial management, donor tracking, security, and more.
The French Revolution, which began in 1789, was a period of radical social and political upheaval in France. It marked the decline of absolute monarchies, the rise of secular and democratic republics, and the eventual rise of Napoleon Bonaparte. This revolutionary period is crucial in understanding the transition from feudalism to modernity in Europe.
For more information, visit-www.vavaclasses.com
Acetabularia Information For Class 9 .docxvaibhavrinwa19
Acetabularia acetabulum is a single-celled green alga that in its vegetative state is morphologically differentiated into a basal rhizoid and an axially elongated stalk, which bears whorls of branching hairs. The single diploid nucleus resides in the rhizoid.
Read| The latest issue of The Challenger is here! We are thrilled to announce that our school paper has qualified for the NATIONAL SCHOOLS PRESS CONFERENCE (NSPC) 2024. Thank you for your unwavering support and trust. Dive into the stories that made us stand out!
Introduction to AI for Nonprofits with Tapp NetworkTechSoup
Dive into the world of AI! Experts Jon Hill and Tareq Monaur will guide you through AI's role in enhancing nonprofit websites and basic marketing strategies, making it easy to understand and apply.
Biological screening of herbal drugs: Introduction and Need for
Phyto-Pharmacological Screening, New Strategies for evaluating
Natural Products, In vitro evaluation techniques for Antioxidants, Antimicrobial and Anticancer drugs. In vivo evaluation techniques
for Anti-inflammatory, Antiulcer, Anticancer, Wound healing, Antidiabetic, Hepatoprotective, Cardio protective, Diuretics and
Antifertility, Toxicity studies as per OECD guidelines
Macroeconomics- Movie Location
This will be used as part of your Personal Professional Portfolio once graded.
Objective:
Prepare a presentation or a paper using research, basic comparative analysis, data organization and application of economic information. You will make an informed assessment of an economic climate outside of the United States to accomplish an entertainment industry objective.
Analysis of reflectance spectra for identification of vegetation substance
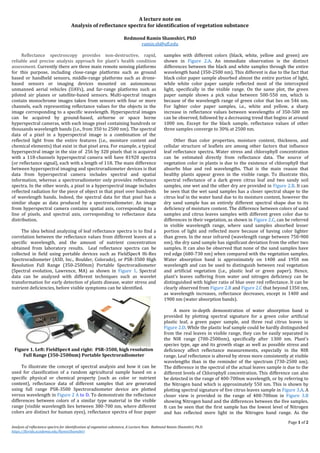
1. Page 1 of 2
Analysis of reflectance spectra for identification of vegetation substance, A Lecture Note. Redmond Ramin Shamshiri, Ph.D.
https://florida.academia.edu/RaminShamshiri
A lecture note on
Analysis of reflectance spectra for identification of vegetation substance
Redmond Ramin Shamshiri, PhD
ramin.sh@ufl.edu
Reflectance spectroscopy provides non-destructive, rapid,
reliable and precise analysis approach for plant’s health condition
assessment. Currently there are three main remote sensing platforms
for this purpose, including close-range platforms such as ground
based or handheld sensors, middle-range platforms such as drone-
based sensors or imaging devices mounted on autonomous
unmanned aerial vehicles (UAVs), and far-range platforms such as
piloted air planes or satellite-based sensors. Multi-spectral images
contain monochrome images taken from sensors with four or more
channels, each representing reflectance values for the objects in the
image corresponding to a specific wavelength. Hyperspectral images
can be acquired by ground-based, airborne or space borne
hyperspectral cameras, with each image pixel containing hundreds or
thousands wavelength bands (i.e., from 350 to 2500 nm). The spectral
data of a pixel in a hyperspectral image is a combination of the
reflected light from the entire features (i.e., moisture content and
chemical elements) that exist in that pixel area. For example, a typical
hyperspectral image in the size of 256 by 320 pixels that is acquired
with a 118-channels hyperspectral camera will have 81920 spectra
(or reflectance signal), each with a length of 118. The main difference
between hyperspectral imaging and spectroradiometer devices is that
data from hyperspectral camera includes spectral and spatial
information, whereas a spectroradiometer only provides reflectance
spectra. In the other words, a pixel in a hyperspectral image includes
reflected radiation for the piece of object in that pixel over hundreds
of wavelength bands. Indeed, the spectral data for that pixel has a
similar shape as data produced by a spectroradiometer. An image
from hyperspectral camera contains spatial axis, corresponding to a
line of pixels, and spectral axis, corresponding to reflectance data
distribution.
The idea behind analyzing of leaf reflectance spectra is to find a
correlation between the reflectance values from different leaves at a
specific wavelength, and the amount of nutrient concentration
obtained from laboratory results. Leaf reflectance spectra can be
collected in field using portable devices such as FieldSpec4 Hi-Res
Spectroradiometer (ASD, Inc., Boulder, Colorado), or PSR-3500 High
Resolution Full Range (350-2500nm) Portable Spectroradiometer
(Spectral evolution, Lawrence, MA) as shown in Figure 1. Spectral
data can be analyzed with different techniques such as wavelet
transformation for early detection of plants disease, water stress and
nutrient deficiencies, before visible symptoms can be identified.
Figure 1. Left: FieldSpec4 and right: PSR-3500, high resolution
Full Range (350-2500nm) Portable Spectroradiometer
To illustrate the concept of spectral analysis and how it can be
used for classification of a random agricultural sample based on a
specific physical or chemical property (such as color or nutrient
content), reflectance data of different samples that are generated
using full range PSR-3500 Spectroradiometer device are plotted
versus wavelength in Figure 2 A to D. To demonstrate the reflectance
differences between colors of a similar type material in the visible
range (visible wavelength lies between 380-700 nm, where different
colors are distinct for human eyes), reflectance spectra of four paper
samples with different colors (black, white, yellow and green) are
shown in Figure 2.A. An immediate observation is the distinct
differences between the black and white samples through the entire
wavelength band (350-2500 nm). This different is due to the fact that
black color paper sample absorbed almost the entire portion of light,
while white color paper sample reflected most of the intercepted
light, specifically in the visible range. On the same plot, the green
paper sample shows a pick value between 500-550 nm, which is
because of the wavelength range of green color that lies on 546 nm.
For lighter color paper samples, i.e., white and yellow, a sharp
increase in reflectance values between wavelengths of 350-500 nm
can be observed, followed by a decreasing trend that begins at around
1000 nm. Except for the black sample, reflectance values of other
three samples converge to 30% at 2500 nm.
Other than color properties, moisture content, thickness, and
cellular structure of leaflets are among other factors that influence
leaf reflectance spectra. Water stress and chlorophyll concentration
can be estimated directly from reflectance data. The source of
vegetation color in plants is due to the existence of chlorophyll that
absorbs blue and red wavelengths. That is the main reason that
healthy plants appear green in the visible range. To illustrate this,
spectral reflectance of a dark green citrus leaf and two sandy soil
samples, one wet and the other dry are provided in Figure 2.B. It can
be seen that the wet sand samples has a closer spectral shape to the
citrus leaf in the water band due to its moisture content, however the
dry sand sample has an entirely different spectral shape due to its
deficiency of moisture content. The difference between colors of sand
samples and citrus leaves samples with different green color due to
differences in their vegetation, as shown in Figure 2.C, can be referred
in visible wavelength range, where sand samples absorbed lesser
portion of light and reflected more because of having color lighter
than green. In the near infrared (wavelength range between 750-900
nm), the dry sand sample has significant deviation from the other two
samples. It can also be observed that none of the sand samples have
red edge (680-730 nm) when compared with the vegetation samples.
Water absorption band is approximately on 1400 and 1950 nm
wavelength and can be used to distinguish between real vegetation
and artificial vegetation (i.e., plastic leaf or green paper). Hence,
plant’s leaves suffering from water and nitrogen deficiency can be
distinguished with higher ratio of blue over red reflectance. It can be
clearly observed from Figure 2.B and Figure 2.C that beyond 1350 nm,
as wavelength increases, reflectance decreases, except in 1400 and
1900 nm (water absorption bands).
A more in-depth demonstration of water absorption band is
provided by plotting spectral signature for a green color artificial
plastic leaf, a green paper sample, and three real citrus leaves in
Figure 2.D. While the plastic leaf sample could be hardly distinguished
from the real leaves in visible range, they can be easily separated in
the NIR range (700-2500nm), specifically after 1300 nm. Plant’s
species type, age and its growth stage as well as possible stress and
deficiency affect reflectance measurements, especially in the NIR
range. Leaf reflectance is altered by stress more consistently at visible
wavelengths than in the reminder of the spectrum (730-2500 nm).
The difference in the spectral of the actual leaves sample is due to the
different levels of Chlorophyll concentration. This difference can also
be detected in the range of 400-700nm wavelength, or by referring to
the Nitrogen band which is approximately 550 nm. This is shown by
plotting spectral signature of five citrus leaves sample in Figure 3.A. A
closer view is provided in the range of 400-700nm in Figure 3.B
showing Nitrogen band and the differences between the five samples.
It can be seen that the first sample has the lowest level of Nitrogen
and has reflected more light in the Nitrogen band range. As the
2. Page 2 of 2
Analysis of reflectance spectra for identification of vegetation substance, A Lecture Note. Redmond Ramin Shamshiri, Ph.D.
https://florida.academia.edu/RaminShamshiri
amount of nitrogen increases in the leaves samples, the chlorophyll
content also increase in proportion and reflectance decreases. In fact,
a substantial amount of Nitrogen concentration is because of the
chlorophyll content. Nitrogen band is therefore used as an accurate
representation of plant vegetation status. Available commercial
cholorophyll meters that measures green color of leaflet sample are
not accurate due to their inconsistent readings caused by variability
in light source (shade, cloud, sunlight intensity). Other lower cost
instruments such as SPAD-502Plus uses red and NIR regions to
measure leaf absorbance, where absorbance is equal to
log(1/reflectance). SPAD calculates Ratio Vegetation Index (NIR/R), a
numerical value using R and NIR absorbance that is proportional to
the level of chlorophyll content in the leaf, and can be used for
assessing plant’s health condition. Another approach to distinguish
the differences between Chlorophyll concentration in samples is the
Normalized Difference Vegetation Index (NDVI), defined as
. Here, NIR is the near-infrared band
(740-760 nm) reflectance and R is the red band (640-620 nm)
reflectance. It can be implied from this index that higher NIR
reflectance and lower red reflectance values are resulted from yellow
or brown leaves. Therefore NDVI is a good indication for determine
growth stage (age), leaf area index and to some extend health state of
the plant. An example of such application includes identification of
infected and healthy wheat plots using NDVI. Other optical properties
of leaves around 700 nm and associations with stress detection,
chlorophyll content estimation, and physiological conditions of the
plant in blue-green (400-630 nm) and red to far red (630-800 nm)
can be addressed from correlating reflectance spectra with ground-
truth laboratory results.
Figure 2. Reflectance spectra of different substances, A: color paper, B:
sand and citrus leaf, C: different color citrus leaves, D: plastic leaf vs.
actual citrus leaves and a green paper
Figure 3. Differences in reflectance spectra of citrus leaves due to
different levels of Nitrogen
100 400 700 1000 1300 1600 1900 2200 2500
0
20
40
60
80
Wavelength (nm)
Reflectance(%)
GreenPaper
YellowPaper
WhitePaper
BlackPaper
A
100 400 700 1000 1300 1600 1900 2200 2500
-20
0
20
40
60
80
Wavelength (nm)
Reflectance(%)
WetSand
DrySand
DarkGreenLeaf
B
100 400 700 1000 1300 1600 1900 2200 2500
-10
0
10
20
30
40
50
Wavelength (nm)
Reflectance(%)
YellowGreenLeaf
LightGreenLeaf
DarkGreenLeaf
C
100 400 700 1000 1300 1600 1900 2200 2500
-30
-20
-10
0
10
20
30
40
50
60
Wavelength (nm)
Reflectance(%)
ArtificialLeaf
DarkGreenLeaf
LightGreenLeaf
YellowGreenLeaf
GreenPaper
D
400 600 800 1000 1200 1400 1600 1800 2000 2200 2500
0
10
20
30
40
50
60
Wavelength (nm)
Reflectance(%)
N5 (3.38%)
N4 (2.97%)
N3 (2.81%)
N2 (2.63%)
N1 (2.33%)
400 500 600 700
8
10
12
14
16
18
20
22
24
Wavelength (nm)
Reflectance(%)
N5 (3.38%)
N4 (2.97%)
N3 (2.81%)
N2 (2.63%)
N1 (2.33%)