
Recommended
More Related Content
What's hot
What's hot (20)
Similar to ANALYSIS OF AN I BEAM SUBJECTED TO UNIFORM VARYING LOAD
Similar to ANALYSIS OF AN I BEAM SUBJECTED TO UNIFORM VARYING LOAD (20)
More from SharathKumar528
More from SharathKumar528 (20)
Recently uploaded
Recently uploaded (20)
ANALYSIS OF AN I BEAM SUBJECTED TO UNIFORM VARYING LOAD
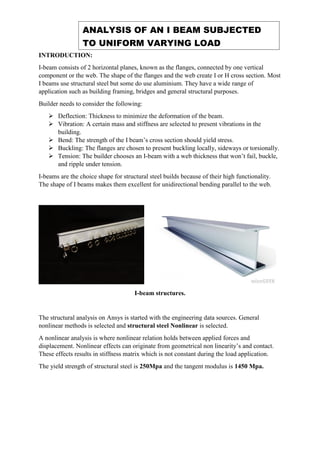
- 1. INTRODUCTION: I-beam consists of 2 horizontal planes, known as the flanges, connected by one vertical component or the web. The shape of the flanges and the web create I or H cross section. Most I beams use structural steel but some do use aluminium. They have a wide range of application such as building framing, bridges and general structural purposes. Builder needs to consider the following: Deflection: Thickness to minimize the deformation of the beam. Vibration: A certain mass and stiffness are selected to present vibrations in the building. Bend: The strength of the I beam’s cross section should yield stress. Buckling: The flanges are chosen to present buckling locally, sideways or torsionally. Tension: The builder chooses an I-beam with a web thickness that won’t fail, buckle, and ripple under tension. I-beams are the choice shape for structural steel builds because of their high functionality. The shape of I beams makes them excellent for unidirectional bending parallel to the web. I-beam structures. The structural analysis on Ansys is started with the engineering data sources. General nonlinear methods is selected and structural steel Nonlinear is selected. A nonlinear analysis is where nonlinear relation holds between applied forces and displacement. Nonlinear effects can originate from geometrical non linearity’s and contact. These effects results in stiffness matrix which is not constant during the load application. The yield strength of structural steel is 250Mpa and the tangent modulus is 1450 Mpa. ANALYSIS OF AN I BEAM SUBJECTED TO UNIFORM VARYING LOAD
- 2. Selection of materials and type of analysis Geometry: I-beam W4x4 from is taken as the component for analysis. I-beam details In the design modeller, I section is selected and the values for the I-beam are plugged into from and the sketch is extruded to 500mm and is chamfered at the 4 edges. Chamfering provides external strength to external corners (removes stress concentration) Applied to the outer edges to break the corner.ie remove sharp edges which may hurt the person handling it.
- 3. Extruded image of the I-beam Modelling: Here the material of the I-beam is assigned as structural steel nonlinear. Meshing: Fine meshing is selected, element size is defined to be 5 mm and mesh is generated. Since the case is loading and unloading, the number of steps is selected to be 2. Time stepping is selected to ‘ON’. Initial sub steps, minimum sub steps are assigned to 30, Maximum sub steps is chosen to be 100. Large deflection is selected to ON. Mesh with 12600 elements and fine face meshing
- 4. Mesh parameters The reason why sub step is considered is to understand the plastic deformation better. These sub steps will breakdown the load even more. For plastic deformation, large deflection is preferred. Boundary conditions: Fixed support is inserted at one end of the beam. Pressure is inserted on the top face of the beam. Magnitude for this selected as tabular as it is uniformly distributed. The tables are corrected for time values of different loading and unloading conditions. 4Mpa is selected at interval 2, and is distributed along Z axis for interval 0,1 and 2 .
- 5. Boundary conditions applied to the I-beam This model is then run for force convergence, it took a long time and created a huge file. Convergence value is less than criterion value, which suggests a right result. Force Convergence Value: This is the unbalanced "error" force that is a result of the changing stiffness of the model caused by either geometric, material or contact nonlinearities. The residual is the difference between the applied load and the summation of internal forces of the equilibrium iteration. The program calculates this automatically with no user input required. Tracking rate of change in residual vs. changes in solution settings is an excellent way of optimizing solution efficiency.
- 6. Results: Stress is inserted to be equivalent to equivalent von Moises. Strain is selected to be equivalent total. They are then evaluated. Von Moises stresses on the I-beam, 314.61 being maximum stress which is more than yield stress, therefore there is deformation in the I-beam. Stresses are seen mostly in the fixed end and the free end is free from all the stresses.
- 7. Total strain is seen highest on the edges of the fixed end and seen least in the point farthest from the fixed end. Stress vs time graph for the loading and the unloading cycle, at <250 Mpa is beam is seen to fail which is true due to the fact that 250 Mpa is the yield strength.
- 8. Strain vs time graph, the beam shows significant deformation from time 0.8sec and at unloading condition the strain seems to reduce by a small amount. Graph between stress and strain for loading and unloading condition
- 9. Summary of all the results A mesh node is created to find the maximum and the minimum stress and strain at a given point.The 2 values are selected and plot is generated between the maximum strain and the maximum stress. All the other values such as time are omitted in the plot parameters. Challenges in doing the mini project: Since the allocated disk space is low, most of the Ansys files crash before saving. I had to use a hard disk to save all my data. Creating a uniform distributed load was a difficult task that needed some research. Object Name Equivalent Stress Equivalent Total Strain Equivalent Stress 2 Equivalent Total Strain 2 State Solved Scope Scoping Method Geometry Selection Geometry All Bodies 1 Node Definition Type Equivalent (von-Mises) Stress Equivalent Total Strain Equivalent (von-Mises) Stress Equivalent Total Strain By Time Display Time Last Calculate Time History Yes Identifier Suppressed No Integration Point Results Display Option Averaged Average Across Bodies No Results Minimum 1.0493e-004 MPa 7.2653e-010 mm/mm 30.737 MPa 5.6156e-002 mm/mm Maximum 314.61 MPa 0.12072 mm/mm 30.737 MPa 5.6156e-002 mm/mm Minimum Occurs On Solid Maximum Occurs On Solid Minimum Value Over Time Minimum 1.0493e-004 MPa 7.2653e-010 mm/mm 11.648 MPa 5.8242e-005 mm/mm Maximum 2.9884e-002 MPa 2.507e-007 mm/mm 331.86 MPa 5.7662e-002 mm/mm Maximum Value Over Time Minimum 21.721 MPa 1.086e-004 mm/mm 11.648 MPa 5.8242e-005 mm/mm Maximum 424.66 MPa 0.12216 mm/mm 331.86 MPa 5.7662e-002 mm/mm Information Time 2. s Load Step 2 Substep 4 Iteration Number 64
- 10. Further work: With more computational cost time, an increased mesh will better the existing results and also increased loading and unloading time steps could better the result. Meshing using different shapes can be experimented to see the results. References: 1. https://caeai.com/blog/stress-analysis-convergence-tips-dummies 2. http://www.soscoqatar.net/productdisplay.aspx?cid=5 3. http://www.padtinc.com/blog/the-focus/to-use-large-deflection-or-not-that-is-the- question 4. https://www.femto.eu/stories/linear-non-linear-analysis-explained/ 5. https://blog.swantonweld.com/i-beams-in-structural-steel-construction