An Analysis Of Volcanic SO2 And Ash Emissions From Copahue Volcano
•
0 likes•2 views

This document analyzes volcanic SO2 and ash emissions from Copahue volcano in Argentina during 2016. It presents dispersion modeling of the volcanic plume using satellite data and analysis of ash collected at a health center. The average SO2 emission rate was 985.7 ± 492.9 t/d and average ash emission rate was 2.6 x 10³ kt/d. Ash leachate analysis found major contents of sodium, calcium, magnesium, and sulfate, chloride, and fluoride anions. Traces of other elements were also detected. Good agreement was observed between modeled plumes and satellite data of SO2 and aerosols.

Recommended
Recommended
More Related Content
Similar to An Analysis Of Volcanic SO2 And Ash Emissions From Copahue Volcano
Similar to An Analysis Of Volcanic SO2 And Ash Emissions From Copahue Volcano (20)
More from Claire Webber
More from Claire Webber (20)
Recently uploaded
Recently uploaded (20)
An Analysis Of Volcanic SO2 And Ash Emissions From Copahue Volcano
- 1. Journal of South American Earth Sciences 110 (2021) 103365 Available online 21 May 2021 0895-9811/© 2021 Elsevier Ltd. All rights reserved. An analysis of volcanic SO2 and ash emissions from Copahue volcano P.A. Paez a,* , M.G. Cogliati b , A.T. Caselli c,d , A.M. Monasterio e a Universidad Nacional de Río Negro, Centro de Investigaciones y Transferencia de Río Negro, Río Negro, Argentina b Universidad Nacional del Comahue, Departamento de Geografía, FACIAS - FAHU, Argentina c Universidad Nacional de Río Negro, Instituto de Investigación en Paleobiología y Geología, Río Negro, Argentina d Consejo Nacional de Investigaciones Científicas y Técnicas (CONICET), Río Negro, Argentina e Centro de Salud Caviahue, Ministerio de Salud Neuquén (Health Center of Caviahue, Ministry of Health, Neuquén, Argentina A R T I C L E I N F O Keywords: Copahue volcano HYSPLIT Volcanic ash Ash leachate SO2 Remote sensing A B S T R A C T During 2016, Copahue volcano (Neuquén, Argentina) made several eruptions and emitted ash and gases. This paper presents an analysis of the volcanic plume using dispersion models, remote sensor data, and analysis of sedimentary ash collected at the Caviahue Health Center from early October to 21st December 2016. Water- soluble elements contained in volcanic ash leachates were quantified. We have carried out a qualitative com- parison of HYSPLIT dispersion simulations with SO2 and aerosol data obtained from OMI and OMPS sensor on board of AURA and SUOMI NPP satellites, as well as between modeled concentrations and sampled surface sediments. Good agreement was observed between gas dispersion plumes from HYSPLIT and total column SO2 values, as well as between volcanic ash plumes and satellite aerosol indices. The average SO2 emission rate in the analyzed events was 985.7 ± 492.9 t/d and the average emission rate of ash 2.6 103 kt/d (2.9 104 kg/s). In situ observations of ash deposition rates peaked at 0.23 g/h on 30th November. The average measured deposition rate from 1st October to 21st December was 0.12 g/h, consistent with modeled values. The geochemical analysis of ash leachate showed major content of sodium (Na), calcium (Ca) and magnesium (Mg) with 207.8 mg/kg, 209.5 mg/kg, and 195.3 mg/kg, respectively. Concentrations sulfate, chlorides, and fluoride anions were 990.7 mg/kg, 352.34 mg/kg, and 129.15 mg/kg, respectively. The SO2/HCl molar ratio was 1.05. In addition, traces of As, Cr, Hg, Mo, Pb, and Se were detected in concentrations ranging from 0.2 mg/kg to 6.0 mg/kg. 1. Introduction Volcanic eruptions eject aerosols and gases into the troposphere. During major events, they can even reach the stratosphere. The intensity and duration of volcanic events are quite variable and so are the effects of those events on the environment and human populations (Kerminen et al., 2011; Stuefer et al., 2013). Human activities and livelihoods are also affected, with consequent socio-economic impacts (Barberi et al., 1984; Prata, 2009; Wilson et al., 2014) In the past years, frequent volcanic eruptions in the Southern Andes dis- rupted air and land traffic and had significant environmental and socio- economic impacts on nearby communities in Argentina and Chile. Some of these eruptions include Copahue in 2000 (Delpino and Bermúdez, 2002); Chaitén in 2008 (Watt et al., 2009); or Puyehue Cordón Caulle in 2011 (Eli- ssondo et al., 2016). The eruption of the Puyehue-Cordón Caulle volcanic complex in June 2011 (40◦ 30′ S–72◦ 12′ W) affected areas surrounding the volcanic complex in southern Chile and the Patagonian steppe (Wilson et al., 2013; Elissondo et al., 2016). This eruption dispersed pyroclastic material until June 2012, which devastated river macro-invertebrates (Fuentes et al., 2020), caused the death of grazing animals and the interruption of basic ser- vices -e.g., water, electric power, wastewater treatment, among others- (Wil- son et al., 2013). Bubach et al. (2014, 2020) evaluated the concentration of sulfur, selenium and heavy metals in lichens, to determine the atmospheric pollution associated with volcanic activity in the Southern Andean Volcanic zone (SVZ) (volcanic complexes Copahue-Caviahue and Puyehue-- Cordón-Caulle). S and Se were detected at all measurement sites around the Copahue-Caviahue area sulfur concentrations in lichens were several times higher than those reported in other volcanoes studies (2800-12000 μg/g vs 600–2800 μg/g) (Bubach et al., 2020). Meanwhile, near the Puyehue-Cordón Caulle volcano, sulfur concentrations were 20% higher (Bubach et al., 2014) * Corresponding author. E-mail addresses: ppaez@unrn.edu.ar (P.A. Paez), marisa.cogliati@fahu.uncoma.edu.ar (M.G. Cogliati), atcaselli@unrn.edu.ar (A.T. Caselli), doctoramonasterio@ hotmail.com (A.M. Monasterio). Contents lists available at ScienceDirect Journal of South American Earth Sciences journal homepage: www.elsevier.com/locate/jsames https://doi.org/10.1016/j.jsames.2021.103365 Received 31 May 2020; Received in revised form 10 April 2021; Accepted 28 April 2021
- 2. Journal of South American Earth Sciences 110 (2021) 103365 2 Volcano emissions include volcanic ash, gases (water vapor (H2O), carbon dioxide (CO2), sulfur dioxide (SO2), carbon monoxide (CO), hydrogen sulfide (H2S), carbon sulfide (CS), carbon disulfide (CS2), hydrogen chloride (HCl), hydrogen (H2), methane (CH4), hydrogen fluoride (HF), and hydrogen bromide (HBr), among other gases. Vol- canoes emit a variety of organic compounds, as well as traces of alkali metals, alkaline earth metals, and transition metals (Hansell and Oppenheimer, 2004; Bubach et al., 2020). Sulfur gases are one of the most abundant species in volcanic eruptions. The relative abundance of sulfur depends on the thermodynamic characteristics of the volcanic system (pressure, temperature, and oxygen fugacity) (Alessandro, 2006). Species abundance depends on the balance between a hydrous fluid (exsolved gas) at the top and a silicate melt in the magma chamber below (Symonds et al., 1994). It varies widely among volcanoes depending on magma type and volcano activity (Symonds et al., 1988; Textor et al., 2004). Sulfur dioxide is a colorless gas with a characteristic odor that can be perceived at different concentration levels, generally from 0.3 to 1.4 ppm, depending on individual sensitivity. It is easily detectable at 3.0 ppm (Alessandro, 2006), and its toxic level for continuous exposure is 10.0–15.0 ppm (IVHHN, 2020). The atmospheric half-life of sulfur di- oxide is 6–24 h; consequently, only about 5% of the gas emitted is found in the lower atmosphere after 1–4 days (Finlayson-Pitts and Pitts, 1986). Moreover, sulfur represents a major concern worldwide because of its potential effects on climate (Li et al., 2013; Wang et al., 2018). Copahue is considered a very active volcanic system since 13 erup- tive events have been recognized over the past 260 years (Delpino and Bermúdez, 1993; Delpino and Bermúdez, 2002; Naranjo and Polanco, 2004; Caselli et al., 2016a). The current eruptive cycle began on 19th July 2012 (Daga et al., 2017) and is still ongoing (GVP, 2021). Emissions from this ongoing eruptive cycle include sulfur dioxide (SO2) gas and ash plumes (e.g., Petrinovic et al., 2014, Caselli et al., 2016a; Daga et al., 2017; GVP, 2021). Previous studies of Copahue volcano focused on field observations and geophysical and geochemical monitoring of fumaroles and water springs and the characteristics of eruptive events (Petrinovic et al., 2014; Augusto and Vélez, 2017; Caselli et al., 2017; Daga et al., 2017; and Tassi et al., 2017). Ruggieri et al. (2011) assessed the po- tential contribution of volcanic ash to the local geochemical balance -during the Copahue eruption in 2000. More recently, Bia et al. (2020) analyzed 2016 Copahue ash and determined the amount, conditions, and release rate of fluoride from volcanic ash exposed to water by analyzing ash leachates. Tassi et al. (2017) studied the chemical and isotopic composition of hydrothermal gases emitted in the surroundings of Copahue volcano from fumaroles in the active summit crater from 1976 to February 2016. They observed that H2, CO and light hydrocarbon concentrations had increased in connection with major events of the latest eruptive cycle. Agusto and Vélez (2017) examined fumarolic emissions from the crater of Copahue volcano and surrounding thermal areas using an alkaline trap, Multi-GAS and parallel register with an UV camera; they found sulfur enrichment and presence of HCl, HF, and HBr. The content of sulfur and ash in near surface air is causing concern at Caviahue Health Center given that released sulfur oxides and ashes could be related to respira- tory diseases, e.g., sulfur oxides react with sunlight, atmospheric gases and aerosols, and become volcanic smog or “vog”, which is potentially hazardous for human health (Pattantyus et al., 2018). This study of Copahue emissions is driven by the evidence of strong past sulfur emissions and sustained eruptive episodes, and the risk for people in the region. Emissions of volcanic ash and gases can be evaluated using satellite imagery (Krueger, 1983; Carn and Krotkov, 2016) or in situ measure- ments of ash deposition by analyzing the leachates of materials adsorbed in ash (Witham et al., 2005). Satellite measurements provide an inter- esting approach as they show an area at a time and are able to collect extensive time-series. The first satellite measurements of aerosols, SO2, and volcanic ash date back to the 1990s. Those measurements were made with the UV-VIS spectrometer of the Total Ozone Mapping Spec- trometer (TOMS). However, it was useful only for large volcanic erup- tions and extreme SO2 degassing events (Krueger, 1983; Carn and Krotkov, 2016). At present, remote sensors have improved sensitivity (Carn et al., 2016); some of these sensors are for instance, the Ozone Monitoring Instrument (OMI; Lopez et al., 2013; Carn and Krotkov, 2016; Krotkov et al., 2016), the Moderate Resolution Imaging Spec- troradiometer (MODIS; Theys et al., 2013; Watson et al., 2004), the Global Ozone Monitoring Experiment (GOME – GOME2), the Infrared Atmospheric Sounding Interferometer (IASI) (Theys et al., 2013), and the most recent Tropospheric Monitoring Instrument (TROPOMI) on board of Precursor Sentinel-5 satellite, which was launch in 2016 (Carn and Krotkov, 2016). Increased sensitivity makes it possible to generate long-term aerosol records and climatology (Carn and Prata, 2010). Other methods include the comparison of modeled dispersion of volca- nic ash with satellite images (Gray and Bennartz, 2015; Chai et al., 2017; Pardini et al., 2017). The analysis of leachates adsorbed on fine-grained ash particles in volcanic ash samples provides information about the composition of gases (Witham et al., 2005). Fine ash can adsorb and thus quickly remove volatile elements from the emissions, such as sulfur, halogens, and metal species in the form of soluble salts (Bagnato et al., 2011). Water-soluble elements from ash found at land surface constitute an indirect source of information about the composition of volcanic ash, when in situ sampling is not possible. Batch water leachate tests allow assessing environmental geochemical risks of ash fall, by examining the release of soluble ash compounds into the environment. Such releases can cause short-term though potentially significant impacts on the environment (Ruggieri et al., 2011; Stewart et al., 2020). This paper presents the study of Copahue volcano ash and SO2 gas emissions from 1st October to 21st December 2016; to determine the scope of emissions and deposition through dispersion models, and to quantify and describe sampled volcanic ash through the concentration of soluble elements present in volcanic ash leachates. 2. Study area Copahue volcano is located at the border between Argentina and Chile (37◦ 45′ S; 71◦ 10.2’ W; 2997 m asl). Its most recent eruptive cycle began on 19th July 2012 and was still ongoing at the time of writing this article (Caselli et al., 2016a; Agusto and Vélez, 2017; GVP, 2021). Most events are phreatic and phreato-magmatic with low explosive character; nevertheless, such eruptions represent a threat for the communities living in the areas surrounding the emission center. (Caselli et al., 2016a, 2016b, 2016c). Moreover, increasing urban development implies that even relatively small phreatomagmatic explosions could cause sub- stantial economic losses and put lives at risk (Caselli et al., 2016a). Argentine villages, Caviahue and Copahue (Fig. 1), have so far only experienced ash fallout and gasses emissions, but are also at risk because of possible mudflows and flank collapse triggered by volcanic activity (Bermúdez and Delpino, 1995; Caselli et al., 2016b). Copahue is a stratovolcano with nine craters clustered along a belt, with mainly andesitic to basaltic andesite lavas that have spread down its flanks. The easternmost crater is the only one active at present with a hot and acid lake (pH < 1; 32–40 ◦ C) and two hot acid springs (pH = 1–2) located at 7 and 9.5 km to the northeast and east, respectively (Varekamp et al., 2001; Naranjo and Polanco, 2004). The crater lake originated from the interaction between acid magmatic/hydrothermal gases and meteoric water from the melting of a nearby glacier (Vare- kamp et al., 2001). In 2016, from 1st October to 31st December, the National Service of Geology and Mining of Chile (SERNAGEOMIN, by its acronym in Spanish) declared a yellow alert for Copahue volcano, based on its ac- tivity (SERNAGEOMIN, 2016a, 2016b; 2016c, 2016d, 2016e, 2016f). During this period, 8.5% of seismic events recorded were classified as volcanic-tectonic (VT) and associated with rigid material fracture P.A. Paez et al.
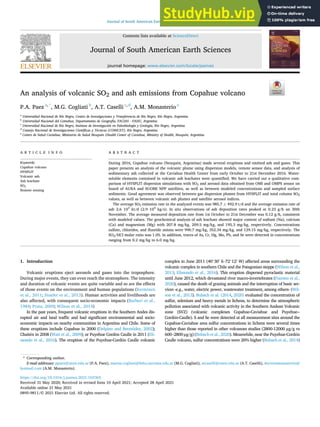
- 3. Journal of South American Earth Sciences 110 (2021) 103365 3 processes, whereas 91.5% were associated with fluid dynamics within the volcano (e.g., long-period (LP) and very long-period seismicity (VLP)). In the same period, the MIROVA program (Middle Infrared Observation of Volcanic Activity) emitted several thermal alerts. This paper analyzes the volcanic plume emitted in the period 1st October – 31st December 2016, to take advantage of the coexistence of a moni- toring program led by health authorities and information on volcanic activity. 3. Materials and methods To achieve our goal, we (1) estimated ash and SO2 gas emission rates from the Ozone Monitoring Instrument (OMI) and methodologies developed by Theys et al. (2013) and Mastin (2014); (2) obtained samples and performed a geochemical analysis of volcanic ash from passive samples in this period; (3) examined the plume dispersion using the Hybrid Single Particle Lagrangian Integrated Trajectory model (HYSPLIT); (4) assessed eruption events from remotely sensed data; and (5) evaluated chemical composition of volcanic ash leachates. 3.1. Emissions Ash and gases were released during the study period and the infor- mation was compiled by The Global Volcanism Program (GVP) (GVP, 2016a; 2016b, 2016c; 2016d, 2016e, 2016f, and 2016g) based on sat- ellite images and in situ photographs. SO2 gas, water vapor, and ash plumes released into the atmosphere were intermittently detected and reported by different institutions, such as SERNAGEOMIN, NASA, Observatorio Argentino de Vigilancia Volcánica (OAVV) and informed by GVP during the period studied. Observations were made with IP cameras installed by SERNAGEOMIN near the volcano to record constant degassing from El Agrio crater (SERNAGEOMIN, 2016a), Differential Optical Absorption Spectrometry (DOAS) instrument at Mellizas station (located 5 km to the east-northeast (ENE) of the active crater), satellite imagery and overflights, among others. Table 1 lists the dates, duration, plume height, and main plume composition of the eruptive events considered in the present paper. Copahue volcano emitted sulfur dioxide (SO2) continuously, with varying concentration during the period under study. Those emissions were recorded with a DOAS instrument at Mellizas station, installed by SERNAGEOMIN. To complete this study, ground-based samples and remote sensing data were analyzed to determine the duration of the event, as well as the plume emission and its altitude. The analysis included SO2 and aerosol data acquired with the Ozone Monitoring In- strument (OMI) installed on board of the EOS-AURA satellite (Aura/ OMI) and Aerosol Index (AI) from OMPS remote sensor (Ozone Mapper Profiler Suite), Suomi NPP mission (Suomi National Polar-orbiting Partnership). The OMI sensor measures the Earth’s scattered light and solar radi- ation in a wavelength range between 270 and 500 nm, with 0.5–0.6 nm spectral resolution. AURA satellite has a near-polar orbit which enables daily coverage of the globe at a nominal pixel size of 13 × 24 km at nadir and 28 × 150 km at the extreme of the view angle (Levelt et al., 2006; Carn et al., 2007; Ge et al., 2016). The bands are combined to provide four sulfur dioxide estimates that are used to determine the column density, based on the vertical distribution of SO2 (NASA, 2008; Krotkov et al., 2016; Wang et al., 2018). The spatial resolution of the sensor is also adequate to detect air pollution in urban areas (Levelt et al., 2006; Carn et al., 2007; Carn and Krotkov, 2016; Li et al., 2017; Wang et al., 2018). OMI had a reduced viewing capability because of a row anomaly, which limited spatial coverage. This row anomaly has been varying and its rate of expansion has slowed down since July 2011 (Torres et al., 2018, OMI’s KNMI website: projects.knmi.nl/omi/research/produc- t/rowanomaly-background.php). SO2 and atmospheric aerosol estimates were acquired with the OMI sensor. The plume height or the center of mass altitude (CMA) is derived Fig. 1. a) Location of Copahue volcano, Caviahue Health Center (CHC) and nearby Caviahue and Copahue villages. b) Image of the volcanic plume acquired by satellite LANDSAT 8 on 3rd December 2016. P.A. Paez et al.
- 4. Journal of South American Earth Sciences 110 (2021) 103365 4 from the vertical distribution of SO2 at different heights: 0.9 km for the planetary boundary layer (PBL), 2.5 km for the lower troposphere layer (TRL), 7.5 for the middle troposphere (TRM) and 17 km for the upper troposphere and stratosphere (STL). SO2 data for each atmospheric layer are generated by means of principal components analysis (PCA) (NASA, 2008; Li et al., 2013, 2017). Ash presence was estimated from the OMI Aerosol Index (AI), frequently used for qualitative detection of absorbing aerosols (Levelt et al., 2006; Colarco et al., 2017). This method quantifies aerosol con- centration, using the spectral contrast between two absorption bands at 360 nm and 331 nm (Colarco et al., 2017). AI values higher than 1.0 indicate the presence of volcanic ash (Krotkov et al., 2012); negative values are associated with non-absorbing aerosols such as sulfate (Der- oubaix et al., 2013). The OMI satellite dataset was built following the scheme proposed in NASA (2008). Consequently, we included pixels with less than 0.8 cloud fraction, solar zenith angles less than 70◦ and central positions along the path, and excluded data affected by row anomaly. We then selected all the pixels within a radius of 80 km around the Copahue volcano. SO2 emission rates were calculated using the so-called transversal technique (Theys et al., 2013, 2019): a) From SO2 OMI estimated pixels, we selected those with presence of SO2 in a radius of 80.0 km from the emission source to infer the mean direction of the volcanic plume through the determination of a line linking the direction of the plume and the location of the volcano. b) SO2 mass (MSO2 (Mg)) was calculated following Spinei et al. (2010), considering the molar mass of SO2 gas (DU at 2.69 × 10¹⁶ mole- cules/cm2 ) and the cross section of the column measured by OMI sensor (13 × 24 km2 ). The uncertainty of the estimates of SO2 emissions through the OMI sensor is approximately 30% (Qu et al., 2019) c) Wind speed at the volcano height was obtained considering the emission height reported by Volcanic Ash Advisory Centers (VAAC) Buenos Aires and the atmospheric data available from NOAA Real- time Environmental Applications and Display sYstem (READY) data. d) Emission rates were estimated from the following equation: Fc = Mu L (1) where Fc is the mass emission rate (kg/s), M is the mass of emitted SO2 (kg), u is the wind speed (m/s) and L is the length of the volcanic plume (m). Emission rate results from Eq. (1) were compared with values informed by OVDAS (Observatorio Volcanológico de los Andes del Sur - SERNAGEOMIN) from DOAS instrument measurements. Sparks et al. (1997) correlated the mass eruption rate was with the plume height based on theoretical considerations and compilation of historical eruptions. Mastin et al. (2009) updated the compilation and obtained relationship (2). The mass emission rate (kg/s) in this paper was calculated considering the empirical equation given by Mastin (2014): M = 140 H 4.15 (2) where H is plume altitude (km asl). 3.2. Ash sample collection and analysis During the eruption episodes from October to mid-December 2016, the Caviahue Health Center of the Ministry of Health of the Province of Neuquén, implemented a sampling program for volcanic ash. The pro- gram followed the protocols developed by Stewart et al. (2013). Ash was collected in passive samplers –i.e., wide-mouth plastic receptacles with 28.5 cm diameter. Samples were then stored in hermetic plastic bags. Sediments were dried and weighted, and finally decanted into labeled hermetic plastic vessels. Table 2 describes the amount of ash deposited in the different sampling periods and the deposition rate (R (g/h) expressed as the relationship between ash sediment mass (g) and sam- pling duration (h). Ash geochemistry was determined by means of the leachate method suggested by Ruggieri et al. (2011) and Stewart et al. (2013). The batch of 30th November was selected for subsequent analysis, as it had the greatest number of samples to allow chemical characterization. The leachate solution was prepared with deionized water for a rapid deter- mination of potentially dangerous substances (Witham et al., 2005; Stewart et al., 2013). Table 1 Event duration (D), plume altitude (H km asl) and emission composition -Copahue volcano from 1st October to 23rd December 2016. Period (dd/mm) (year 2016) D (days) H (km) Emission/plume composition References 01/10–15/10 1 3.0 Weak gas and water vapor plumes with minor ash content. SERNAGEOMIN, 2016a (VAAC, 2016a; VAAC, 2016a) (9/10, pilot report) 15/10–26/10 26/10–01/10 4 3.0–6.1 Weak gas and water vapor plumes with minor ash content. (SERNAGEOMIN, 2016a, GVP, 2016a, VAAC, 2016b) (27/10, pilot report) 04/11–05/11 1 3.3–3.9 Gas and water vapor plumes with minor ash content. GVP, 2016b 07/11–08/11 1 3.3–3.9 Gas, water vapor and ash plumes. GVP, 2016b 09/11–12/11 2 3.3–3.6 Diffuse water vapor and ash plumes GVP, 2016c 16/11–18/11 3 3.3–3.6 Gas, water vapor and ash plumes GVP, 2016d 21/11–22/11 23/11–25/11 27/11–29/11 1 3 2 3.3–3.6 3.3–5.2 3.3–5.2 Diffuse water vapor and ash plumes GVP, 2016d GVP, 2016e 30/11–04/12 06/12 4 3.3–4.2 3.3–4.2 Diffuse water vapor and ash plume. GVP, 2016f 07/12–09/12 11/12 2 1 3.0–3.3 3.0–3.3 Diffuse plume of water vapor and ash. GVP, 2016g 13/12–20/12 7 3.0–3.9 Gas and ash. GPV, 2016h, 21/12–23/12 2 3.0–3.9 Gas and ash. (GVP, Global Volcanism Program, 2016i) Table 2 Volcanic ash sampling data: date, sampling time (t (h)), mass of the sediment (Mmta (g)), sedimentation rate (R (g/h)), deposition rate (D (g/m2 )) and HYS- PLIT estimated deposition (MHYS (g/m2 ) in t(h)). (sampler diameter - 28.5 cm). Date (dd/mm) (2016) t (h) Mmta (g) R (g/h) D (g/m2 ) MHys (g/m2 ) 28/10 28.0 1.05 0.038 16.5 >12.0 30/10 19.0 1.94 0.102 30.4 >45.0 02/11 11.0 1.15 0.104 18.0 >20.0 03/11 10.0 0.93 0.093 14.6 >10.0 05/11 48.0 6.72 0.140 105.3 >195.0 30/11 72.0 16. 69 0.232 261.6 >210.0 P.A. Paez et al.
- 5. Journal of South American Earth Sciences 110 (2021) 103365 5 The proportion of ash mass and deionized water was 1:20 mass/ volume (1 g of ash per 20 ml of deionized water) (Cronin et al., 2003; Cronin and Sharp, 2002). The ash-leachate compound was agitated for 90 min in a High-Density Polyethylene (HDPE) sealed vessel. The so- lution was settled for 10 min and then filtered through 0.45 μm nylon filters. Anions and cations were determined by means of ion chroma- tography, using the analytical Standard Method 4110 B (APHA et al., 2012) and ISO 14911:1998 (ISO, 1998). Heavy metal traces were quantified by inductively coupled plasma atomic emission spectroscopy (ICP-OES), following the guidelines of the analytical US EPA Method 200.7 (USEPA, 1997). 3.3. Atmospheric dispersion Considering the SO2 and ash mass emission rates described in the previous section, we modeled the dispersion of pollutants released by Copahue volcano under two emission scenarios: predominant content of SO2 and predominant content of volcanic ash, as suggested in literature (e.g., Lopez et al., 2013; Gray and Bennartz, 2015; Chai et al., 2017; Prata et al., 2017). For instance, Schneider et al. (1999) found evidence of independent dispersion of SO2 and ash in their study of the Chichón volcano (Mexico) eruption in 1982. The volcanic plume was modeled with HYSPLIT to estimate trans- port, dispersion and concentrations of volcanic ash and SO2 (e.g., Draxler and Hess, 1997; Stein et al., 2015). HYSPLIT is a hybrid Lagrangian dispersion model, developed by NOAA/ARL. It is used by some Weather Services and the VAAC to model airborne volcanic ash, with meteorological data provided by external models (e.g., Crawford et al., 2016; Chai et al., 2017). The dispersion of ash and SO2 plumes was modeled including dry and wet deposition of ashes. Model’s input data were: (1) meteorological data from the Global Data Assimilation System (GDAS) of the US Na- tional Environmental Prediction Centers (NCEP). USA. (2) Emission rates of ash and SO2 calculated from eq. (1); (3) Particle size distribution of ash was obtained from literature (Daga et al., 2017). The results included ash column with mass loadings (g/m2 ) and deposition rate (g/ m2 ) for ashes and plume, as well as surface concentration (mg/m3 ) for SO2. The size and mass fraction of emitted particles was estimated from literature. Daga et al. (2017) characterized the pyroclastic products emitted on 19th July 2012 and described the eruptive mechanism, which was consistent with a phreatomagmatic eruption. As the event described by those authors was the initial stage of the 2016 eruption event, we used their results of particle fractions as input data for our HYSPLIT simulations. A set of Copahue volcano events was selected considering the emission maxima shown in Tables 2 and 4. To complement the infor- mation, daily MODIS satellite imagery was used to detect gases and aerosols in the volcanic plume. Although polar orbit satellites would provide the most appropriate spatial resolution, the revisiting period did not coincide with all the analyzed days. The presence of clouds at the time of the satellite visit made it difficult to obtain the necessary data. Consequently, we selected the events of 5th, 18th, 27th October, and 5th November 2016 for the analysis of SO2 plumes and performed the analysis of ash plumes on those days as well as on the 1st December 2016. The MODIS imagery available was analyzed to discriminate SO2 and ash plumes (not shown), but because of the size of the plumes, cloudiness, and the spatial resolution of MODIS, the information retrieved from OMI and OMPS proved more accurate. 4. Results and discussion In this section we considered SO2 column retrievals from the current OMI SO2 algorithm at the same time and HYSPLIT dispersion model. Ash/aerosol column images were also obtained from the Aerosol Index (AI) values acquired by the Ozone Mapping and Profiler Suite (OMPS) on board of NASA-NOAA’s Suomi NPP satellite. As noted, when discussing SO2 detection, cloudiness represents a weakness to this tool. Another weakness is the lack of ability to identify the origin of partic- ulate matter. Consequently, when strong winds lift and transport large amounts of particulate matter from the land surface, and suspended particulate matter from the land mixes with volcanic ash, it becomes difficult to determine volcanic concentrations at levels close to the surface. This is the case of the study area -arid land with little vegetation cover-which facilitates sediment resuspension. 4.1. SO2 data and ash emissions This section presents emissions results and comparison with avail- able surface data. Table 3 presents values of AI, SO2 mass and total column SO2 (DU; 1 DU = 2.69 × 10¹⁶ molecules/cm2 ) on particular eruption days at each atmospheric layer PBL, TRL, TRM and STL from OMI sensor data. The relative maximum values of SO2 and AI were selected considering the area with significant presence of SO2 (in general greater than 13 km). The values of aerosol index and SO2 mass presented in Table 3 show that emissions in October and November contained more gases than ash. On the contrary, from 30th November to 21st December we observed rising amounts of ash with a decrease in gas levels. Table 4 shows the average and maximum SO2 emission rate provided by the Volcanic Activity Report (RAV) of the National Geological and Mining Service of Chile (SERNAGEOMIN) and the daily mass emission rate calculated using eq. (1). This result is presented in Table 4, as the daily mass emission rate of SO2 (Fc). The SO2 emission rates on 5th Oct, 18th Oct and 27th Oct were 754.2 t/d, 720.1 t d, and 1586.8 t/d, respectively. These results were similar to those obtained by SERNAGEOMIN using the DOAS instrument (SERNAGEOMIN, 2016a, 2016b; 2016c, 2016d, 2016e, 2016f) (see Table 4). The evolution observed in Table 4 is the same as in Table 3: during the October–November period, values of SO2 emission rates were higher than those observed in the period 30th November −21st December period. The uncertainty of the mass emission rate is approximately 50% and it includes uncertainties related to the SO2 columns, cutoff values used, SO2 losses and wind fields (Theys et al., 2013). The average ash mass eruption rate in the analyzed cases was 2.9 104 kg/s. The uncertainty in height calculation is difficult to quantify but Mastin et al. (2014) estimated it in tens percent or more. Besides, empirical equation (2) results in significant uncertainty when used to estimate mass fluxes because it does not consider local atmospheric temperature, humidity, or wind, which can affect plume height, espe- cially when eruptions are small (Sparks et al., 1997; Degruyter and Bonadonna, 2012). 4.2. SO2 dispersion Fig. 2 shows the dispersion of SO2 in the cases where SO2 prevailed in the emissions (5th, 18th, 27th Oct, 5th Nov, and 1st Dec). According to the HYSPLIT model, the plumes on the 5th and 27th October extended to the NE, in a narrow area, reaching 80 km in 3 h, with a SO2 concen- tration greater than 0.01 mg/m3 on 5th October; and 0.55 mg/m3 on 27th October, when the relative maximum was 32 km long in the NE direction with a relative maximum greater than 1 mg/m3 near Copahue village. The plume on 18th October had SW direction, with a maximum SO2 concentration of 0.1 mg/m3 . The direction of atmospheric transport on 5th November was SE with a peak concentration of 0.1 mg/m3 ob- tained from HYSPLIT results. Modeled SO2 plumes coincided in terms of location and direction with remotely sensed concentrations –i.e., OMI/ Aura detections of SO2 (Fig. 3). On the 18th and 27th October, maximum SO2 concentrations were observed downwind of the volcano with 1.0 mg/m3 dispersed over small areas near the crater. In both cases, after 1 h from the event, the plume P.A. Paez et al.
- 6. Journal of South American Earth Sciences 110 (2021) 103365 6 extension was less than 50 km. In the remaining events, average downwind concentration was 0.065 mg/m3 . This HYSPLIT estimate is in line with OMI estimates of total atmospheric column SO2 (see Figs. 2–3). The gas dispersion plumes obtained from HYSPLIT were qualita- tively tested against total column SO2 concentrations from OMI (see Figs. 2–3). Good agreement was observed between both estimates. In some of the events considered, the row anomaly blocked the coverage of the complete plume area. However, its behavior was inferred in all the cases (see Fig. 3). The November 5, 2020 event presented a diffuse pattern in OMI data but the relative maxima were aligned with the HYSPLIT plume direction. There was not much agreement between gas plume concentration obtained from HYSPLIT and total column SO2 concentration from OMI. However, the analysis of the wind profile revealed that wind at the vent level was over 40% stronger than on the other days analyzed. Stronger winds take SO2 away, so less SO2 remains right over the source but a longer downwind tail plume develops (Fio- letov et al., 2015). The volcano would produce a larger signal in mete- orological situations with weaker wind. Wind has no impact on the emission rate, but it does spread SO2 over larger areas and causes a drop in peak values (Fioletov et al., 2015). Table 3 Total column SO2 at each atmospheric layer from OMI sensor, on particular eruption days (bold: crater values; red: SO2 and AI maximum values). Alfaro-Contreras et al., 2016. Table 4 Volcanic Activity Report (RAV) average and maximum SO2 mass emission rate (Fm,(t/d); Fmax, (t/d) respectively) and calculated SO2 daily mass emission rate ((Fc), (t/d)) from Copahue volcano. Period: October–December 2016 (SERNA- GEOMIN, 2016a, 2016b; 2016c, 2016d, 2016e, 2016f). Period (dd/ mm) (year 2016) Fm (t/d) Fmax (t/ d) Record date Fc (t/d) Eq. (1) 01/10–15/10 1427 ± 1311 4874 04/10 754.2 ± 377.1 (05/10/ 16) 15/10–31/10 190 ± 98 1000 24/10 720.1 ± 360.0 (18/10/ 16) 1586.8 ± 793.4 (27/ 10/16) 01/11–15/11 1153 ± 686 2400 10/11 1508.4 ± 754.2 (05/ 11/16) 16/11–30/11 479 ± 297 969 27/11 – 01/12–14/12 1071 ± 358 3082 12/12 377.1 ± 188.5 (01/12/ 16) 15/12–31/12 479 ± 127 585 15/12 – P.A. Paez et al.
- 7. Journal of South American Earth Sciences 110 (2021) 103365 7 OMI images of days 18th and 27th October displayed pixels with SO2 presence also in a direction opposite to the HYSPLIT plume. The infor- mation in Table 4 suggests that a degassing process was taking place on those days. Assuming that 5% of emitted SO2 would persist in the at- mosphere for 4 day at most, any change in wind direction during that period, would cause the sensor to detect SO2 both downwind and windward of the volcano. 4.3. Volcanic ash dispersion Satellite images provide a view of the atmosphere from space, not from a specific layer. Consequently, it is useful to consider multiple layers together by weighting the concentration at each layer by the layer depth to achieve the total atmospheric column load (g/m2 ). Column loads show all locations where volcanic ash is predicted to be irre- spective of altitude (Dare et al., 2016). Volcanic ash dispersion was analyzed on 5th, 18th, 27th Oct, 5th Nov, and 1st Dec 2016 by considering the ash column with mass loadings (g/m2 ) from the HYS- PLIT model. Fig. 4 shows the temporal evolution of the selected events at 1-h time intervals on 5th October and 1st December: 2 h after the event, ash had reached distances of up to 60 km from the source (see for instance, 5 th Oct and 1st Dec in Fig. 4). Maximum ash concentrations ranged from 220 g/m2 on 5th Oct to peak at 1400 g/m2 on 1st Dec. Although the direction of ash plumes was similar to that of SO2 plumes, the extent after 1 h was less. In spite of the lack of information at some pixels, HYSPLIT ash dispersion matches the detections based on the AI algorithm in satellite- based OMPS (see Figs. 5–6). The AI corresponding to 27th October is difficult to observe because of the great proportion of pixels without data. However, qualitatively, the modeled plume follows AI detections. On this day, the plume reached a maximum altitude of 6.1 km. Schneider et al. (1999) documented the separation of SO2 and vol- canic ash in the atmosphere from satellite imagery, and suggested the cause was gravitational vertical segregation of volcanic cloud Fig. 2. a) HYSPLIT SO2 plume (mg/m3 ) (date: dd/mm/yyyy) a) October 05, 2016 at 19:15 UTC, b) October 18, 2016 at 18:37 UTC, c) October 27, 2016 at 18:43 UTC, d) November 05, 2016 at 18:31 UTC, e) December 01, 2016 at 18:35 UTC. P.A. Paez et al.
- 8. Journal of South American Earth Sciences 110 (2021) 103365 8 Fig. 3. SO2 column average (DU) from OMI remote sensor in the area of Copahue volcano (DU at 2.69 x 10¹⁶ molecules/cm2 )(dates: dd/mm/yyyy) a) October 05, 2016, b) October 18, 2016, c) October 27, 2016, d) November 05, 2016, e) December 01, 2016. Fig. 4. Ash mass loadings (g/m2 ) plume evolution (date: dd/mm/yyyy) October 05, 2016 (a), b) and c)), December 01, 2016 (d), e) and f)) obtained from HYSPLIT. P.A. Paez et al.
- 9. Journal of South American Earth Sciences 110 (2021) 103365 9 constituents. Furthermore, they suggested that the presence of a strong wind shear was a primary factor in determining whether the separation would be observed in satellite imagery. This fact could be associated with the different patterns observed in OMI’s SO2 and AI’s OMPS estimates in our study, given that the strongest wind shear was observed on 5th November (not shown). As noted, when discussing SO2 detection, cloudiness represents a weakness to ash/aerosol column images obtained from the Aerosol Fig. 5. a) Ash mass loadings (g/m2 ) (date: dd/mm/yyyy). a) October 05, 2016 at 19:15 UTC, b) October 18, 2016 at 18:37 UTC, c) October 27, 2016 at 18:43 UTC, d) November 05, 2016 at 18:31 UTC, e) December 01, 2016 at 18:35 UTC. (white dot indicates the position of maximum deposition; red triangle, Copahue Volcano; and red square, Caviahue Health Center). P.A. Paez et al.
- 10. Journal of South American Earth Sciences 110 (2021) 103365 10 Index (AI) values acquired by the Ozone Mapping and Profiler Suite (OMPS) on board of NASA-NOAA’s Suomi NPP satellite. Another weakness is the lack of ability to identify the origin of particulate matter. Consequently, when strong winds lift and transport large amounts of particulate matter from the land surface, and suspended particulate matter from the land mixes with volcanic ash, it becomes difficult to determine volcanic concentrations at levels close to the surface. This is the case of the study area -arid land with little vegetation cover-which facilitates sediment resuspension. 4.3. Deposition Deposition on the days under analysis was estimated using particle characteristics as described in Daga et al. (2017). Fig. 7 presents the deposition estimated for 5th, 18th, 27th Oct, 5th Nov, and 1st Dec. Modeled deposition on 18th October includes a 11 km-radius area from the volcano with 190 g/m2 deposition, which reached 30 km within 3 h, accumulating 3300 g/m2 of ash at a distance of 4 km from the source. On that day, the atmosphere presented neutral stability with abundant cloudiness over the region (Pasquill stability classification, class D). The estimated peak of deposition at 19:00 UTC on 5th October 2016 was 130 g/m2 in a 5 km area around the crater. Three hours later they reached 520 g/m2 at 4.5 km east from the volcano. HYSPLIT estimate was more than 0.1 g/m2 up to 72.5 km downwind in the following 3 h. On that day, unstable atmospheric conditions dominated (Pasquill class C). On 27th October, the plume reached its highest altitude and concentrated over Copahue volcano. Deposition peaked at a distance of 1 km from the source with 180 g/m2 . The atmosphere presented Pasquill class B, i.e., unstable conditions and deposition was over 1.0 g/m2 both in the Bio Bio region up to 12 km east from the volcano (see Figs. 7) and 14 km to Caviahue village. On 5th November, the plume stretched over 56 km. The deposition peak was 370 g/m2 at 4 km east of the source. A relative maximum greater than 1.0 g/m2 was observed over a long and narrow strip in the southeast direction. In situ records of ash deposition rates for 5th November show an increase of 0.14 g/h with respect to the other days under analysis (28th Oct, 30th Oct, 2nd Nov and 3rd Nov). The average deposition rate was 0.084 g/h (see Table 2). Finally, the ash plume reached 4.2 km altitude on the 1st December 2016. Unstable to very unstable atmospheric conditions (Pasquill class B-A) favored the occurrence of surface maxima near the source. In the first hour after eruption, the deposition maximum of 410 g/m2 was located 2.2 km around the source and concentration in the Copahue Provincial Park was greater than 1 g/m2 , as shown in Fig. 7. Accumu- lated sediment after 2 h was estimated at more than 1400 g/m2 . On 18th October, it rained less than 6 mm and clouds were present during most of the day. Such moist atmospheric conditions, could have enhanced the removal of particles from the atmosphere (Langmann et al., 2010). HYSPLIT was also run for the days presented in Table 2, when surface samplings were taken at the CHC. The comparison of deposited ash Fig. 6. Aerosol Index (AI) from OMPS remote sensor (Ozone Mapper Profiler Suite, Suomi NPP mission (Suomi National Polar-orbiting Partnership)) in the Copahue volcano area (dd/mm/yyyy). a) October 05, 2016 b) October 18, 2016, c) October 27, 2016, d) November 05, 2016, e) December 01, 2016. P.A. Paez et al.
- 11. Journal of South American Earth Sciences 110 (2021) 103365 11 sampled in the observation period with model results indicated that dry deposition parameterization failed to estimate deposition adequately in the cases considered (see Table 2). However, the estimates presented the same order of magnitude as measurements (see Table 2). The measured ash sedimentation rate on 30th November was 0.232 g/h (see Table 2), accumulating 261 g/m2 of ash in Caviahue. It was the highest measured value in the observation period in concordance with the peak in ash deposition rates estimated by HYSPLIT as a consequence of the 4.2 km- high eruptive plume. Nevertheless, meteorological data used for HYS- PLIT are available at relatively coarse temporal and spatial resolution, and so deposition estimates at the CHC location were interpolated. It should also be noted that there were large uncertainties in eruption parameters such as the period, height or size distribution of release, that could affect the estimates of amount and localization of peaks. More- over, aggregation of ash particles, not examined in this paper, could have significant effects on ash distribution (Mastin et al., 2016). 4.4. Analysis of ash leachates The abundance of water-soluble components in the ash sample is presented in Tables 5 and 6. Table 5 shows the concentrations of major components in the leachate sample. The most abundant species, with concentrations above 1 mg/kg of ash (Ruggieri et al., 2011), were SO4 −2 >Cl− > Ca+2 >Na+ >Mg+2 >F− , ranked from higher to lower concentrations. The concentration of fluoride in ash leachate was 6.62 mg/L or 129.1 mg/kg of ash. The content of fluoride anion in the leachate was relatively low compared to the results of Bia et al. (2020), who deter- mined an amount of 598 mg/kg of fluoride in Copahue Volcano ash (January 2016 eruption). Those authors performed the analysis using the same ash/water ratio and agitation time but different quantification method from the one used in this work. Fluoride concentration in Copahue was similar to that of Yasur volcano, i.e., 178–281 mg/kg (Cronin and Sharp, 2002), under similar leachate analysis conditions. Comparisons were made with other volcanoes, e.g., St. Helens: 300 mg/kg (Smith et al., 2017); Ruapehu: 350–850 mg/kg (Cronin et al., Fig. 7. a) HYSPLIT ash deposition (g/m2 ) on: (date: dd/mm/yyyy) a) October 05, 2016 at 19:15–20:15 UTC, b) October 18, 2016 at 18:37 UTC, c) October 27, 2016 at 18:43 UTC, d) November 05, 2016 at 18:31 UTC, e) December 01, 2016 at 18:35 UTC. (white dot indicates the position of maximum deposition, red triangle, Copahue Volcano and red square, the Caviahue Health Center). P.A. Paez et al.
- 12. Journal of South American Earth Sciences 110 (2021) 103365 12 2000); Soufriere de Guadalupe: 540–800 mg/kg (Le Guern et al., 1980). The volcanoes selected for comparison are classified as stratovol- canoes. They have VEI <3, their lava composition was mainly andesitic to basaltic andesite, identical to the Copahue volcano. Nevertheless, as can be seen, fluoride concentrations obtained in this study are lower than those of the other volcanoes. Such difference could be explained either by a) methodological differences (Witham et al., 2005; Stewart et al., 2020); or b) by the type of fluoride compound contained in ash (Bia et al., 2020). In general ash containing water-soluble fluoride salts, release the fluoride within the first hour of interaction; the presence of fluoride aluminum silicates which might inhibit or release F in longer ash-water interaction periods (Cronin et al., 2003; Bia et al., 2020; Stewart et al., 2020). The most abundant anion in ash leachate was sulfate with 990.7 mg/kg (see Table 5). The molar ratio of SO2/HCl was 1.05, compa- rable to the S/Cl ratio equal to 1.00 reported by Tassi et al. (2015) for volatile gases from hydrothermal sources in the Caviahue-Copahue region. These values have been reported in ash leachates from pas- sive degassing to slightly explosive volcanoes (Bagnato et al., 2011). The sample contained sodium (Na), calcium (Ca) and magnesium (Mg) concentrations up to 207.8 mg/kg, 209.5 mg/kg, and 195.3 mg/kg respectively. These amounts are similar to the concentrations found in the samples from the 2000 Copahue eruption (Na, 277.0 mg/kg; Ca. 351.0 mg/kg and Mg, 595.0 mg/kg) (Ruggieri et al., 2011). Those authors examined ash samples with an ash/water ratio of 0.1:5 and agitation time (12 h) (Ruggieri et al., 2011), which is different from the methodology applied in this study. However, leached fractions are of the same order of magnitude and have the same trend as in the study by Ruggieri et al. (2012). In their latter work, they tried different ash amounts (0.1 g and 1 g), different ash/water ratios (10, 25 and 50), and different agitation time (1.5, 4, and 16 h) for the leachate tests. The leachates prepared with the smallest ash weight have greater amounts of soluble elements. Table 6 shows the analysis of heavy metal traces. The most abundant were nickel (Ni, 79.4 mg/kg), zinc (Zn, 44.3 mg/kg), and copper (Cu, 11.1 mg/kg). Smaller concentrations were found of As, Cr, Hg, Mo, Pb, and Se with values ranging from 0.2 mg/kg to 6.0 mg/kg. Trace ele- ments (as cations) with the highest concentrations in water batch leaching tests included: Ni > Zn > Cu > Se > Ti > Ba > As > Cr > Mo > Cd > Co > Hg, Pb, Sn, Sb (in decreasing order) (see Table 6). Some of these elements (As, Cu, F, Mo, Ni, Pb, Se and Zn) are included in the drinking water guidelines (CAA, 2019; WHO, 2008) due to their po- tential toxicity and must be monitored in the environmental assessment of ashfall deposits, as suggested by Ruggieri et al. (2012). Fluoride is also soluble in water and it is included in drinking water regulations because of its toxicity (CAA, 2019; WHO, 2008). The Argentine Food Code (CAA, by its Spanish acronym) establishes a threshold of 1.7 mg/L for fluoride at an average air temperature of 10 ◦ C and of 0.01 mg/L for Se (CAA, 2019). In order to determine whether ash leachate contained toxic levels of ion concentrations, we calculated the minimum mass concentration of those elements in a 1:20 solution from CAA thresholds (Witham et al., 2005). These equivalent threshold con- centrations in ash for F (as anion) and Se (as cation) were 34.0 mg/kg and 0.2 mg/kg, respectively, in an ash/water solution of 1:20. Fluoride and selenium concentrations in the ash leachate were 129.15 mg/kg and 6 mg/kg, respectively. These concentrations exceeded by far the calcu- lated minimum mass concentration. It is worth noting that this inference is valid if total species dissolution occurs (as in laboratory). However, in natural water bodies, total dissolution is not granted (Witham et al., 2005). Table 7 presents a comparison between the minimum mass concentrations in an ash/water solution of 1:20 that are required to exceed the World Health Organization (WHO) or CAA drinking water safety thresholds, and ion concentrations in volcanic ash (mg/kg), as determined from ash leachate analysis. At concentrations greater than the minimum mass concentration, F, As, Cd, Cr, Hg, Ni, and Se are hazardous to human health. One of the objectives of this study was to evaluate the chemical composition of volcanic ash leachate. This analysis only provides a first approach for assessing the impacts of water-soluble elements that leach from falling volcanic ash on human health, environment and/or agriculture. Some studies exist of the mobility of these elements between water and soil (e.g., Georgakopoulos et al., 2002) and of non-biodegradable and persistent metallic elements that bioaccumulate and biomagnify in plant species (e.g., Peña-Fernández et al., 2014; Ali et al., 2019). However, further in-depth analysis of the presence in air, water and soil of these elements would shed light on the actual exposure to volcanic contamination (Adamo et al., 2003) of people and other living beings in the study area. In this sense, Bubach et al. (2020) examined atmospheric pollution by relating it to the presence of some chemical elements in lichens and soil at a distance of 7–18 km from Copahue volcano. They observed enrichment in sulfur and selenium at all the sites examined, even at the most distant sites from the volcano crater. They also determined the concentrations of non-toxic (Ca, K, Se, Mg, and Mn) and toxic (As, Hg, Cr, and Pb) elements in the areas most affected by volcanic ash. There is Table 5 Major soluble ion concentrations in volcanic ash (CL (mg/L) Cc (mg/kg)), as determined from ash-leachate analysis. CL (mg/L) Cc (mg/kg) F− 6.62 129.15 Cl− 18.06 352.34 NO2 − 0.04 0.78 NO3 − 2.63 51.31 Br− 0.11 2.15 SO4 −2 50.78 990.69 Na+ 10.65 207.78 K+ 1.69 32.97 Ca+2 10.74 209.53 Mg+2 10.01 195.29 Table 6 Concentration of soluble trace elements (as cations) in volcanic ash (CL (mg/L) Cc (mg/kg)), as determined from ash-leachate analysis. CL (μg/mL) Cc (mg/kg) As 0.14 2.7 Ba 0.29 5.7 Cd 0.02 0.4 Co 0.02 0.4 Cr 0.09 1.8 Cu 0.57 11.1 Hg 0.01 0.2 Mo 0.05 1.0 Ni 4.07 79.4 Pb <0.01 0.2 Se 0.31 6.0 Sb <0.01 0.2 Sn <0.01 0.2 Ti 0.30 5.9 Zn 2.27 44.3 Table 7 Soluble element concentrations in volcanic ash (Cc (mg/kg)), as determined from ash-leachate analysis compared to minimum mass concentrations (Cm (mg/kg)) required to exceed the WHO drinking water threshold at an ash/water ratio of 1:20. Cc (mg/kg) Cm (mg/kg) F 129.1 34 As 2.73 1.0 Cd 0.39 0.1 Cr 1.75 1.0 Hg 0.20 0.02 Ni 79.4 0.4 Se 6.0 0.2 P.A. Paez et al.
- 13. Journal of South American Earth Sciences 110 (2021) 103365 13 agreement between the areas identified by Bubach et al. (2020) with the areas of greatest deposition identified in the present paper. 5. Conclusions This paper presents a combined analysis of measurements of volcanic ash deposited at ground level with dispersion models and satellite readings. The association with modeled plumes makes it possible to determine the nearby area affected by volcanic ash and SO2 from the Copahue volcano plume. We quantify and describe ash sediments by examining deposition rates obtained from in situ observations and from HYSPLIT estimates. The maximum in situ ash sediment rate - 0.14 g/h-occurred on 5th November. The deposition average rate for the five analyzed days was 0.084 g/h (see Table 2). The spatial distribution and order of magnitude of HYSPLIT modeled concentrations of SO2 and volcanic ash presented good agreement with OMPS’s AI estimates. The accuracy of modeled dispersion might improve if more monitoring data were available, mainly related with time of occurrence and duration of eruption. The study area, located in an arid environment with little vegetation cover, favors lifting and transporting of mineral particles by strong winds. Saltation and sandblasting lead to mineral aerosol release in arid areas (Mingari, 2018; Alfaro and Gomes, 2001) as well as resuspension of volcanic ashes. Non-volcanic particles could mix with volcanic ash, making it difficult to determine volcanic concentrations close to the surface. This information could be combined with backward runs of the dispersion model to obtain more accurate results. In this study, we determined the SO2 emitted during eruptions through OMI measurements and in situ data. The OMI algorithm pro- vides essential data on SO2 emissions, but it only quantifies the gas phase of this species and does not quantify ash-adsorbed sulfur. The total mass of SO2 emitted by the volcano would be the sum of adsorbed and gas sulfur. Consequently, further investigation is needed to determine the relative importance of adsorbed SO4 in the injection of SO2 gas into the atmosphere (Witham et al., 2005). Further analysis of events occurred after 2017 would also include TROPOMI data with improved spatial resolution. The analysis of volcanic ash leachate reveals that the main anions released are SO4 −2 , Cl− and F− ; and the main cations, Na+ , Ca+2 , and Mg+2 . These water-soluble species provide indirect evidence about the composition of the gas emitted by the volcano. The SO2/HCl ratio in- dicates for Copahue volcano a passive degassing process to mildly explosive classification at the time of sampling, although further sam- pling would be advisable for greater certainty. We calculated the minimum mass concentration in a 1:20 dilution solution equivalent to the WHO/CAA guideline values for comparison with ion concentrations in ash leachates. The concentration of F, As, Cd, Cr, Hg, Ni, and Se determined in 1:20 ash leachates, largely exceeded the minimum mass concentrations calculated. Such high ion concentrations imply a risk to human health. These results must be carefully considered in terms of surface water quality, because there is no direct relationship between ash deposits in water deposits and the experimental ash/water ratio of 1:20 proposed in this study. The concentration and effects of each of these elements on the environment (soil, water, plant species, air) requires further studies focused on species mobility. Authors statement P.A. Paez, A.T. Caselli and M.G. Cogliati conceived of the presented idea and developed the theory and performed the computations. P.A. Paez, A.T. Caselli and M.G. Cogliati verified the analytical methods. A.T. Caselli encouraged P.A. Paez to investigate and supervised the findings of this work. All authors discussed the results and contributed to the final manuscript. P.A. Paez, A.T. Caselli, M.G. Cogliati and A.M. Mon- asterio carried out the experiment. P.A. Paez, and M.G. Cogliati devel- oped the theoretical formalism, performed the analytic calculations and performed the numerical simulations. Both P.A. Paez and M.G. Cogliati, take the lead in writing the manuscript contributing to the final version of the manuscript. A.M. Monasterio contributed to sample preparation all the authors contributed to the interpretation of the results. All au- thors provided critical feedback and helped to shape the research and analysis. Declaration of competing interest The authors declare that they have no known competing financial interests or personal relationships that could have appeared to influence the work reported in this paper. Acknowledgements Funding for this work was provided by the National University of Río Negro. We thank V.F. Krotov and team for their invaluable data input to carry out this paper. We are grateful to the anonymous reviewers whose constructive comments and recommendations helped to improve the manuscript. References Adamo, P., Denaix, L., Terribile, F., Zampella, M., 2003. Characterization of heavy metals in contaminated volcanic soils of the Solofrana river valley (southern Italy). Geoderma 117, 347–366. https://doi.org/10.1016/S0016-7061(03)00133-2. Agusto, M.R., Vélez, M.L., 2017. Avances en el conocimiento del sistema volcánico- hidrotermal del Copahue: a 100 años del trabajo pionero de don Pablo Groeber. Rev. de la Asoc. Geol. Argentina 74, 109–124. Alessandro, W.D., 2006. Gas hazard : an often neglected natural risk in volcanic areas. WIT Trans. Ecol. Environmen 89, 369–378. https://doi.org/10.2495/GEO060371. Alfaro, S.C., Gomes, L., 2001. Modeling mineral aerosol production by wind erosion: emission intensities and aerosol size distributions in source areas. J. Geophys. Res. 106 (D16), 18075–18084. https://doi.org/10.1029/2000JD900339. Alfaro-Contreras, R., Zhang, J., Campbell, J.R., Reid, J.S., 2016. Investigating the frequency and interannual variability in global above-cloud aerosol characteristics with CALIOP and OMI. Atmos. Chem. Phys. 16, 47–69. https://doi.org/10.5194/ acp-16-47-2016. Ali, H., Khan, E., Ilahi, I., 2019. Environmental chemistry and ecotoxicology of hazardous heavy metals: environmental persistence, toxicity, and bioaccumulation. J. Chem. 2019. https://doi.org/10.1155/2019/6730305. APHA, 2012. Determination of anions by ion chromatography. In: Greenberg, A.E., Clesceri, L.S., Eaton, A.D., Franson, M.A.H. (Eds.), Standard Methods for the Examination of Water and Wastewater. American Public Health Association, Washington. Augusto, M.R., Vélez, M.L., 2017. Avances en el conocimiento del sistema volcánico- hidrotermal del Copahue: A 100 años del trabajo pionero de don Pablo Groeber. Rev. la Asoc. Geol. Argentina 74, 109–124. Bagnato, E., Aiuppa, A., Andronico, D., Cristaldi, A., Liotta, M., Brusca, L., Miraglia, L., 2011. Leachate analyses of volcanic ashes from Stromboli volcano: a proxy for the volcanic gas plume composition? J. Geophys. Res. Atmos. 116, 1–17. https://doi. org/10.1029/2010JD015512. Barberi, F., Innocenti, F., Landi, P., Rossi, U., Saitta, M., Santacroce, R.V.I.M., 1984. The evolution of latera caldera (Central Italy) in the light of subsurface data. Bull. Volcanol. 47, 125–141. Bermúdez, A., Delpino, D., 1995. Mapa de los peligros potenciales en el área del volcán Copahue Sector Argentino. Serie Mapas de Riesgo Geológico. Servicio Geológico Neuquino. Bubach, D., Dufou, L., Catán, S.P., 2014. Evaluation of dispersal volcanic products of recent events in lichens in environmental gradient, Nahuel Huapi National Park, Argentina. Environ. Monit. Assess. 186, 4997–5007. https://doi.org/10.1007/ s10661-014-3754-1. Bia, G., Borgnino, L., Zampieri, G., García, M.G., 2020. Fluorine surface speciation in South Andean volcanic ashes. Chem. Geol. 532, 119402 https://doi.org/10.1016/j. chemgeo.2019.119402. Bubach, D.F., Catan, S.P., Messuti, M.I., Arribére, M.A., Guevara, S.R., 2020. Bioaccumulation of trace elements in lichens exposed to geothermal and volcanic activity from Copahue-Caviahue volcanic complex, Patagonia, Argentina. Ann. Environ. Sci. Toxicol. 4 https://doi.org/10.17352/aest.000019, 005–015. CAA, 2019. Capítulo XII: Bebidas Hídricas, Agua Y Agua Gasificada, Código Alimentario Argentino. https://doi.org/10.4000/books.ifea.5415. Argentina. Carn, S.A., Clarisse, L., Prata, A.J., 2016. Multi-decadal satellite measurements of global volcanic degassing. J. Appl. Volcanol. Volcanol. Gethermal Res. 311, 99–134. https://doi.org/10.1016/j.jvolgeores.2016.01.002. Carn, S.A., Krotkov, N.A., 2016. Ultraviolet satellite measurements of volcanic ash. In: Greenbelt, M.U.S., University, M.T. (Eds.), NASA Goddard Space Flight Center, Volcanic Ash. Elsevier Ltd, Greenbelt, pp. 217–231. https://doi.org/10.1016/B978- 0-08-100405-0.00018-5. P.A. Paez et al.
- 14. Journal of South American Earth Sciences 110 (2021) 103365 14 Carn, S.A, Krueger, A.J., Krotkov, N.A., Yang, K., Levelt, P.F., 2007. Sulfur dioxide emissions from Peruvian copper smelters detected by the Ozone Monitoring Instrument. Geophys. Res. Lett. 34, L09801 https://doi.org/10.1029/ 2006GL029020. Carn, S.A., Prata, F.J., 2010. Satellite - based constraints on explosive SO2 release from Soufrière Hills Volcano, Montserrat. Geophys. Res. Lett. 37, 1–5. https://doi.org/ 10.1029/2010GL044971. Caselli, A., Agusto, T., Velez, M.L., Forte, P., Bengoa, C., Capaccioni, B., 2016a. The 2012 eruption. In: Copahue volcano. In: Tassi, F., Vaselli, O., Caselli, A.T. (Eds.), Active Volcanoes of the World, Book Series. Springer-Verlag, Heidelberg, pp. 62–77, 978-3- 662-48004-5. Caselli, A.T., Liccioli, C., Tassi, F., 2016b. Risk Assessment and Mitigation at Copahue Volcano. In Copahue Volcano. Springer, Berlin, Heidelberg, pp. 239–254. Caselli, A.T., Velez, M.L., Agusto, M.R., Liccioli, C., Vaselli, O., 2016c. Prehistoric to historic volcanic activity at Copahue volcano. In: Copahue volcano. In: Tassi, F., Vaselli, O., Caselli, A.T. (Eds.), Active Volcanoes of the World, Book Series. Springer- Verlag, Heidelberg, pp. 49–59. Caselli, A.T., Sommer, C.A., D, R., Báez, A.D., Albite, J.M., Barion, G., 2017. Caracterización de las fases eruptivas del Volcán Copahue durante el Ciclo 2012- 2017 (Andes Argentino-Chileno). In: XX Congreso Geológico Argentino, pp. 27–29. Chai, T., Crawford, A., Stunder, B., Pavolonis, M.J., Draxler, R., Stein, A., 2017. Improving volcanic ash predictions with the HYSPLIT dispersion model by assimilating MODIS satellite retrievals. Atmos. Chem. Phys. 17, 2865–2879. https:// doi.org/10.5194/acp-17-2865-2017. Colarco, P.R., Gassó, S., Ahn, C., Buchard, V., Silva, A., Torres, O., 2017. Simulation of the ozone monitoring instrument aerosol index using the NASA goddard earth observing system aerosol reanalysis products. Atmos. Chem. Phys. 10, 4121–4134. Crawford, A.M., Stunder, B.J.B, Ngan, F., Pavolonis, M.J., 2016. Initializing HYSPLIT with satellite observations of volcanic ash: A case study of the 2008 Kasatochi eruption. J. Geophys. Res. Atmos. 121 (10), 10786–10803. https://doi.org/10.1002/ 2016JD024779. Cronin, S.J., Manoharan, V., Hedley, M.J., Loganathan, P., 2000. Fluoride: a review of its fate, bioavailability, and risks of fluorosis in grazed-pasture systems in New Zealand. NZJAR (N. Z. J. Agric. Res.) 43, 295–321. https://doi.org/10.1080/ 00288233.2000.9513430. Cronin, S.J., Neall, V.E., Lecointre, J.A., Hedley, M.J., Loganathan, P., 2003. Environmental hazards of fluoride in volcanic ash: a case study from Ruapehu volcano, New Zealand. J. Volcanol. Geoth. Res. 121, 271–291. https://doi.org/ 10.1016/S0377-0273 (02)00465-1. Cronin, S.J., Sharp, D., 2002. Environmental impacts on health from continuous volcanic activity at Yasur (Tanna) Environmental impacts on health from. Int. J. Environ. Health Res. 12, 109–123. https://doi.org/10.1080/09603120220129274. Daga, R., Caselli, A.T., Ribeiro, S., Augusto, M., 2017. Tefras emitidas durante la fase inicial hidromagmática (julio de 2012) del ciclo eruptivo 2012-actual (2016) del volcán Copahue (Andes del Sur). Rev. la Asoc. Geológica Argentina 74, 191–206. Dare, R.A., Smith, D.H., Naughton, M.J., 2016. Ensemble prediction of the dispersion of volcanic ash from the 13 february 2014 eruption of kelut, Indonesia. Journal of Applied Meteorology and Climatology 55 (1), 65–78. https://doi.org/10.1175/ JAMC-D-15-0079.1. Degruyter, W., Bonadonna, C., 2012. Improving on mass flow rate estimates of volcanic eruptions. Geophys. Res. Lett. 39, L16308 https://doi.org/10.1029/2012GL052566. Delpino, D., Bermúdez, A., 1993. La actividad del volcán Copahue durante 1992. Erupción con emisiones de azufre piroclástico. In: XII Congreso Geológico Argentino y II Congreso de Exploración de Hidrocarburos. Neuquén, pp. 292–301. Actas 4. Delpino, D., Bermúdez, A., 2002. La erupción del volcán Copahue del año 2000. Impacto social y al medio natural. In: XV Congreso Geológico Argentino, pp. 365–370. Acta 3. Deroubaix, A., Martiny, N., Chiapello, I., Marticorena, B., 2013. Suitability of OMI aerosol index to reflect mineral dust surface conditions: Preliminary application for studying the link with meningitis epidemics in the Sahel. Remote Sens. Environ. 133, 116–127. https://doi.org/10.1016/j.rse.2013.02.009. Draxler, R.R., Hess, G.D., 1997. Description of the HYSPLIT_4 Modeling System. NOAA Tech. Memo, ERL ARL-224. Revised December 2010. NOAA Air Resour. Lab. Silver Spring, pp. 1–24. Elissondo, M., Baumann, V., Bonadonna, C., Pistolesi, M., Cioni, R., Bertagnini, A., Biass, S., Herrero, C., Gonzalez, R., 2016. Chronology and impact of the 2011 Cordón Caulle eruption, Chile. Nat. Hazards Earth Syst. Sci. 16 (3), 675–704. Finlayson-Pitts, B.J., Pitts, J.N.J., 1986. Atmospheric Chemistry. Fundamentals and Experimental Techniques. Wiley-Inte. ed, New York. Fioletov, V.E., McLinden, C.A., Krotkov, N., Li, C., 2015. Lifetimes and emissions of SO2 from point sources estimated from OMI. Geophys. Res. Lett. 42 https://doi.org/ 10.1002/2015GL063148. Fuentes, N., Goméz, L., Venegas, H., Rau, J.R, 2020. Total devastation of river macroinvertebrates following a volcanic eruption in southern Chile. Ecosphere 11 (5), e03105. https://doi.org/10.1002/ecs2.3105. Ge, C., Wang, J., Carn, S., Yang, K., Ginoux, P., Krotkov, N., 2016. Satellite-based global volcanic SO2 emissions and sulfate direct radiative forcing during 2005–2012. J. Geophys. Res. Atmos. 121, 3446–3464. https://doi.org/10.1002/2015JD023134. Georgakopoulos, A., Filippidis, A., Kassoli-Fournaraki, A., Iordanidis, A., Fernández- Turiel, J.L., Llorens, J.F., Gimeno, D., 2002. Environmentally important elements in fly ashes and their leachates of the power stations of Greece. Energy Sources 24, 83–91. https://doi.org/10.1080/00908310252712325. Gray, T.M., Bennartz, R., 2015. Automatic volcanic ash detection from MODIS observations using a back-propagation neural network. Atmos. Meas. Tech. 8, 5089–5097. https://doi.org/10.5194/amt-8-5089-2015. GVP, Global Volcanism Program, 2016a. Report on Copahue (Chile-Argentina). In: Sennert, S.K. (Ed.), Weekly Volcanic Activity Report, 26 October-1 November 2016. Smithsonian Institution and US Geological Survey. GVP, Global Volcanism Program, 2016b. Report on Copahue (Chile-Argentina). In: Sennert, S.K. (Ed.), Weekly Volcanic Activity Report, 2 November-8 November 2016. Smithsonian Institution and US Geological Survey. Global Volcanism Program, 2016c. Report on Copahue (Chile-Argentina). In: Sennert, S K (ed.), Weekly Volcanic Activity Report, 9 November-15 November 2016. Smithsonian Institution and US Geological Survey. GVP, Global Volcanism Program, 2016d. Report on Copahue (Chile-Argentina). In: Sennert, S.K. (Ed.), Weekly Volcanic Activity Report, 16 November-22 November 2016. Smithsonian Institution and US Geological Survey. GVP, Global Volcanism Program, 2016e. Report on Copahue (Chile-Argentina). In: Sennert, S.K. (Ed.), Weekly Volcanic Activity Report, 23 November-29 November 2016. Smithsonian Institution and US Geological Survey. GVP, Global Volcanism Program, 2016f. Report on Copahue (Chile-Argentina). In: Sennert, S.K. (Ed.), Weekly Volcanic Activity Report, 30 November-6 December 2016. Smithsonian Institution and US Geological Survey. GVP, Global Volcanism Program, 2016g. Report on Copahue (Chile-Argentina). In: Sennert, S.K. (Ed.), Weekly Volcanic Activity Report, 7 December-13 December 2016. Smithsonian Institution and US Geological Survey. GVP, Global Volcanism Program, 2016h. Report on Copahue (Chile-Argentina). In: Sennert, S.K. (Ed.), Weekly Volcanic Activity Report, 14 December-20 December 2016. Smithsonian Institution and US Geological Survey. GVP, Global Volcanism Program, 2016i. Report on Copahue (Chile-Argentina). In: Sennert, S K (ed.). In: Weekly Volcanic Activity Report, 21 December-27 December 2016. Smithsonian Institution and US Geological Survey. GVP, Global Volcanism Program, 2021. Report on Copahue (Chile-Argentina). In: Sennert, S.K. (Ed.), Weekly Volcanic Activity Report, 14 December-20 December 2021. Smithsonian Institution and US Geological Survey. Hansell, A., Oppenheimer, C., 2004. Health hazards from volcanic gases: a systematic literature review. Arch. Environ. Health 59, 628–639. https://doi.org/10.1080/ 00039890409602947. ISO, 1998. ISO 14911: Determination of Dissolved Li+, Na+, NH4+, K+, Mn2+, Ca2+, Mg2+, Sr2+ and Ba2+ Using Ion Chromatography – Method for Water and Waste Water. IVHHN, 2020. Guía sobre gases volcánicos: dióxido de Azufre [WWW Document] Int. Volcan. Heal. Hazard Netw. https://www.ivhhn.org/es/guidelines/guia-sobre-gas es-volcanicos/dioxido-de-azufre. Kerminen, V., Niemi, J.V., Timonen, H., Aurela, M., Frey, A., Carbone, S., Saarikoski, S., Teinil, K., 2011. Characterization of a volcanic ash episode in southern Finland caused by the Grímsvötn eruption in Iceland in May 2011. Atmos. Chem. Phys. 11, 12227–12239. https://doi.org/10.5194/acp-11-12227-2011. Krotkov, N., Habib, S., da Silva, A., Hughes, E., Yang, K., Schneider, D., Hoffman, R.L., Myers, T., Brentzel, K., Seftor, C., Li, J.Y., 2012. Real time volcanic cloud products and predictions for aviation alerts. Am. Inst. Aeronaut. Astronaut. 5, 1–7. Krotkov, N.A., Mclinden, C.A., Li, C., Lamsal, L.N., Celarier, E.A., Marchenko, S.V., Swartz, W.H., Bucsela, E.J., Joiner, J., Duncan, B.N., Boersma, K.F., Veefkind, J.P., Levelt, P.F., Fioletov, V.E., Dickerson, R.R., 2016. Aura OMI Observations of Regional SO 2 and NO 2 Pollution Changes from 2005 to 2015 4605–4629. https:// doi.org/10.5194/acp-16-4605-2016. Krueger, A.J., 1983. Sighting of el chichon sulfur dioxide with the nimbus-7 total ozone mapping spectrometer. Science 220, 1377–1378. Langmann, B., Zaksek, K., Hort, M., 2010. Atmospheric distribution and removal of volcanic ash after the eruption of Kasatochi volcano: a regional model study. J. Geophys. Res. 115, D00L06. https://doi.org/10.1029/2009JD013298, 2010. Le Guern, F., Bernard, A., Chevrier, R.M., 1980. Soufrière of Guadeloupe 1976–1977 eruption — mass and energy transfer and volcanic health hazards. Bull. Volcanol. 43, 577–593. https://doi.org/10.1007/BF02597694. Levelt, P.F., Oord, G.H.J., Van Den, Dobber, M.R., Mälkki, A., Visser, H., Vries, J. De, Stammes, P., Lundell, J.O.V., Saari, H., 2006. The ozone monitoring instrument. IEEE Trans. Geosci. Rem. Sens. 44, 1093–1101. Li, C., Joiner, J., Krotkov, N.A., Bhartia, P.K., 2013. A fast and sensitive new satellite SO2 retrieval algorithm based on principal component analysis: application to the ozone monitoring instrument. Geophys. Res. Lett. 40, 1–5. https://doi.org/10.1002/ 2013GL058134. Li, C., Krotkov, N.A., Carn, S., Zhang, Y., Spurr, R.J.D., Joiner, J., 2017. New-generation NASA aura ozone monitoring instrument (OMI) volcanic SO2 dataset: algorithm description, initial results and continuation with the suomi-NPP ozone mapping and profiler suite (OMPS). Atmos. Meas. Tech. 10, 445–458. https://doi.org/10.5194/ amt-10-445-2017. Lopez, T., Carn, S., Werner, C., Fee, D., Kelly, P., Doukas, M., Pfeffer, M., Webley, P., Cahill, C., Schneider, D., 2013. Evaluation of redoubt volcano’s sulfur dioxide emissions by the ozone monitoring instrument. J. Volcanol. Geoth. Res. 259, 290–307. https://doi.org/10.1016/j.jvolgeores.2012.03.002. Mastin, L.G., 2014. Testing the accuracy of a 1-D volcanic plume model in estimating mass eruption rate. J. Geophys. Res. Atmos. 119, 2474–2495. https://doi.org/ 10.1002/2013JD020604. Mastin, L.G., Guffanti, M., Servranckx, R., Webley, P., Barsotti, S., Dean, K., Durant, A., Ewert, J.W., Rose, W.I., Schneider, D., Siebert, L., Stunder, B., Swanson, G., Tupper, A., Volentik, A., Waythomas, C.F., 2009. A multidisciplinary effort to assign realistic source parameteres to models of volcanic ash-cloud transport and dispersion eruptions. J. Volcanol. Geoth. Res. 186, 10–21. https://doi.org/10.1016/j. jvolgeores.2009.01.008. P.A. Paez et al.
- 15. Journal of South American Earth Sciences 110 (2021) 103365 15 Mastin, L.G., Van Eaton, A.R., Durant, A.J., 2016. Adjusting particle-size distributions to account for aggregation in tephra-deposit model forecasts. Atmos. Chem. Phys. 16, 9399–9420. https://doi.org/10.5194/acp-16-9399-2016, 2016. Mingari, L.A., 2018. Resuspensión eólica de depósitos volcánicos de caída: parametrización, modelización y pronóstico operacional. FCEyN. Univ. de Buenos Aires. https://hdl.handle.net/20.500.12110/tesis_n6491_Mingari. Naranjo, A.J., Polanco, E., 2004. The 2000 AD eruption of Copahue volcano. Southern Andes. Rev. Geológica Chile 31, 279–292. NASA, 2008. OMSO2 README File v1.3.0. Released Feb 26, 2008 Updated: June 16, 2016. Pardini, F., Burton, M., Arzilli, F., La Spina, G., Polacci, M., 2017. Satellite-derived SO2 flux time-series and magmatic processes during the 2015 Calbuco eruptions. Solid Earth Discuss 1–25. https://doi.org/10.5194/se-2017-64. Pattantyus, A.K., Businger, S., Howell, S.G., 2018. Review of sulfur dioxide to sulfate aerosol chemistry at Kı̄lauea Volcano. Hawaii. Atmos. Environ. 185, 262–271. https://doi.org/10.1016/j.atmosenv.2018.04.055. Peña-Fernández, A., González-Muñoz, M.J., Lobo-Bedmar, M.C., 2014. Establishing the importance of human health risk assessment for metals and metalloids in urban environments. Environ. Int. 72, 176–185. https://doi.org/10.1016/j. envint.2014.04.007. Petrinovic, I.A., DÉlia, L., Páez, G., Balbis, C., Guzmán, S., Villarosa, G., Carniel, R., 2014. Depósito de corriente piroclástica reciente (1963-64 ad? – 1976 ad?) del volcán Copahue (i): evidencias geológicas de campo y edad radiocarbónica. Rev. Asoc. Geol. Argent. 71 (2), 161–173. Prata, A.J., 2009. Satellite detection of hazardous volcanic clouds and the risk to global air traffic. Nat. Hazards 51, 303–324. https://doi.org/10.1007/s11069-008-9273-z. Prata, F., Woodhouse, M., Huppert, H.E., Prata, A., Thordarson, T., Carn, S.A., 2017. Atmospheric processes affecting the separation of volcanic ash and SO 2 in volcanic eruptions: inferences from the May 2011 Grímsvötn eruption. Atmos. Chem. Phys. 1–34. https://doi.org/10.5194/acp-2017-95. Qu, Z., Henze, D.K., Li, C., Theys, N., Wang, Y., Wang, J., et al., 2019. SO2 emission estimates using OMI SO2 retrievals for 2005–2017. J. Geophys. Res.: Atmosphere 124, 8336–8359. https://doi.org/10.1029/2019JD030243. Ruggieri, F., Fernández-Turiel, J.L., Saavedra, J., Gimeno, D., Polanco, E., Naranjo, J.A., 2011. Environmental geochemistry of recent volcanic ashes from the Southern Andes. Environ. Chem. 8, 236–247. Ruggieri, F., Gil, R.A., Fernandez-Turiel, J.L., Saavedra, J., Gimeno, D., Lobo, A., Martinez, L.D., Rodriguez-Gonzalez, A., 2012. Multivariate factorial analysis to design a robust batch leaching test to assess the volcanic ash geochemical hazard. J. Hazard Mater. 213–214, 273–284. Schneider, D.J., Rose, W.I., Coke, L.R., Bluth, G.J.S., Sprod, I.E., Krueger, A.J., 1999. Early evolution of a stratospheric volcanic eruption cloud as observed with TOMS and AVHRR. J. Geophys. Res. Atmos. 104, 4037–4050. https://doi.org/10.1029/ 1998JD200073. SERNAGEOMIN, 2016a. Reporte de Actividad Volcánica (RAV). Serv. Nac. Geol. y Minería Chile 19, 2–5. SERNAGEOMIN, 2016b. Reporte de Actividad Volcánica (RAV). Serv. Nac. Geol. y Minería Chile 20, 1–6. SERNAGEOMIN, 2016c. Reporte de Actividad Volcánica (RAV). Serv. Nac. Geol. y Minería Chile 21, 1–6. SERNAGEOMIN, 2016d. Reporte de Actividad Volcánica (RAV). Serv. Nac. Geol. y Minería Chile 24, 1–6. SERNAGEOMIN, 2016e. Reporte de Actividad Volcánica (RAV). Serv. Nac. Geol. y Minería Chile 23, 1–4. SERNAGEOMIN, 2016f. Reporte de Actividad Volcánica (RAV). Serv. Nac. Geol. y Minería Chile 22, 1–6. Smith, D.A., Zielinski, R.A., Taylor, H.E., 2017. Leaching Characteristics of Ash from the May 18, 1980, Eruption of Mount St. Helens Volcano. Geological Survey, Washington, U.S. https://doi.org/10.3133/ofr82987. Sparks, R.S.J., et al., 1997. Volcanic Plumes. John Wiley & Sons, Chichester, p. 574. Spinei, E., Carn, S.A., Krotkov, N.A., Mount, G.H., Yang, K., Krueger, A., 2010. Validation of ozone monitoring instrument SO2 measurements in the Okmok volcanic cloud over Pullman, WA. July 2008 J. Geophys. Res. 115, D00L08. https://doi.org/ 10.1029/2009JD013492. Stein, A.F., Draxler, R.R., Rolph, G.D., Stunder, B.J.B., Cohen, M.D., Ngan, F., 2015. NOAA’s HYSPLIT atmospheric transport and dispersion modeling system. Bull. Am. Meteorol. Soc. 96, 2059–2077. https://doi.org/10.1175/BAMS-D-14-00110.1. Stewart, C., Horwell, C., Plumlee, G., Cronin, S., Delmelle, P., Baxter, P., Calkins, J., Damby, D., Morman, S., Oppenheimer, C., 2013. Protocol for Analysis of Volcanic Ash Samples for Assessment of Hazards from Leachable Elements. Stewart, C., Damby, D.E., Tomašek, I., Horwell, C.J., Plumlee, G.S., Armienta, M.A., Hinojosa, M.G.R., Appleby, M., Delmelle, P., Cronin, S., Ottley, C.J., Oppenheimer, C., Morman, S., 2020. Assessment of leachable elements in volcanic ashfall: a review and evaluation of a standardized protocol for ash hazard characterization. J. Volcanol. Geoth. Res. 392 https://doi.org/10.1016/j. jvolgeores.2019.106756. Stuefer, M., Freitas, S.R., Grell, G., Webley, P., Peckham, S., Mckeen, S.A., Egan, S.D., 2013. Inclusion of ash and SO2 emissions from volcanic eruptions in WRF-Chem: development and some applications. Geosci. Model Dev 6, 457–468. https://doi.org/ 10.5194/gmd-6-457-2013. Symonds, R.B., Rose, W.I., Bluth, G.J.S., Gerlach, T.M., 1994. Volcanic gas studies: methods, results and applications. In: Carrol, M.R., Holloway, J.R., Reviews in Mineralogy (Eds.), Volatiles in Magma, Published by Mineral Society of America, vol. 30, pp. 1–66, 1994. Symonds, R.B., Rose, W.I., Reed, M.H., 1988. Contribution of Cl- and F-bearing gases to the atmosphere by volcanoes. Nature 334, 415–418. Tassi, F., Vaselli, O., Caselli, A.T., 2015. Copahue Volcano, Copahue Volcano. https:// doi.org/10.1007/978-3-662-48005-2. Tassi, F., Agusto, M., Lamberti, C., Caselli, A.T., Pecoraino, G., Caponi, C., Szentiványi, J., Venturi, S., Vaselli, O., 2017. The 2012–2016 eruptive cycle at Copahue volcano (Argentina) versus the peripheral gas manifestations: hints from the chemical and isotopic features of fumarolic fluids. Bull. Volcanol. 79, 69. https:// doi.org/10.1007/s00445-017-1151-7. Textor, C., Graf, H.F., Timmreck, C., Robock, A., 2004. Emissions from volcanoes. In: Granier, C., Artaxo, P., Reeves, C.E. (Eds.), Emissions of Atmospheric Trace Compounds, Advances in Global Change Research, vol. 18. Springer, Dordrecht. https://doi.org/10.1007/978-1-4020-2167-1_7. Theys, N., Campion, R., Brenot, H., van Gent, J., Dils, B., Corradini, S., Merucci, L., Coheur, P., van Roozendael, M., Hurtmans, D., Clerbaux, C., Tait, S., Ferrucci, F., 2013. Volcanic SO2 fluxes derived from satellite data: a survey using OMI, GOME-2, IASI and MODIS. Atmos. Chem. Phys. 13, 5945–5968. https://doi.org/10.5194/acp- 13-5945-2013. Theys, N., Hedelt, P., De Smedt, I., Lerot, C., Yu, H., Vlietinck, J., Pedergnana, M., Arellano, S., Galle, B., Fernandez, D., Carlito, C.J.M., Barrington, C., Taisne, B., Delgado-Granados, H., Loyola, D., Van Roozendael, M., 2019. Global monitoring of volcanic SO2 degassing with unprecedented resolution from TROPOMI onboard Sentinel-5 Precursor. Sci. Rep. 9, 1–10. https://doi.org/10.1038/s41598-019-39279- y. Torres, O., Bhartia, P.K., Jethva, H., Ahn, C., 2018. Impact of the ozone monitoring instrument row anomaly on the long-term record of aerosol products. Atmos. Meas. Tech. 11, 2701–2715. https://doi.org/10.5194/amt-11-2701-2018. USEPA, 1997. USEPA Method 200.7: Determination of Metals and Trace Elements in Water and Wastes by Inductively Coupled Plasma – Optic Emission Spectrometry. VAAC, 2016a. Report. In: http://www3.smn.gob.ar/acerca/cenizas/volcanes/copahue/ copahue201610091050.tx. Buenos Aires Volcanic Ash Advisory Center (VAAC). VAAC, 2016b. Report. In: http://www3.smn.gob.ar/acerca/cenizas/volcanes/copahue/ copahue201610272000.txt. Buenos Aires Volcanic Ash Advisory Center (VAAC). Varekamp, J.C., Ouimette, A.P., Herman, S.W., Bermúdez, A., Delpino, D., 2001. Hydrothermal element fluxes from Copahue, Argentina: a ‘beehive’ volcano in turmoil. Geology 29, 1059–1062. Wang, Z., Zheng, F., Zhang, W., Wang, S., 2018. Analysis of SO2 pollution changes of beijing-tianjin-hebei region over China based on OMI observations from 2006 to 2017. Adv. Meteorol. 1–15, 2018. Watson, I.M., Realmuto, V.J., Rose, W.I., Prata, A.J., Bluth, G.J.S., Gu, Y., Bader, C.E., Yu, T., 2004. Thermal infrared remote sensing of volcanic emissions using the moderate resolution imaging spectroradiometer. J. Volcanol. Geoth. Res. 135, 75–89. https://doi.org/10.1016/j.jvolgeores.2003.12.017. Watt, S.F.L., Pyle, D.M., Mather, T.A., Martin, R.S., Matthews, N.E., 2009. Fallout and distribution of volcanic ash over Argentina following the May 2008 explosive eruption of Chaiten, Chile. J. Geophys. Res.-Sol Ea 114, B04207. https://doi.org/ 10.1029/2008JB006219,002009. WHO, 2008. Guidelines for drinking-water quality, , 3er1. World Health Organization, Geneva. https://www.who.int/water_sanitation_health/dwq/fulltext.pdf, 2008. (Accessed 21 May 2021). Wilson, T., Stewart, C., Bickerton, H., Baxter, P., Outes, V., Villarosa, G., 2013. Impacts of the June 2011 Puyehue-Cordón Caulle volcanic complex eruption on urban infrastructure, agriculture and public health.. GNS Science Report. Wilson, G., Wilson, T.M., Deligne, N.I., Cole, J.W., 2014. Volcanic hazard impacts to critical infrastructure: a review. J. Volcanol. Geoth. Res. 286, 148–182. https://doi. org/10.1016/j.jvolgeores.2014.08.030. Witham, C.S., Oppenheimer, C., Horwell, C.J., 2005. Volcanic ash-leachates: a review and recommendations for sampling methods. J. Volcanol. Geoth. Res. 141, 299–326. https://doi.org/10.1016/j.jvolgeores.2004.11.010. P.A. Paez et al.