Downloaded 242 times


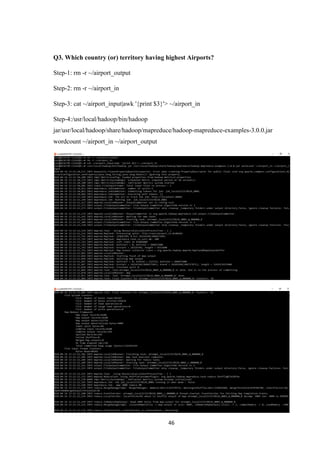
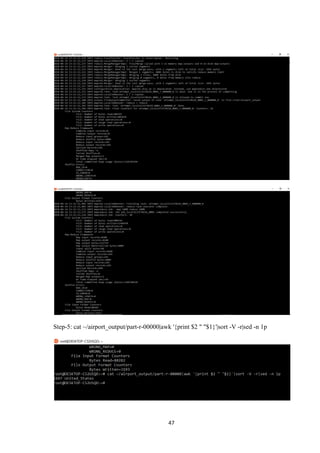
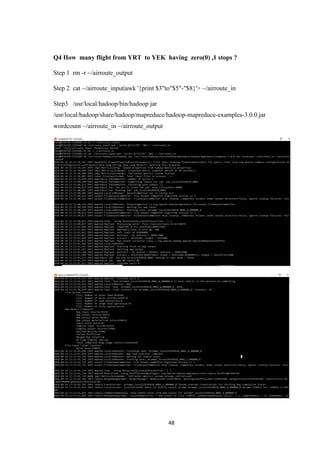
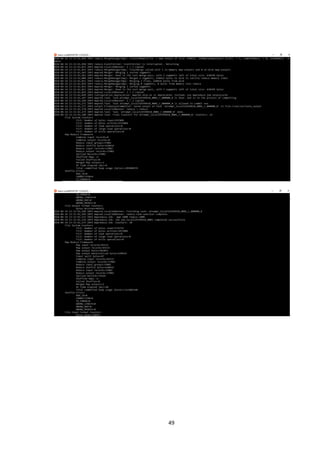
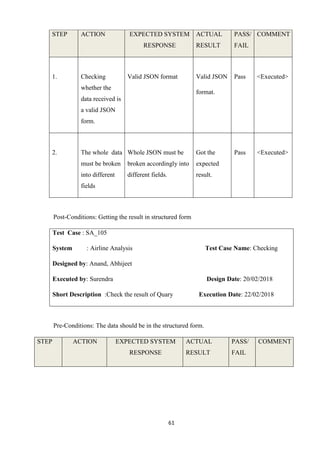
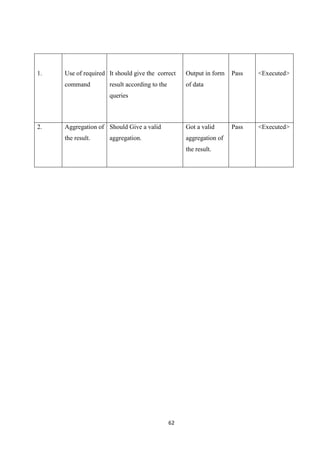
![1
CHAPTER 1
INTRODUCTION
1.1 Introduction[1]
Big Data is not only a Broad term but also a latest approach to analyze a complex and huge
amount of data; there is no single accepted definition for Big Data. But many researchers
working on Big Data have defined Big Data in different ways. One such approach is that it is
characterized by the widely used 4 V’s approach. The first “V” is Volume, from which the Big
Data comes from. This is the data which is difficult to handle in conventional data analytics.
For example, Volume of data created by the BESCOM (Bangalore Electricity Supply
Company) in the process of the power supply and its consumption for Bangalore city or for the
entire Karnataka State generates a huge volume of data. To analyze such data, it is the Big
data that comes to aid of data analytics; the second “V” is velocity, the high speed at which the
data is created, processed and analyzed; the third “V” is variety which helps to analyze the
data like face book data which contains all types of variety, like text messages, attachments,
images, photos and so on; the forth “V” is Veracity, that is cleanliness and accuracy of the
data with the available huge amount of data which is being used for processing.
Researchers working in the structured data face many challenges in analyzing the data. For
instance the data created through social media, in blogs, in Facebook posts or Snap chat. These
types of data have different structures and formats and are more difficult to store in a
traditional business data base. The data in big data comes in all shapes and formats including
structured. Working with big data means handling a variety of data formats and structures. Big
data can be a data created from sensors which track the movement of objects or changes in the
environment such as temperature fluctuations or astronomy data. In the world of the internet](https://image.slidesharecdn.com/andy-180427152518/85/Airline-Analysis-of-Data-Using-Hadoop-12-320.jpg)
![4
CHAPTER 2
OVERALL DESCRIPTION[2]
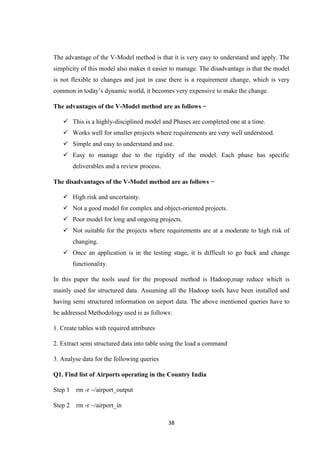
2.1 Product Perspective
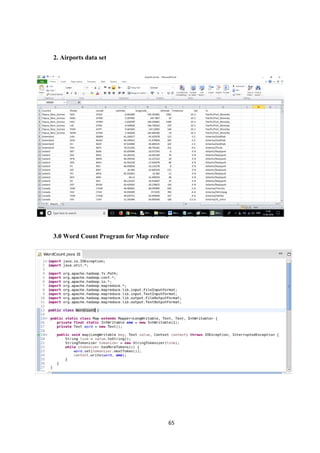
The main purpose of the project to explore detailed analysis on airline data sets such as listing
airports operating in the India, list of airlines having zero stops, list of airlines operating with
code share which country has highest airports and list of active airlines in united states. The
main objective of project is the processing the big data sets using map reduce component of
hadoop ecosystem in distributed environment.
2.2 Product Features
Airline data analysis can provide a solution for businesses to collect and optimize large
datasets, improve performance, improve their competitive advantage, and make faster and
better decisions.
By using airline data analysis we can save time of users.
The data could even be structured, semi-structured or unstructured.
Cost savings
Implementing new strategies
Fraud can be detected the moment it happens
2.3 Operating Environment or Software Environment
Software environment is the term commonly used to refer to support an application. A
software environment for a particular application could include the operating system, the
database system, specific analysis tools .
The software and hardware that we are using in our project Airline data analysis](https://image.slidesharecdn.com/andy-180427152518/85/Airline-Analysis-of-Data-Using-Hadoop-15-320.jpg)
![8
CHAPTER 4
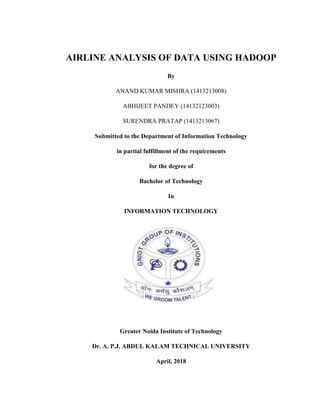
HADOOP DISTRIBUTED FILE SYSTEM – HDFS[3]
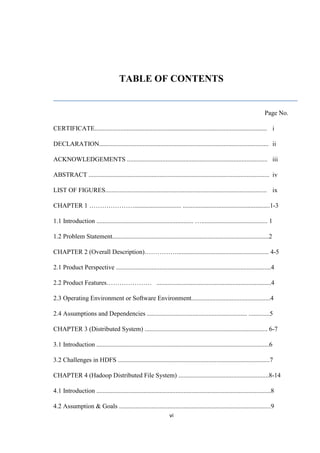
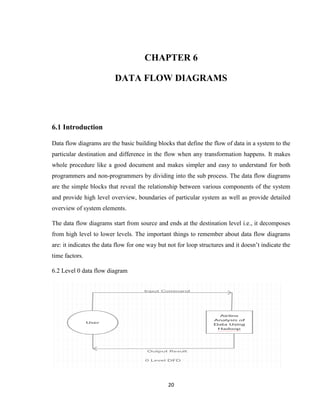
4.1 Introduction
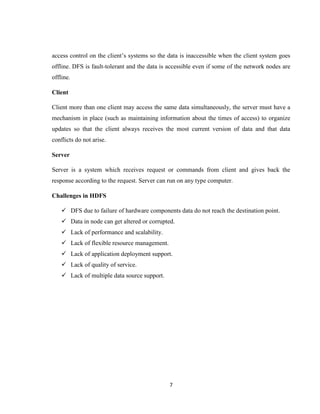
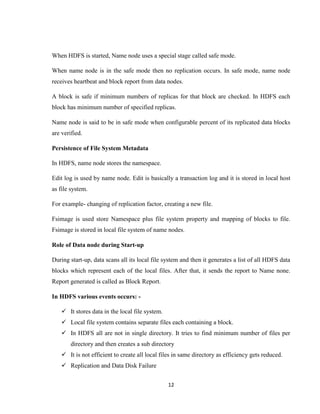
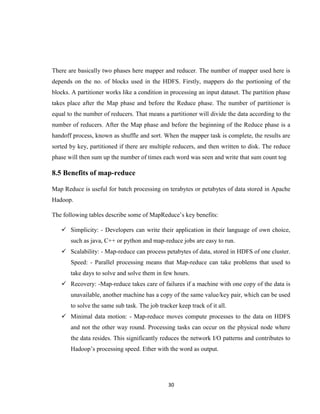
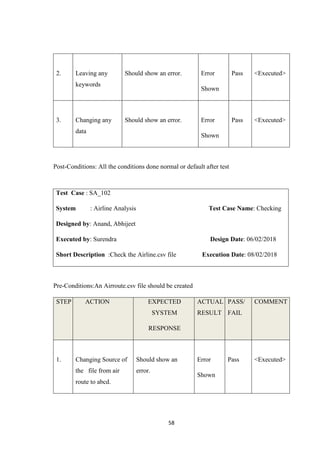
Apache Hadoop is good choice for airline data analysis as it works for distributed big data.
Apache Hadoop is an open source software framework for distributed storage and large scale
distributed processing of data-sets on clusters. Hadoop runs applications using the MapReduce
algorithm, where the data is processed in parallel on different CPU nodes. In short, Hadoop
framework is capable enough to develop applications capable of running on clusters of
computers and they could perform complete statistical analysis for huge amounts of data.
Hadoop MapReduce is a software framework for easily writing applications which process big
amounts of data in-parallel on large clusters (thousands of nodes) of commodity hardware in a
reliable, fault-tolerant manner.
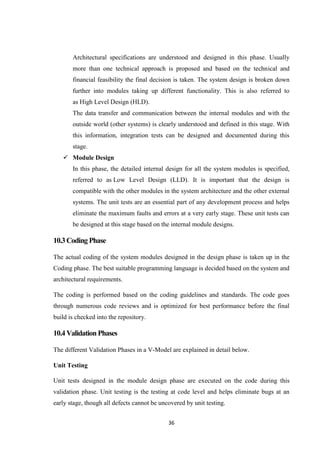
Figure 4.1: HDFS architecture](https://image.slidesharecdn.com/andy-180427152518/85/Airline-Analysis-of-Data-Using-Hadoop-19-320.jpg)

![15
CHAPTER 5
UML DIAGRAMS[4]
UML is a standard language for specifying, visualizing, constructing, and
documenting the artifacts of software systems. UML was created by the Object Management
Group (OMG) and UML 1.0 specification draft was proposed to the OMG in January 1997.
OMG is continuously making efforts to create a truly industry standard. UML is not a
programming language but tools can be used to generate code in various languages using
UML diagrams. UML has a direct relation with object oriented analysis and design. After
some standardization, UML has become an OMG standard.
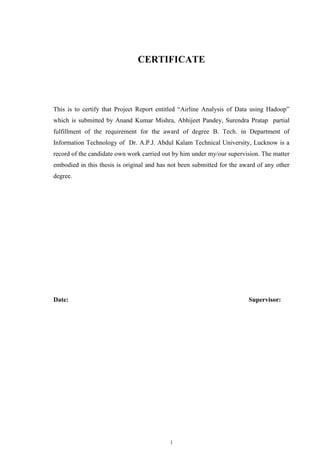
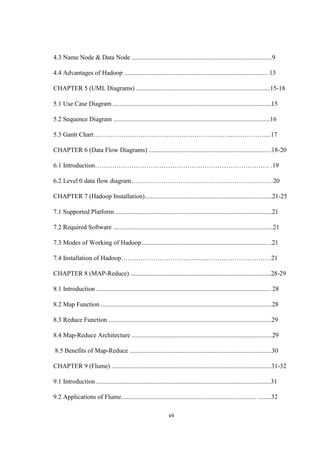
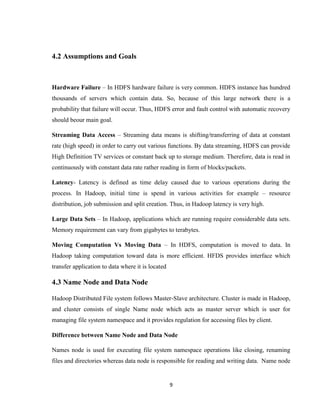
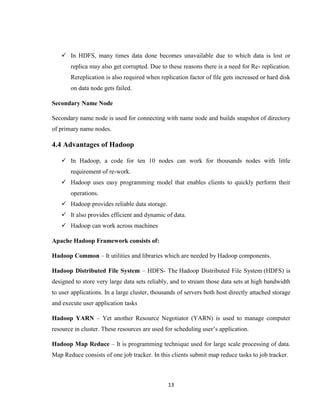
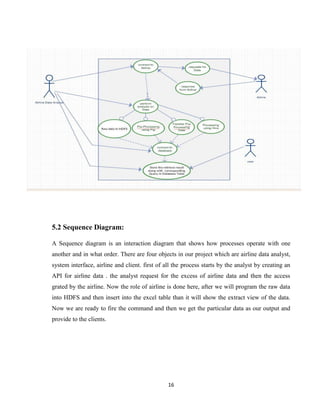
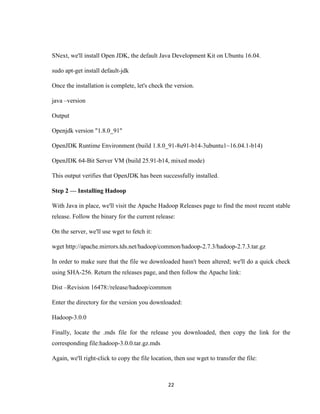
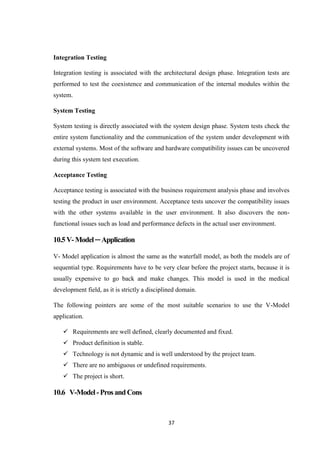
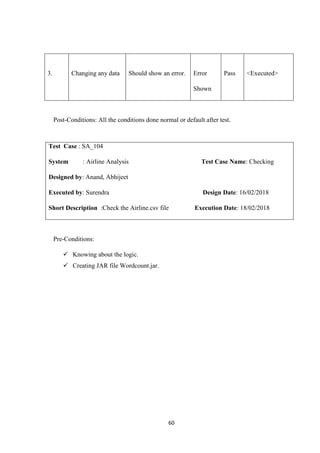
5.1 Use case Diagram:
There are three actors in our project first one is the airline data analyst, second is airline and
the third one is the user. The role of the analyst is to connect to the airline and then create an
API which give the access to the to extract the data from airline. After getting access from
airline using API .we can extract the airline data. Afterwards we will put the data into a excel
table and insert it into HDFS after which the analysis one the particular topic. The analyst will
receive the output by which the client will use the particular data.](https://image.slidesharecdn.com/andy-180427152518/85/Airline-Analysis-of-Data-Using-Hadoop-26-320.jpg)
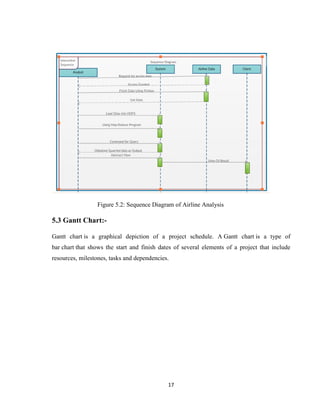
![21
CHAPTER 7
HADOOP INSTALLATION AND SIMULATION[2]
7.1 Supported Platforms
GNU/Linux is supported as a development and production platform
Windows is also a supported platform.
7.2 Required Software
Dataset
UBUNTU - LINUX operating system
APACHE HADOOP FRAMEWORK.
Map Reduce
7.3 Modes of working of Hadoop:
STANDALONE MODE: By default Hadoop is configured to run in a non- distributed mode,
as a single Java process. This is useful for debugging.
PSEUDO DISTRIBUTED MODE: Hadoop can also be run on a single- node in a pseudo-
distributed mode where each Hadoop daemon runs in a separate Java process.
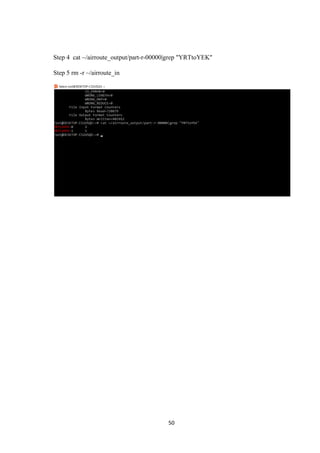
SIMULATIONS: Very first code is to find and displays every match of the given regular
expression. Output is written to the output directory.
7.4 Steps for installing of Hadoop:
Step 1 — Installing Java
To get started, we'll update our package list:
sudo apt-get update](https://image.slidesharecdn.com/andy-180427152518/85/Airline-Analysis-of-Data-Using-Hadoop-32-320.jpg)
![25
/usr/local/hadoop/etc/hadoop/hadoop-env.sh
#export JAVA_HOME=${JAVA_HOME}
export JAVA_HOME=$(readlink -f /usr/bin/java | sed "s:bin/java::")
Step 4 — Running Hadoop
Now we should be able to run Hadoop:
/usr/local/hadoop/bin/hadoop
Output
Usage: hadoop [OPTIONS] SUBCOMMAND [SUBCOMMAND OPTIONS]
Or hadoop [OPTIONS] CLASSNAME [CLASSNAME OPTIONS]
CLASSNAME is a user-provided Java class
OPTIONS is none or any of:
buildpaths attempt to add class files from build tree
--configdir Hadoop config directory
--debug turn on shell script debug mode
--help usage information
hostnames list[of,host,names] hosts to use in slave mode
hosts filename list of hosts to use in slave mode
loglevel level set the log4j level for this command
workers turn on worker mode
SUBCOMMAND is one of:
Admin Commands:
daemonlog get/set the log level for each daemon
Client Commands:
archivecreate a Hadoop archive](https://image.slidesharecdn.com/andy-180427152518/85/Airline-Analysis-of-Data-Using-Hadoop-36-320.jpg)
![27
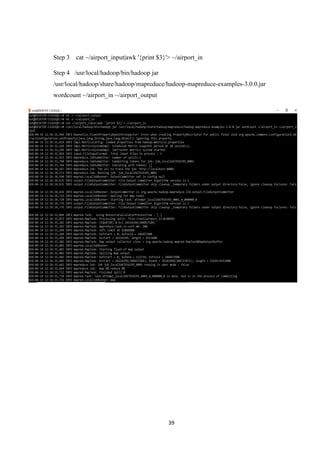
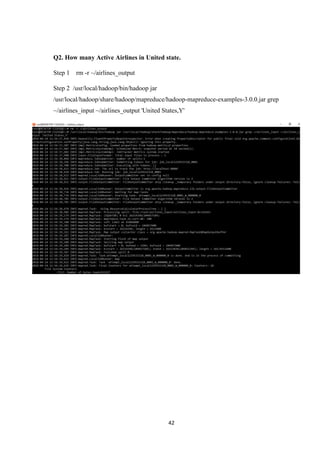
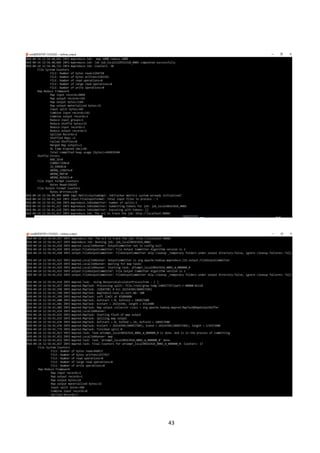
Next, we can use the following command to run the MapReducehadoop-mapreduce-examples
program, a Java archive with several options. We'll invoke its grep program, one of many
examples included in hadoop-mapreduce-examples, followed by the input directory, input and
the output directory grep_example. The MapReduce grep program will count the matches of a
literal word or regular expression. Finally, we'll supply a regular expression to find
occurrences of the word principal within or at the end of a declarative sentence. The
expression is case-sensitive, so we wouldn't find the word if it were capitalized at the
beginning of a sentence:
/usr/local/hadoop/bin/hadoop jar /usr/local/hadoop/share/hadoop/mapreduce/hadoop-
mapreduce-examples-3.0.0.jar grep ~/input ~/grep_example'principal[.]*'
When the task completes, it provides a summary of what has been processed and errors it has
encountered, but this doesn't contain the actual results.
Output
atjava.lang.reflect.Method.invoke(Method.java:498)
atorg.apache.hadoop.util.RunJar.run(RunJar.java:221)
atorg.apache.hadoop.util.RunJar.main(RunJar.java:136)](https://image.slidesharecdn.com/andy-180427152518/85/Airline-Analysis-of-Data-Using-Hadoop-38-320.jpg)
![29
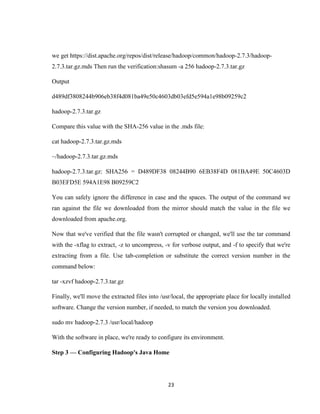
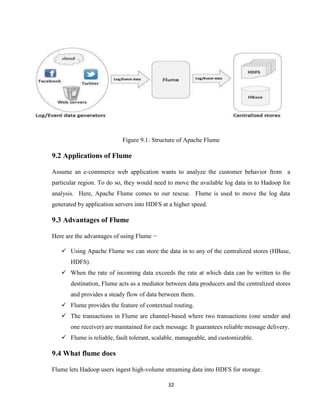
8.3 Reduce function: -
Reduces a set of intermediate values which share a key to a smaller set of values.
Reducer has 3 primary phases:
Shuffle
Reducer is input the grouped output of a mapper. In the phase the framework, for each
Reducer, fetches the relevant partition of the output of all the Mappers.
Sort
The framework groups Reducer inputs by keys (since different Mappers may have output the
same key) in this stage. The shuffle and sort phases occur simultaneously i.e. while outputs are
being fetched they are merged.
Reduce
In this phase the reduce (object, iterator, outputcollector, reporter) method is called for each <
(key, (list of values)> pair in the grouped inputs
8.4 Map-reduce architecture[5]
Figure 8.4: Diagram of Mapper and Reducer](https://image.slidesharecdn.com/andy-180427152518/85/Airline-Analysis-of-Data-Using-Hadoop-40-320.jpg)
![31
Chapter 9
FLUME[6]
9.1 Introduction
Apache Flume is a tool/service/data ingestion mechanism for collecting aggregating and
transporting large amounts of streaming data such as log files, events (etc...) from various
sources to a centralized data store. Flume is a highly reliable, distributed, and configurable
tool. It is principally designed to copy streaming data (log data) from various web servers to
HDFS.
It is a very use case is collecting log data from one system-a bank of web servers, for example-
and aggregating it in HDFS for later analysis. Flume supports a large variety of sources, some
of the more commonly used ones include tail (which pipes data from a local file being written
into the flume, just like Unix tail), syslog, and Apache log4j (allowing java applications to
write events to files in HDFS via flume).
Flume nodes can be arranged in arbitrary topologies. Typically, there is a node running on
each source machine (each web server, for example), with tiers of aggregating nodes that the
data flows through on its way to HDFS. Flumes offers different levels of delivery reliability,
from best effort delivery, which doesn’t tolerate any flume node failures, to end to end, which
guarantees delivery even in the event of multiple flume node failures between the source and
HD.](https://image.slidesharecdn.com/andy-180427152518/85/Airline-Analysis-of-Data-Using-Hadoop-42-320.jpg)
![34
CHAPTER 10
METHODOLOGY[8]
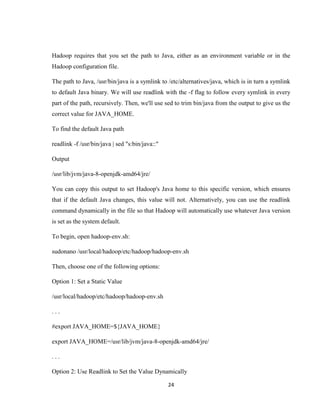
This Project is based on V-model SDLC (Software Development Life Cycle)
The V-model is an SDLC model where execution of processes happens in a sequential
manner in a V-shape. It is also known as Verification and Validation model.
The V-Model is an extension of the waterfall model and is based on the association of a
testing phase for each corresponding development stage. This means that for every single
phase in the development cycle, there is a directly associated testing phase. This is a
highly-disciplined model and the next phase starts only after completion of the previous
phase.
10.1V-Model -Design
Under the V-Model, the corresponding testing phase of the development phase is planned
in parallel. So, there are Verification phases on one side of the ‘V’ and Validation phases
on the other side. The Coding Phase joins the two sides of the V-Model.
The following illustration depicts the different phases in a V-Model of the SDLC.](https://image.slidesharecdn.com/andy-180427152518/85/Airline-Analysis-of-Data-Using-Hadoop-45-320.jpg)

![54
CHAPTER 11
TESTING[8]
Software testing is an investigation conducted to provide stakeholders with information
about the quality of the software product or service under test Software testing can also
provide an objective, independent view of the software to allow the business to appreciate
and understand the risks of software implementation. Test techniques include the process
of executing a program or application with the intent of finding software bugs (errors or
other defects), and verifying that the software product is fit for use.
Software testing involves the execution of a software component or system component to
evaluate one or more properties of interest. In general, these properties indicate the extent
to which the component or system under test
Meets the requirements that guided its design and development,
Responds correctly to all kinds of inputs,
Performs its functions within an acceptable time,
Is sufficiently usable,
Can be installed and run in its intended environments, and
Achieves the general result its stakeholder’s desire.
As the number of possible tests for even simple software components is practically infinite,
all software testing uses some strategy to select tests that are feasible for the available time
and resources. As a result, software testing typically (but not exclusively) attempts to
execute a program or application with the intent of finding software bugs (errors or other
defects). The job of testing is an iterative process as when one bug is fixed, it can
illuminate other, deeper bugs, or can even create new ones.
Software testing can provide objective, independent information about the quality of
software and risk of its failure to users or sponsors.[1]](https://image.slidesharecdn.com/andy-180427152518/85/Airline-Analysis-of-Data-Using-Hadoop-65-320.jpg)

![66
REFERENCES
[1] http://cra.org/ccc/wpcontent/uploads/sites/2/2015/05 /bigdatawhitepaper.pdf
[2] www.ijcsmc.com/docs/papers/June2017/V6I6201764.pdf
[3] https://hadoop.apache.org/docs/r1.2.1/hdfs_design.html
[4] https://www.uml-diagrams.org/index-examples.html.
[5] https://www.researchgate.net/figure/The-MapReduce-architecture-MapReduce-
[6] https://flume.apache.org/
[7] https://www.digitalocean.com/community/tutorials/how-to-install-hadoop-in-stand-
alone-mode-on-ubuntu-16-04
[8] https://www.tutorialspoint.com/sdlc/sdlc_v_model.htm
[9] https://www.ten10.com/types-testing-introduction-different-types-software-testing](https://image.slidesharecdn.com/andy-180427152518/85/Airline-Analysis-of-Data-Using-Hadoop-77-320.jpg)

The document discusses a project on airline data analysis using Hadoop by students from the Department of Information Technology. It emphasizes the challenges of big data management in the airline industry and proposes a model to analyze extensive datasets related to flights, routes, and airport operations. The project aims to employ various analytical techniques to improve data handling and decision-making in aviation.


![{[American Airlines Student Discount ]}★ Booking Guide 2026.pptx](https://cdn.slidesharecdn.com/ss_thumbnails/americanairlinesstudentdiscountbookingguide2026-260131065509-90065aae-thumbnail.jpg?width=640&height=640&fit=bounds)