Recommended

Recommended
More Related Content
What's hot
What's hot (20)
Similar to Retrieving atmospheric profiles from hyperspectral data via deep learning
Similar to Retrieving atmospheric profiles from hyperspectral data via deep learning (20)
Recently uploaded
Recently uploaded (20)
Retrieving atmospheric profiles from hyperspectral data via deep learning
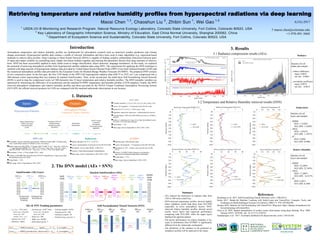
- 1. Retrieving temperature and relative humidity profiles from hyperspectral radiations via deep learning Maosi Chen 1,† , Chaoshun Liu 2 , Zhibin Sun 1 , Wei Gao 1,3 1 USDA UV-B Monitoring and Research Program, Natural Resource Ecology Laboratory, Colorado State University, Fort Collins, Colora do 80523, USA 2 Key Laboratory of Geographic Information Science, Ministry of Education, East China Normal University, Shanghai 200062, China 3 Department of Ecosystem Science and Sustainability, Colorado State University, Fort Collins, Colorado 80523, USA Introduction Atmospheric temperature and relative humidity profiles are fundamental for atmospheric research such as numerical weather prediction and climate change assessment. Hyperspectral satellite data contain a wealth of relevant information and have been used in many algorithms (e.g. regression-based methods) to retrieve these profiles. Deep Learning or Deep Neural Network (DNN) is capable of finding complex relationships (functions) between pairs of input and output variables by assembling many simple non-linear modules together and learning the parameters therein from large amounts of observa- tions. DNN has been successfully applied in many fields (such as image classification, object detection, language translation). In this study, we explored the potential of retrieving atmospheric profiles from hyperspectral satellite radiation data using DNN. The requirement for applying the DNN technique is satisfied with large amount of hyperspectral radiance data provided by United States Suomi National Polar (NPP) Cross-track Infrared Sounder (CrIS) and the reanalyzed atmospheric profiles data provided by the European Centre for Medium-Range Weather Forecasts (ECMWF). The proposed DNN consists of two consecutive parts. In the first part, the first 1245 bands of the NPP CrIS hyperspectral radiance data (648.75 to 2555 cm-1 ) are compressed into a 300-element vector representing their key features by stacked AutoEncoders. Then, in the second part, the multi-layer Self-Normalizing Neural Network (SNN) is used to map the compressed vector (of 300 elements) into 55-layer temperature and relative humidity profiles. The DNN trainable variables are optimized by minimizing the difference of its predictions and the matched ECMWF temperature and humidity profiles (53230 samples). Finally, the DNN retrieved atmospheric temperature and relative humidity profiles and those provided by the NOAA Unique Combined Atmospheric Processing System (NUCAPS, the official retrieval products for CrIS) are compared with the matched radiosonde observations at one location. 3. Results Temperature References Klambauer et al. 2017. Self-Normalizing Neural Networks. arXiv:1706.02515 Géron 2017. Hands-On Machine Learning with Scikit-Learn and TensorFlow. Concepts, Tools, and Techniques to Build Intelligent Systems (1st Edition). ISBN-13: 978-1491962299. Danijar 2018. Patterns for Fast Prototyping with TensorFlow. Blog post. https://danijar.com/patterns-for- fast-prototyping-with-tensorflow Chen et al. 2018. Spatial interpolation of surface ozone observations using deep learning. Proc. SPIE. Volumn 10767, 107670C. doi: 10.1117/12.2320755 Sundararajan, et al. 2017. Axiomatic attribution for deep networks. arXiv:1703.01365. A31G-2917 † maosi.chen@colostate.edu +1-970-491-3604 1. Datasets Summary AEs reduced the dimension of radiance data from 1245 to 300 with a small loss. SNN-retrieved temperature profiles showed slightly better validation results than those from NUCAPS (especially in lower atmospheric layers). SNN- retrieved relative humidity profiles showed mixed results: lower layers had improved performance comparing with NUCAPS, while the upper layers displayed an opposite pattern. The poorer performance on relative humidity is be- cause its distribution from ECMWF is significantly different from the radiosonde counterparts. The attribution of the radiance to the predicted at- mospheric profiles will be analyzed in the future. 3.1 Radiance compression results (AEs) Statistics for all bands and samples relative difference mean: 0.0055 std. dev.: 0.0063 correlation coefficient mean: 0.9974 std. dev.: 0.0014 Inputs Outputs Hyperspectral Radiance Atmospheric Profiles (Temperature / Relative Humidity) European Centre for Medium-Range Weather Forecasts (ECMWF) Radiosonde Observations NOAA Unique Combined Atmospheric Processing Systems (NUCAPS) Training Validation Comparison Suomi National Polar (NPP) Cross-track Infrared Sounder (CrIS) Training DNN NUCAPS Available Variables: T, rh, O3, CH4, CO2, CO, SO2, HNO3, N2O Layers: 101 (original) → 55 pressure levels (96-1014 mb) Resolution: 0.5º x 0.5º (3 x 3 FOV array), daily Algorithm: eigenvector regression + infrared physical retrieval Training dataset: NPP CrIS, NPP ATMS (microwave), ECMWF analysis Archive: Comprehensive Large Array-Data Stewardship System (CLASS): www.nsof.class.noaa.gov Cloud Mask: < 15% Date range: June to September in 2014, 2015, 2016 NPP CrIS Instrument: Fourier transform spectrometer, 2200 km swath width, 30 Earth-scene views. Each field consists of 9 fields of view (3x3 array). Bands: long-wave IR (LWIR, 717 bands, 648.75-1096.75 cm-1 , freq. incr.: 0.625 cm -1 , ), mid-wave IR (MWIR, 437, 1207.5-1752.5 cm-1 , freq. incr.: 1.25 cm-1 ), short- wave IR (SWIR, 2150-2555 cm-1 , freq. incr.: 2.5 cm-1 ). First 1245 bands used. Resolution: 15 km x 15 km (single FOV), daily. Archive: CrIS SDR files are archived in NOAA Comprehensive Large Array-data Stewardship System (CLASS). Cloud Mask: < 15% Date range: June to September in 2014, 2015 ECMWF Dataset name: ERA-Interim, daily Layers: 60 (original) → 55 pressure levels (96-1014 mb) Resolution: 0.125º , 4 times a day (use the one at 6:00 UTC). Archive: ECMWF Public Datasets web interface, apps.ecmwf.int/datasets/data/interim-full-daily/ Cloud Mask: < 15% Date range: June to September in 2014, 2015 Radiosonde Station: Baoshan (31.4º N, 21.45º E) Layers: interpolated to 55 pressure levels (96-1014 mb) Resolution: Twice a day (00:00, 12:00 UTC) Archive: China Meteorological Administration Date range: June to September in 2014, 2015, 2016 2. The DNN model (AEs + SNN) inputs (1245) hidden AE(0) (1100) hidden AE(1) (900) hidden AE(2) (700) hidden AE(3) (500) hidden AE(4) (300) AE 0 Forward restored hidden AE(3) (500) restored hidden AE(2) (700) restored hidden AE(1) (900) restored hidden AE(0) (1100) AE 1 Forward AE 2 Forward AE 3 Forward AE 4 Forward AE 4 Backward AE 3 Backward AE 2 Backward AE 1 Backward AE 0 Backward restored inputs (1245) AutoEncoder (AE) Layer inputs AE(Lyr) (ni,Lyr) hidden AE(Lyr) (nh,Lyr) Dense Act.: elu Init.: norm Reg.: L2 Dense Act.: none Init.: norm Reg.: L2 restored AE(Lyr) (ni,Lyr) AE Forward Pass (building block for stacking) AE Backward Pass (for training only) Stacked AutoEncoders (AEs) Self-Normalization Neural Network (SNN) 2( , ) ( )SNN SNN SNNLoss MSE predicted observed L weights AEs & SNN Training parameters ( ) ( ) ( ) 2 ( )( , ) ( )AE Lyr AE Lyr AE Lyr AE AE LyrLoss MSE restored inputs L weights λAE, λSNN: 0.01 (init.) decay steps: 30 epochs decay rate: 0.84 scaling: 1/(nin × nout) dropout rate: 0.05 Optimizer: Adam learning rate: 3x10⁻⁵ (init.) decay steps: 30 epochs decay rate: 0.96 Batch size: 200 Buffer size: 60,000 Read ahead epochs: 1 Training samples: 53230 Training epochs: 300 Validation samples: 20 Validation freq. (epochs): 5 Original Recovered Recovered - Original | Recovered - Original | / Original x 100 Relative differences reduced by samples One NPP CrIS radiance sample 05:42:25 UTC, June 11, 2015 34.125º N, 117.5º E 3.2 Temperature and Relative Humidity retrieval results (SNN) Statistics for all layers and samples RMSE SNN: 1.3358ºC NUCAPS: 1.5100ºC MAE: SNN: 1.0161ºC NUCAPS: 1.1591ºC R2 : SNN: 0.9982 NUCAPS: 0.9980 Radiance Relative Humidity Statistics for all layers and samples RMSE SNN: 23.299% NUCAPS: 22.549% MAE: SNN: 17.289% NUCAPS: 16.527% R2 : SNN: 0.4071 NUCAPS: 0.3096 Dense SELU Alpha Dropout L2 reg. SNN inputs (300) Batch Normalization hidden AE(4) (300) SNN out(0) (259) SNN (Layer 0) Dense SELU Alpha Dropout L2 reg. SNN out(1) (218) SNN (Layer 1) SNN (Layers 2-4) SNN out(4) (95) … Dense Linear L2 reg. Predicted (55)