Download to read offline


![Dynamic indoor thermal comfort model identification based on
neural computing PMV index
K S Mohamed Sahari, M F Abdul Jalal, R Z Homod, Y K Eng
Centre for Advanced Mechatronics and Robotics (CAMaRo), Universiti Tenaga
Nasional, Putrajaya Campus, Jalan IKRAM-UNITEN, 43000, Kajang, Selangor,
Malaysia
E-mail: khairuls@uniten.edu.my
Abstract. This paper focuses on modelling and simulation of building dynamic thermal comfort
control for non-linear HVAC system. Thermal comfort in general refers to temperature and also
humidity. However in reality, temperature or humidity is just one of the factors affecting the
thermal comfort but not the main measures. Besides, as HVAC control system has the
characteristic of time delay, large inertia, and highly nonlinear behaviour, it is difficult to
determine the thermal comfort sensation accurately if we use traditional Fanger’s PMV index.
Hence, Artificial Neural Network (ANN) has been introduced due to its ability to approximate any
nonlinear mapping. Using ANN to train, we can get the input-output mapping of HVAC control
system or in other word; we can propose a practical approach to identify thermal comfort of a
building. Simulations were carried out to validate and verify the proposed method. Results show
that the proposed ANN method can track down the desired thermal sensation for a specified
condition space.
1. Introduction
Thermal comfort can be defined as the state of mind which expresses satisfaction with the thermal
environment, and therefore it depends on the individual’s physiology and psychology [1]. As each
building presents its own constructional characteristics and occupant’s habit, most common HVAC
systems are incapable of providing thermal comfort by taking into account these variations, further
increasing energy consumptions. To solve the problems, selection of suitable control system such as
neural computing Predictive Mean Vote (PMV) indices is important to consider the indoor ambiences and
occupants’ habits to achieve optimal thermal comfort, hence minimize the percentage of dissatisfaction
and subsequently reduce energy consumption.
HVAC control system has the characteristic of time delay, large inertia, and highly nonlinear
behaviour, making it is difficult to determine the thermal comfort sensation accurately if we use
traditional Fanger’s PMV index [2]. Hence, in this paper, Artificial Neural Network (ANN) has been
introduced due to its ability to approximate any nonlinear mapping. Using ANN to train, we can get the
input-output mapping of HVAC control system or in other word; we can propose a practical approach to
identify thermal comfort of a building.
2. Modelling Approach
PMV indices are adopted in this paper. In the calculation, six variables were taken into consideration:
two personal dependant variables which are clothing insulation and occupant’s activity level; four
environmental dependent variables which are air temperature, air humidity, mean radiant temperature,
4th International Conference on Energy and Environment 2013 (ICEE 2013) IOP Publishing
IOP Conf. Series: Earth and Environmental Science 16 (2013) 012113 doi:10.1088/1755-1315/16/1/012113
Content from this work may be used under the terms of the Creative Commons Attribution 3.0 licence. Any further distribution
of this work must maintain attribution to the author(s) and the title of the work, journal citation and DOI.
Published under licence by IOP Publishing Ltd 1](https://image.slidesharecdn.com/dynamicindoorthermalcomfortmodelidentificationbasedonneuralcomputingpmvindex-170910142220/85/Dynamic-indoor-thermal-comfort-model-identification-based-on-neural-computing-pmv-index-2-320.jpg)
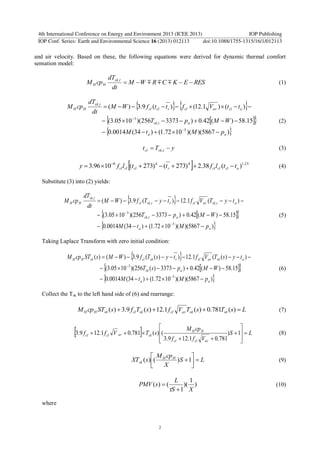
![τ =
X
cpM HH
(11)
781.01.129.3 arclcl VffX (12)
)5867()107.1()34(0014.0)(15.5842.0
)3373(1005.3
155.0
)(1.12)()(
5
3
aa
a
cl
aarclr
pMtMWM
p
l
y
tyVftyWML
(13)
where S is heat rate storage in a body, M is metabolism, W is External work, R is heat exchange by
radiation, C is heat exchange by convection, K is heat exchange by conduction, E is heat loss by
evaporation, RES is heat exchange by respiration, MH is mass of human body in (kg), cpH is specific heat
of human body in (J/kg.˚C), Tsk,t is skin’s temperature at time t in (˚C), tcl is surface temperature of
clothing in (˚C), fcl is ratio of the surface area of the clothed body to surface area of nude body and
pa is water vapor pressure in (kPa).
It is noted that the value of tcl in equation (3) is to be calculated iteratively in finding the roots of
nonlinear equation. A first guessed value of tcl will be introduced to the second member in equation (3). If
the initial guess value of tcl is far from root, it will consume a long time to converge to the root. Therefore,
the initial guessed value in this research was taken by averaging the air temperature ta and skin
temperature Tsk.
To make sure the equation used for each term in the transient heat balance equation correct or not,
sample input will be supplied and heat transfer for each term has to be calculated out and the result has to
be validated using the excel spread sheet of ISO 7730 PMV calculator [3]. Based on comparison between
manual calculations and values obtained using ISO 7730 PMV calculator, it can be shown that heat
transfer for each term in equation (1) is quite similar for both approaches. Hence, the equations are
validated and can be used for model derivation.
3. Application of Artificial Neural Network (ANN)
From equations (1) to (13), we can observe that the PMV value calculation is very complicated if
using manual calculation. In addition, the determination of tcl value using equation (6) may take long
computing time due to iterative native of the equation and hence it is not practical to determine PMV
value in real time application. In order to solve this problem, a nonlinear identification model, Artificial
Neural Network (ANN) is introduced to approximate nonlinear relationship between input and output
value.
Since PMV value is affected most by the six thermal variables; indoor air temperature, mean radiant
temperature, indoor air humidity, human metabolism, air velocity, and thermal clothing insulation,
therefore the input layer dimension chosen is 6-dimensional. For output layer, there is only one PMV
value hence the dimension for output layer chosen is one-dimensional. 3 hidden layers are used to reduce
the complexity of calculation. To ensure the output is not fall into the flat area at the beginning of study,
the initial weight values are randomly generated, and the values are relatively small so that each neuron
can learns from the biggest change in the local activation function. Learning rate of 0.10 is selected for
this research.
4. Simulation Results
All simulations are conducted using our previous building model in Matlab environment [4]. Figure 1
(a) shows the graph of dynamic PMV thermal comfort value against 43000 samples data. As can be seen
from the graph, the black colour curve is the model or dynamic PMV output while the red colour curve is
the plant or neural network model output. The result from this graph showed that neural network can
learn well or mimic dynamic PMV thermal comfort since both the curves are quite similar. Based on the
specified minimum desired error of 0.0001, the network training achieved the desired goal error at epochs
4th International Conference on Energy and Environment 2013 (ICEE 2013) IOP Publishing
IOP Conf. Series: Earth and Environmental Science 16 (2013) 012113 doi:10.1088/1755-1315/16/1/012113
3](https://image.slidesharecdn.com/dynamicindoorthermalcomfortmodelidentificationbasedonneuralcomputingpmvindex-170910142220/85/Dynamic-indoor-thermal-comfort-model-identification-based-on-neural-computing-pmv-index-4-320.jpg)
![200. The derived dynamic PMV equation was then validated by comparing the trained dynamic neural
computing PMV index with TS-Fuzzy Logic model as shown in Figure 1 (b). The result showed that
human thermal comfort evaluation model established in this paper agreed well with existing research
results, and may directly be used in future research work.
Figure 1 (c) shows the result from practical approach of PMV thermal comfort identification using
Artificial Neural Network, the training and validation data. The dashed lines in each graph indicate the
perfect result. The correlation coefficient R value is an indication of the relationship between outputs and
targets. The R value of training and validation are 0.99969 and 0.99971 respectively. This indicates that
there is an exact linear relationship between outputs and targets. It can be said that for this simulation, the
overall performance indicates a good fit.
(b) PMV Performance of ANN and TS-Fuzzy Logic Model (c) Regression Analysis
Figure 1. Simulation results for validation of proposed method
5. Conclusion
The results proved that human thermal comfort evaluation model established in this paper agreed well
with existing research results, and may directly be used in future research work. Results also show that
the proposed ANN method can track down the desired PMV thermal comfort for a specified condition
space.
6. Acknowledgement
The authors would like to sincerely thank the Ministry of Higher Education (MOHE) of Malaysia for the
provision of a FRGS grant to support this work.
References
[1] ISO7730 2005 Ergonomics of the thermal environment-- Analytical determination and
interpretation of thermal comfort using calculation of the PMV and PPD indices and local
thermal comfort criteria
[2] Fanger, P O 1972 Thermal comfort analysis and applications in environment engineering
(New York: Mcgraw-Hill)
[3] ISO7730 PMV calculator from http://www.eat.lth.se/fileadmin/eat/Termisk_miljoe/PMV-
PPD.html
[4] Homod, R Z, Sahari, K S M., Almurib, H A F., Nagi, F H. 2011 Energy and Buildings 43
2046-2049.
(a) Dynamic PMV value
ANN
TS-Fuzzy Logic
4th International Conference on Energy and Environment 2013 (ICEE 2013) IOP Publishing
IOP Conf. Series: Earth and Environmental Science 16 (2013) 012113 doi:10.1088/1755-1315/16/1/012113
4](https://image.slidesharecdn.com/dynamicindoorthermalcomfortmodelidentificationbasedonneuralcomputingpmvindex-170910142220/85/Dynamic-indoor-thermal-comfort-model-identification-based-on-neural-computing-pmv-index-5-320.jpg)

This document summarizes a study that used artificial neural networks to model and identify dynamic indoor thermal comfort based on the PMV index. The study developed equations to model thermal comfort based on factors like air temperature, humidity, clothing insulation, and metabolism. An artificial neural network was then trained using these equations to approximate the nonlinear relationship between inputs like temperature and outputs like predicted mean vote. Simulation results showed the neural network model could accurately track desired thermal sensations and matched existing fuzzy logic models of human thermal comfort. The neural network approach provides a practical method for real-time identification of thermal comfort that is better than traditional manual calculations.