Download to read offline
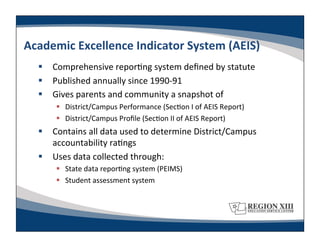
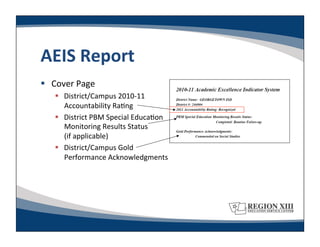
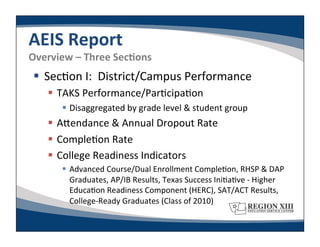
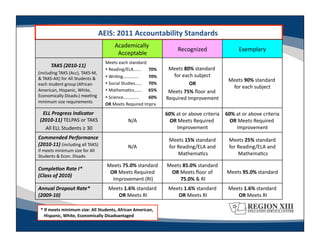

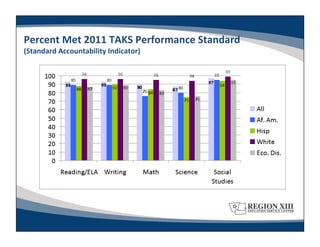
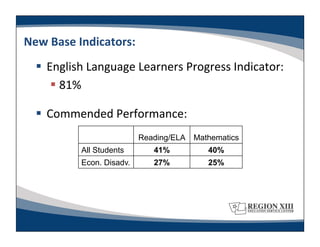
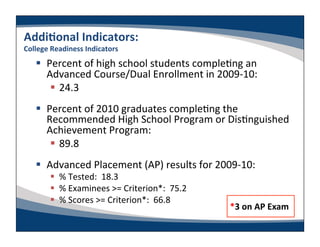
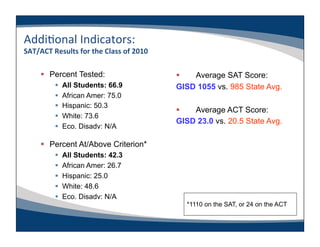
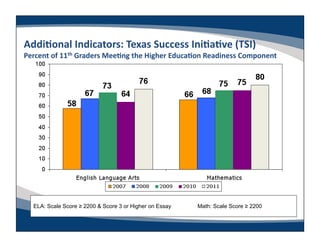
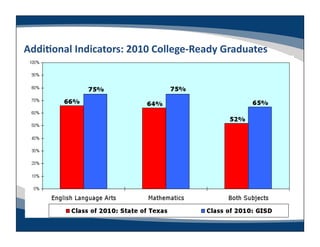
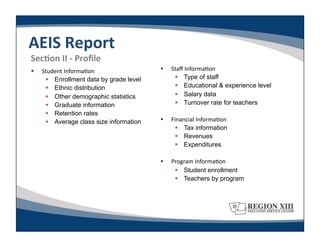
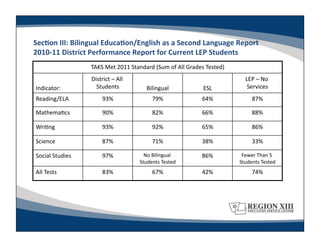
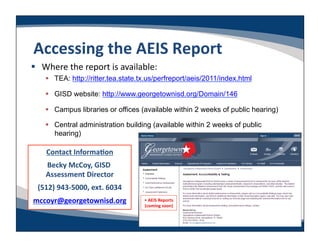

This document provides an overview and summary of the Academic Excellence Indicator System (AEIS) annual report for Georgetown ISD for 2010-11. The AEIS is a comprehensive reporting system defined by statute that gives parents and the community a snapshot of district and campus performance and profiles. Key data in the AEIS includes TAKS performance rates, attendance, dropout rates, completion rates, and college readiness indicators. The document reviews accountability standards and indicates that for 2011, Georgetown ISD and several of its campuses met the standards for Recognized or Exemplary ratings while others were Academically Acceptable. Specific student performance data is also presented.


