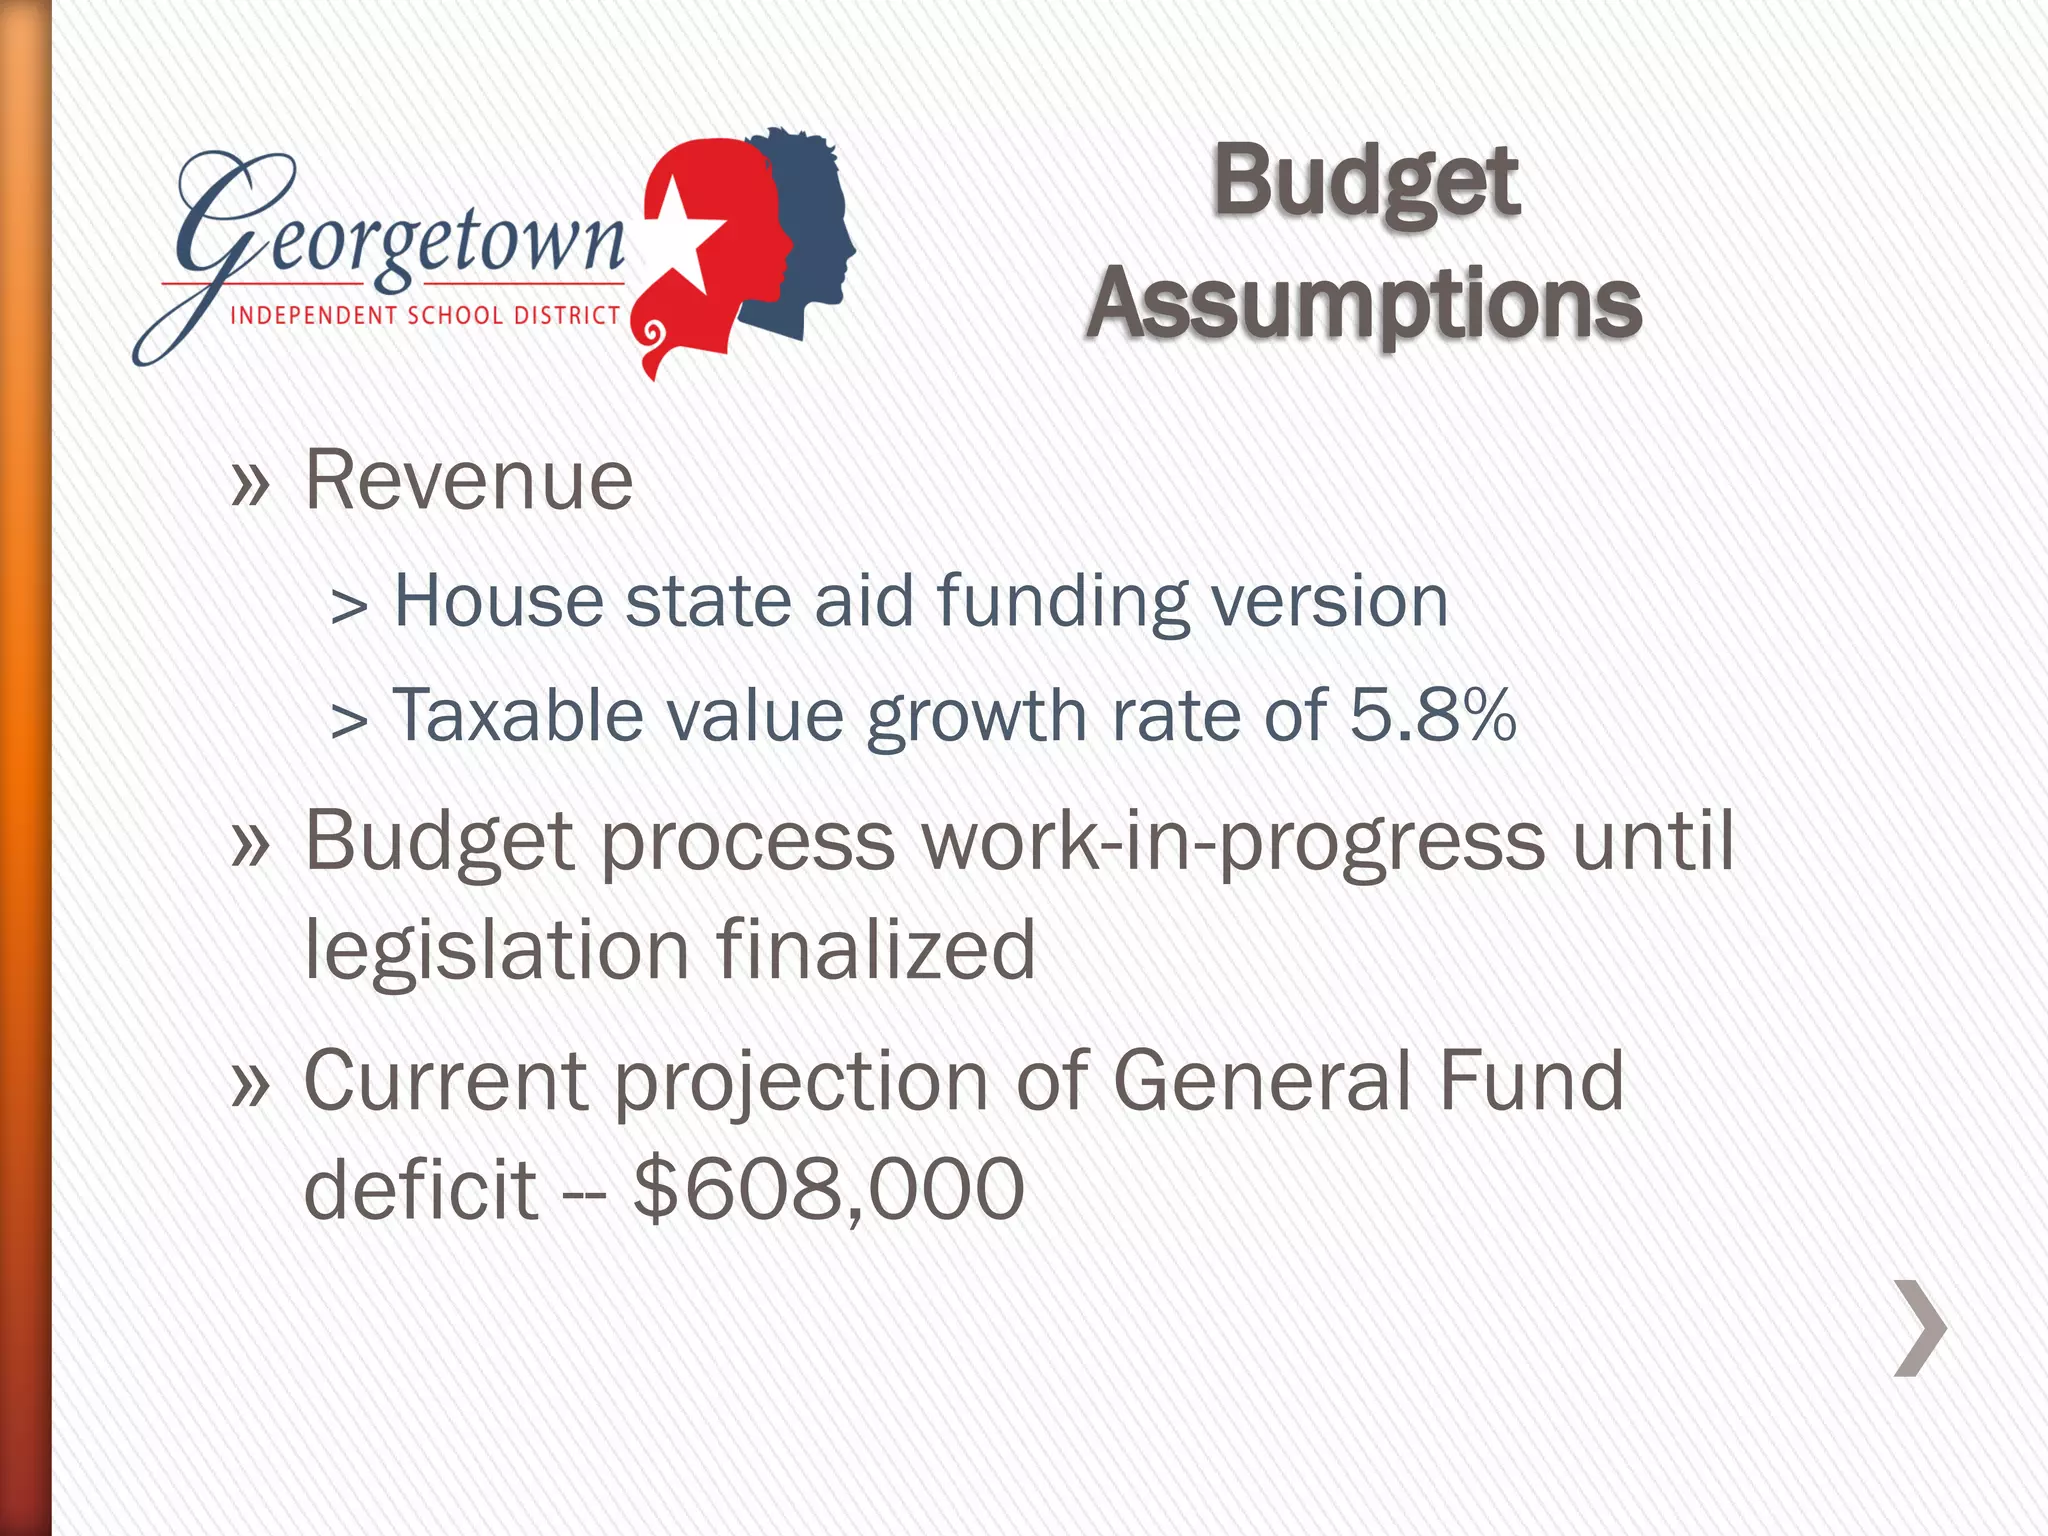
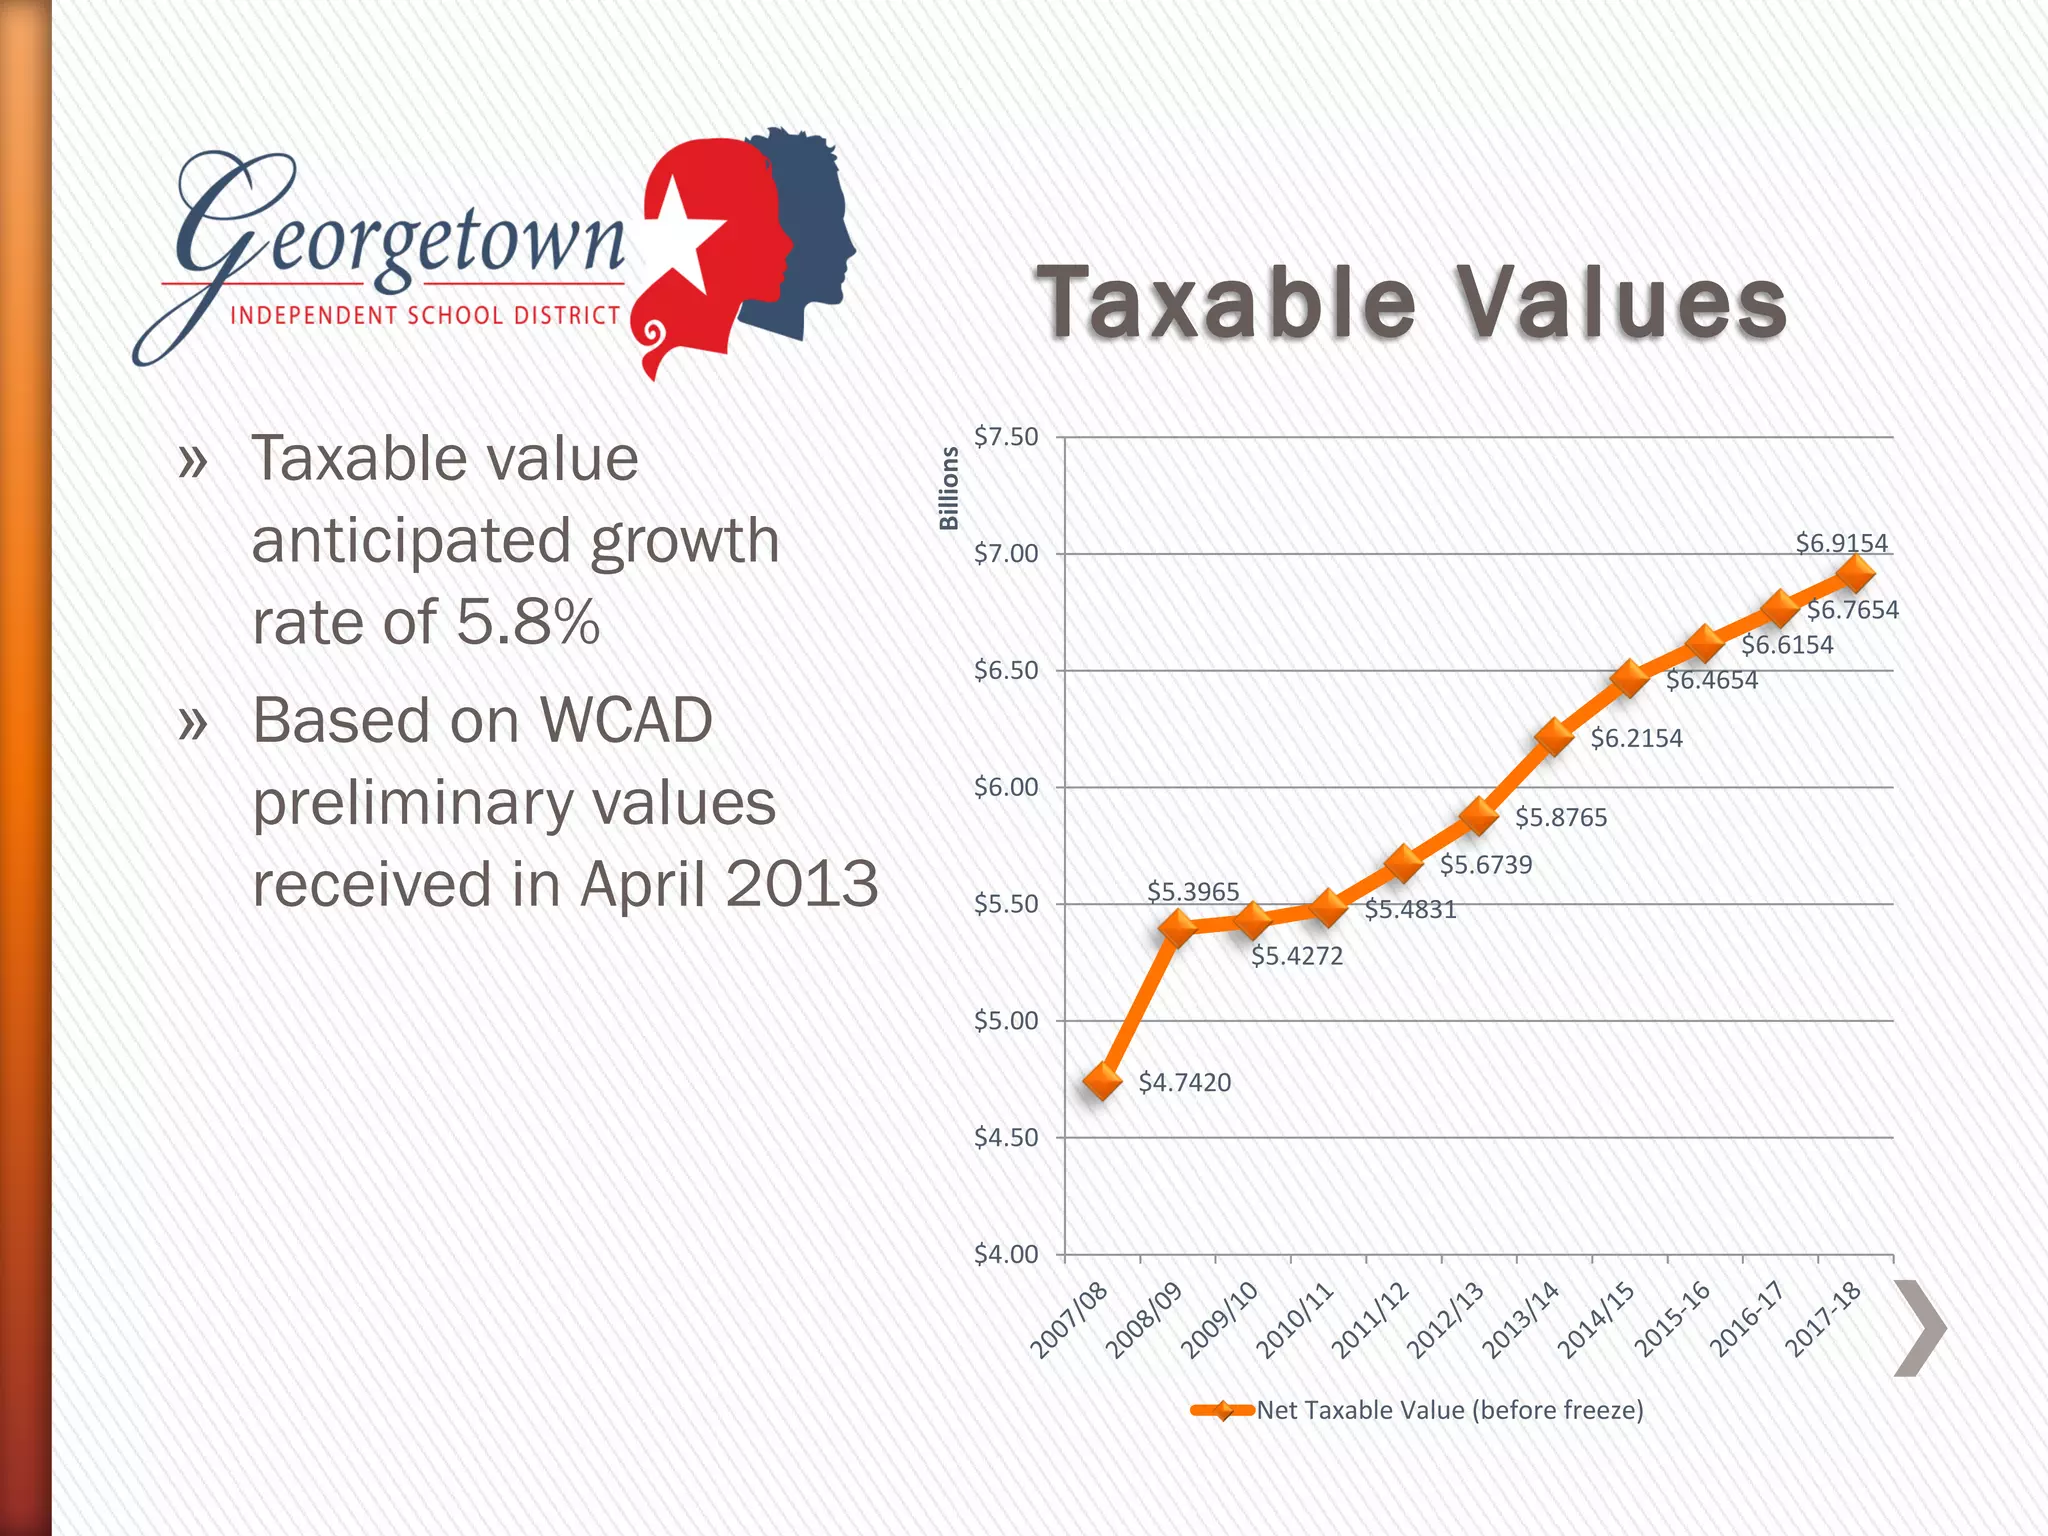
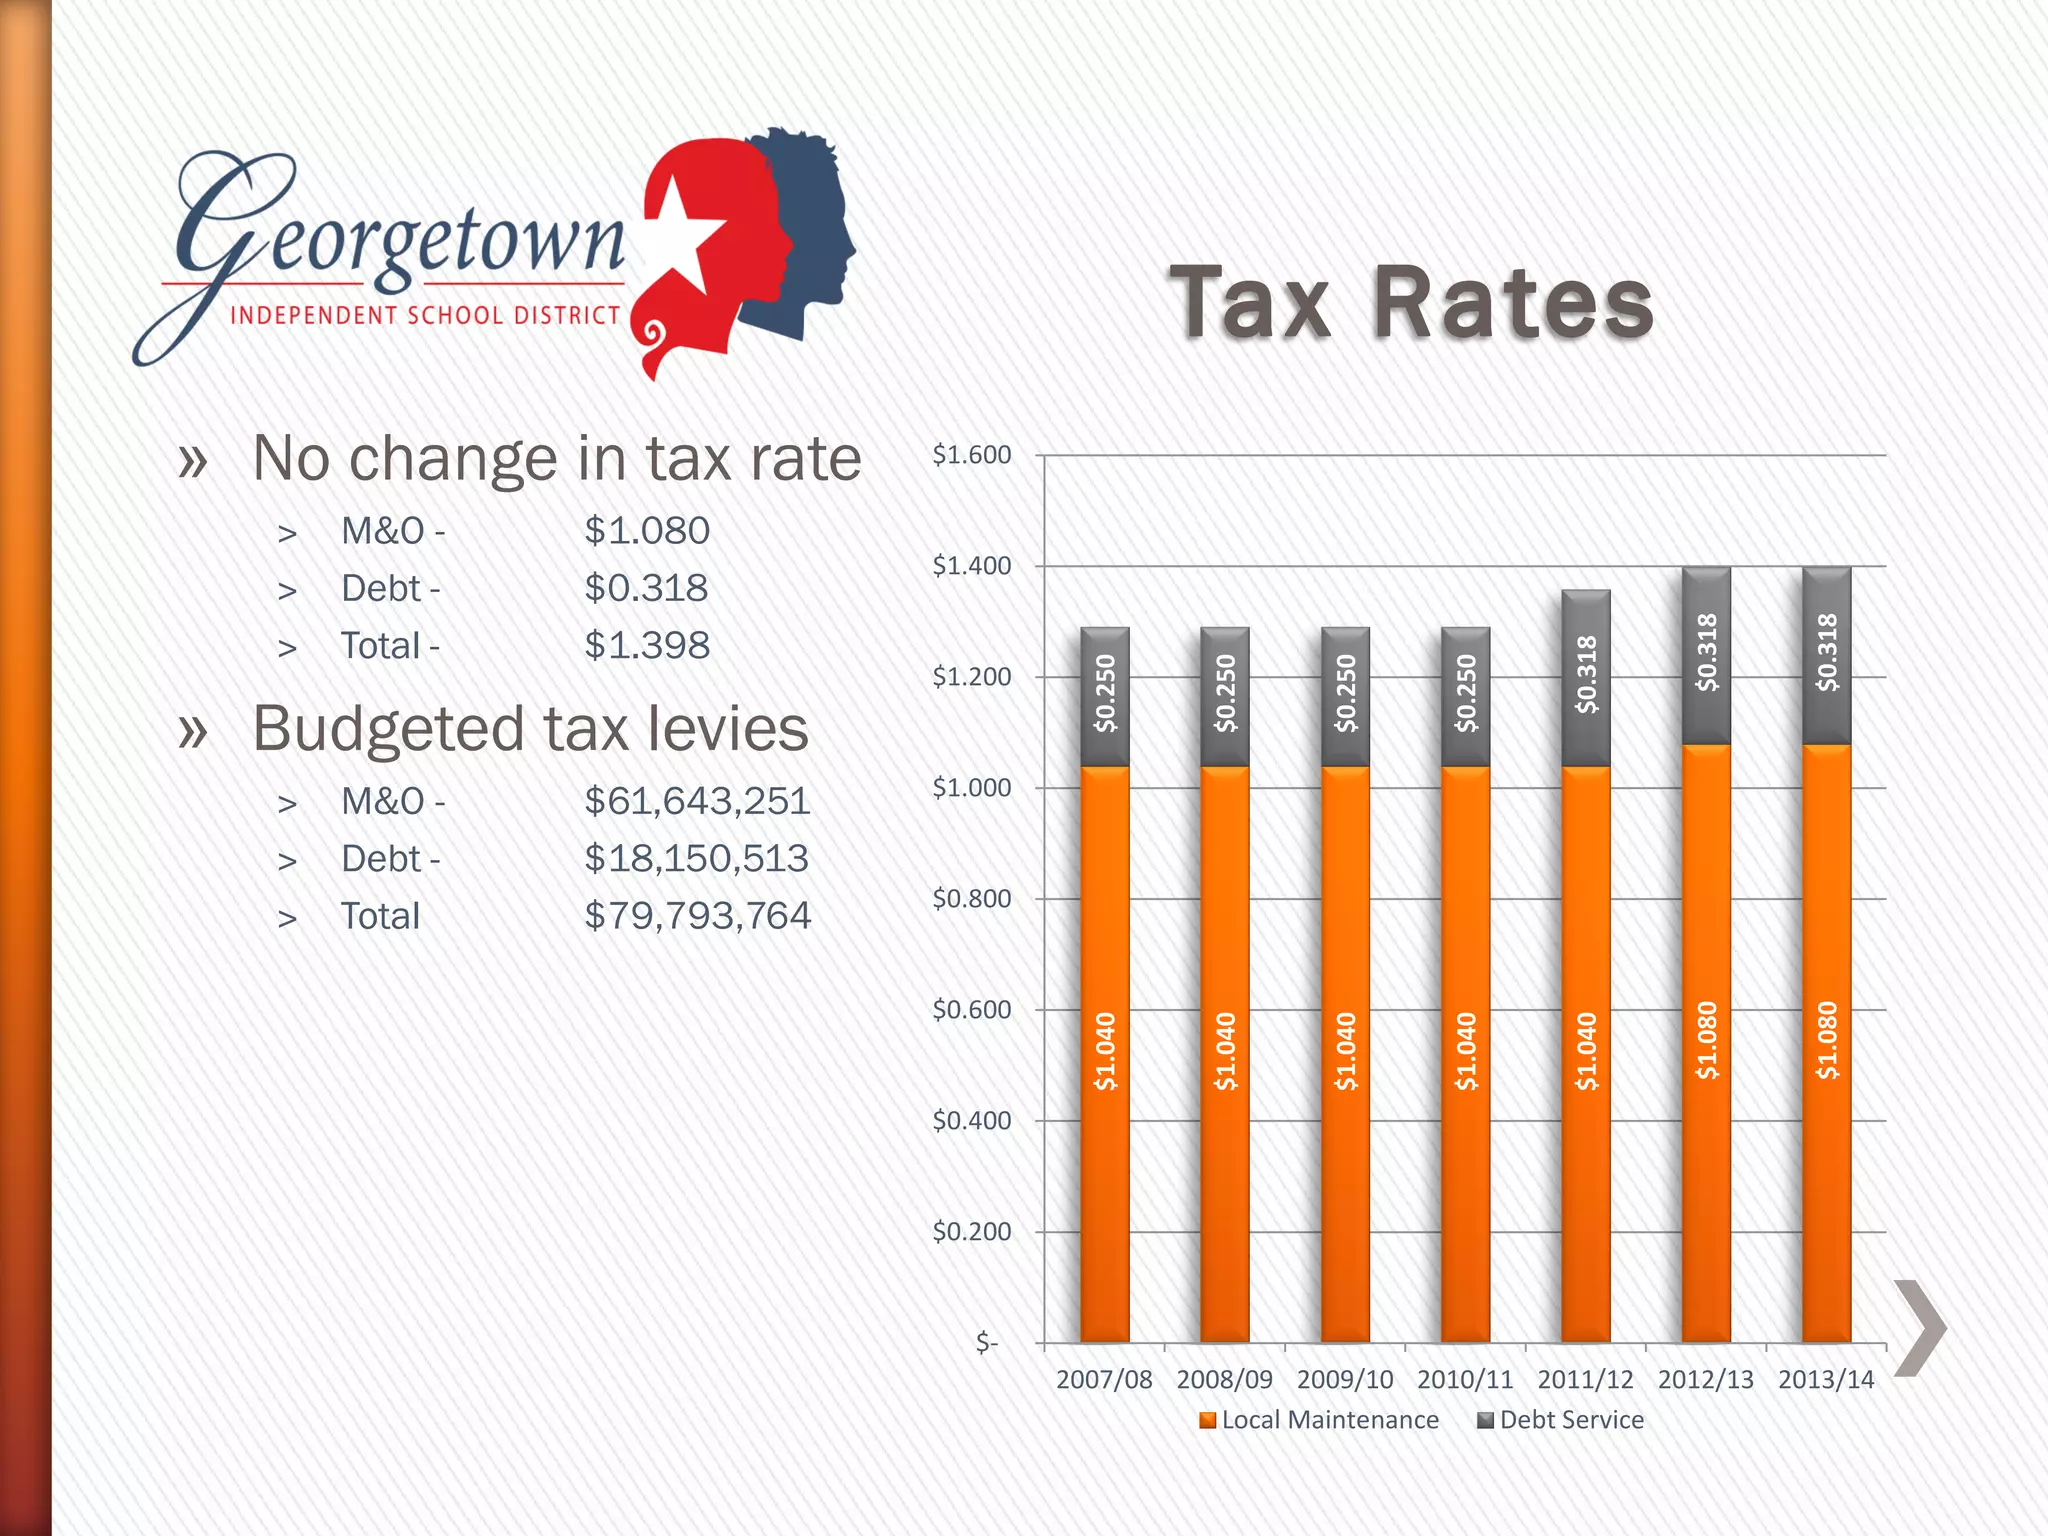
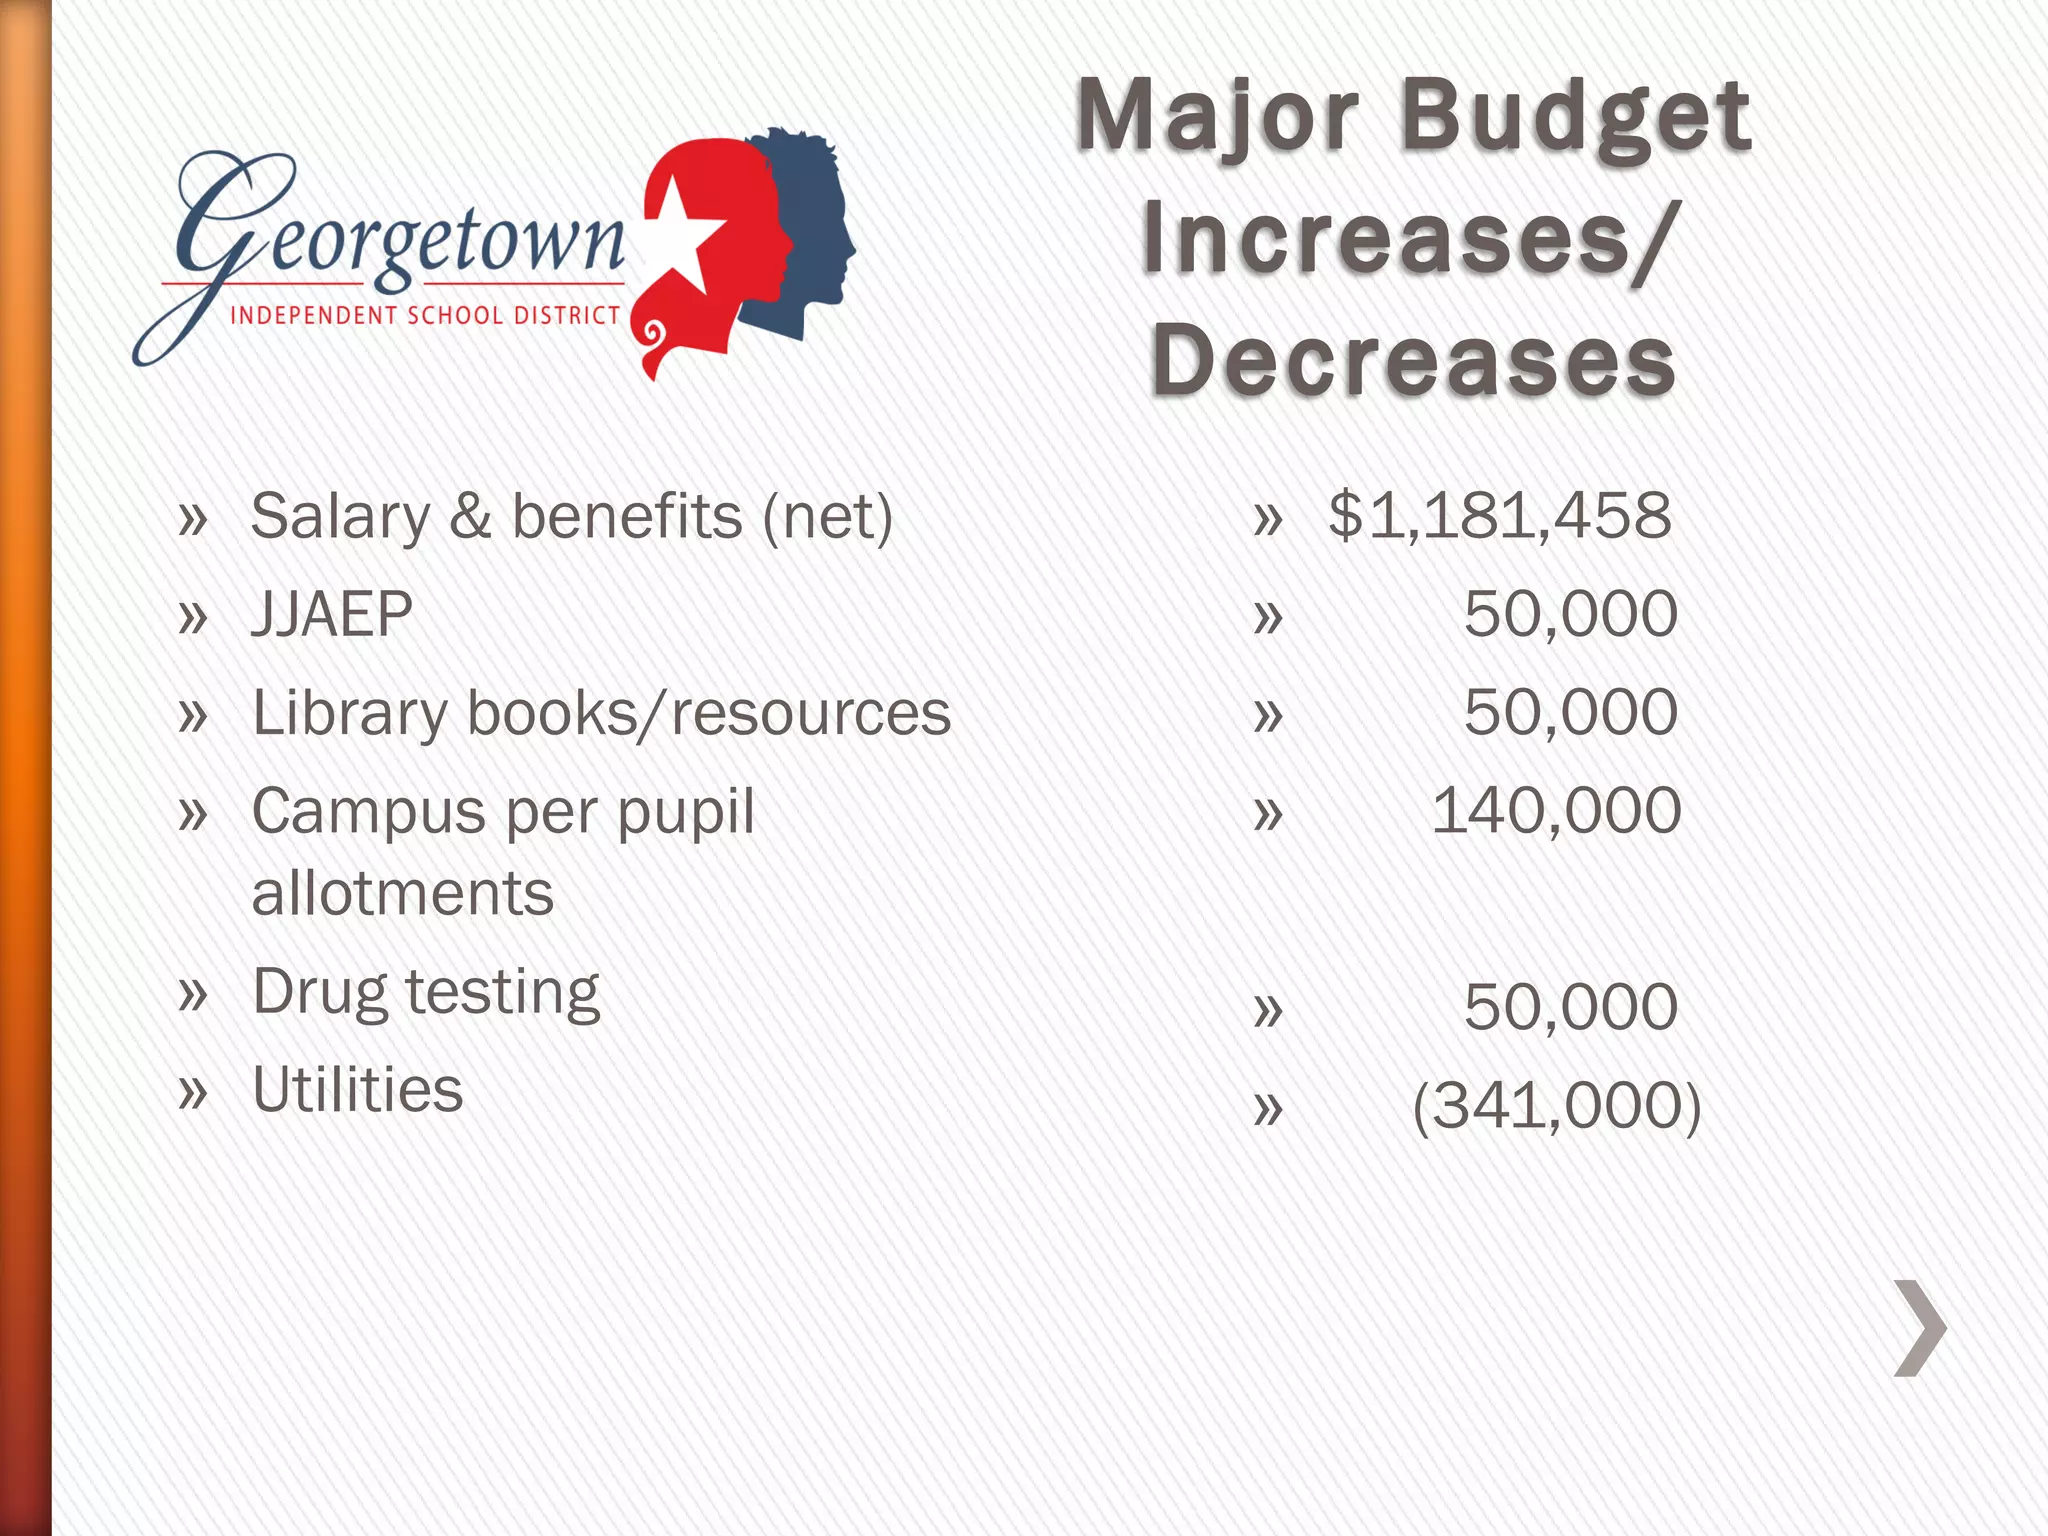
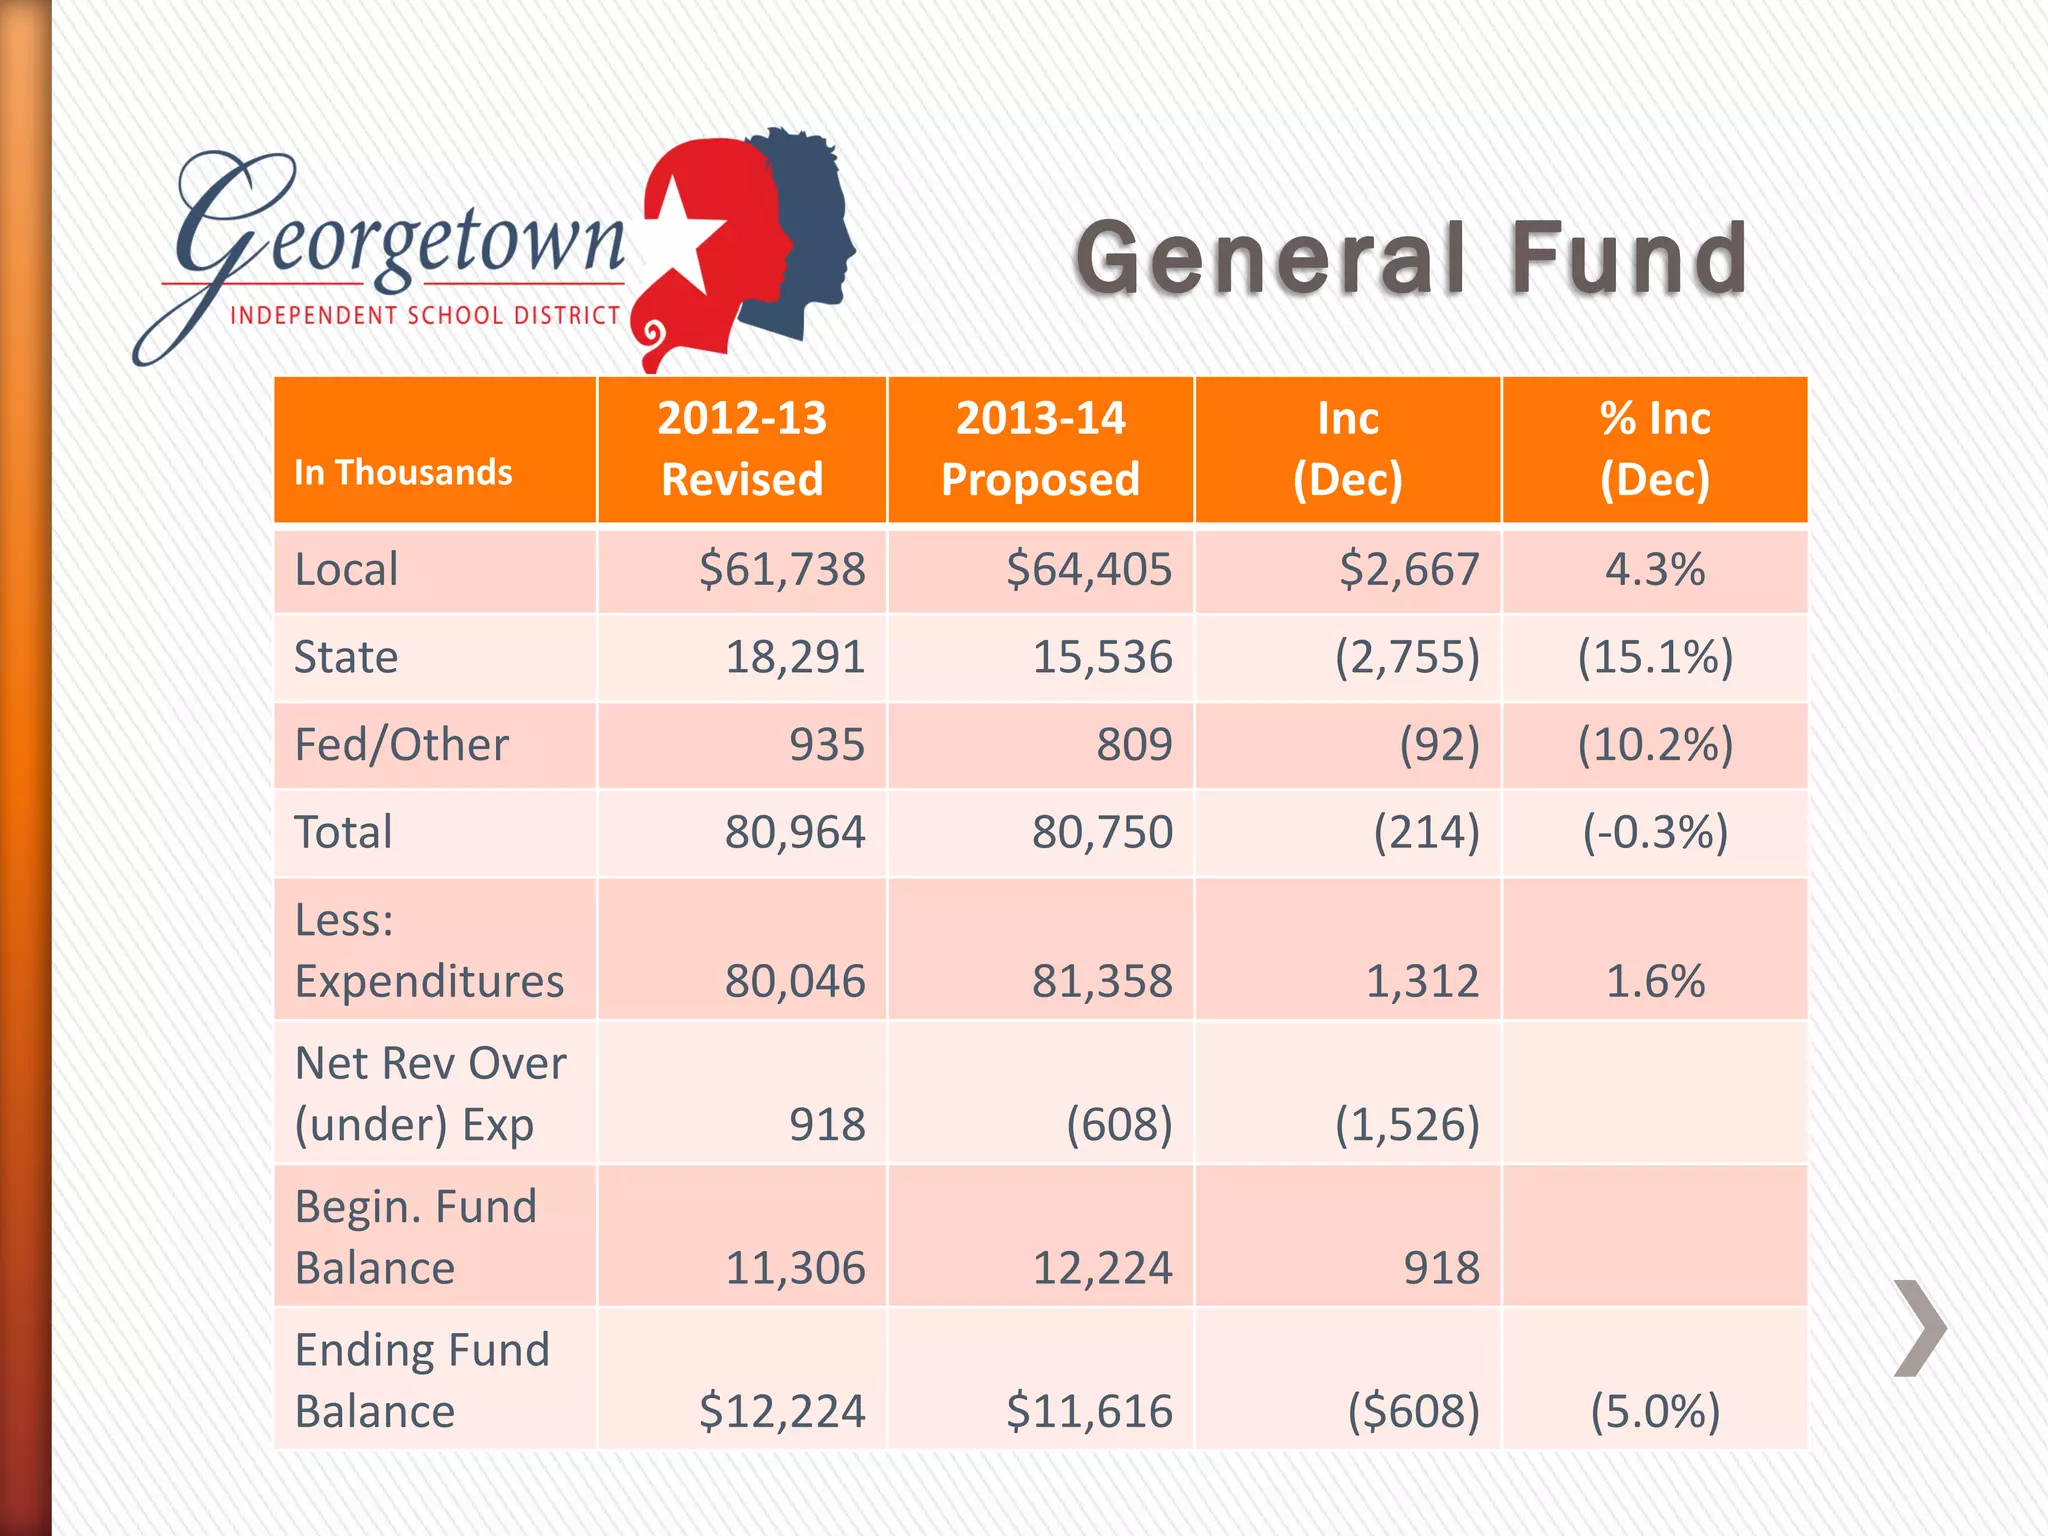
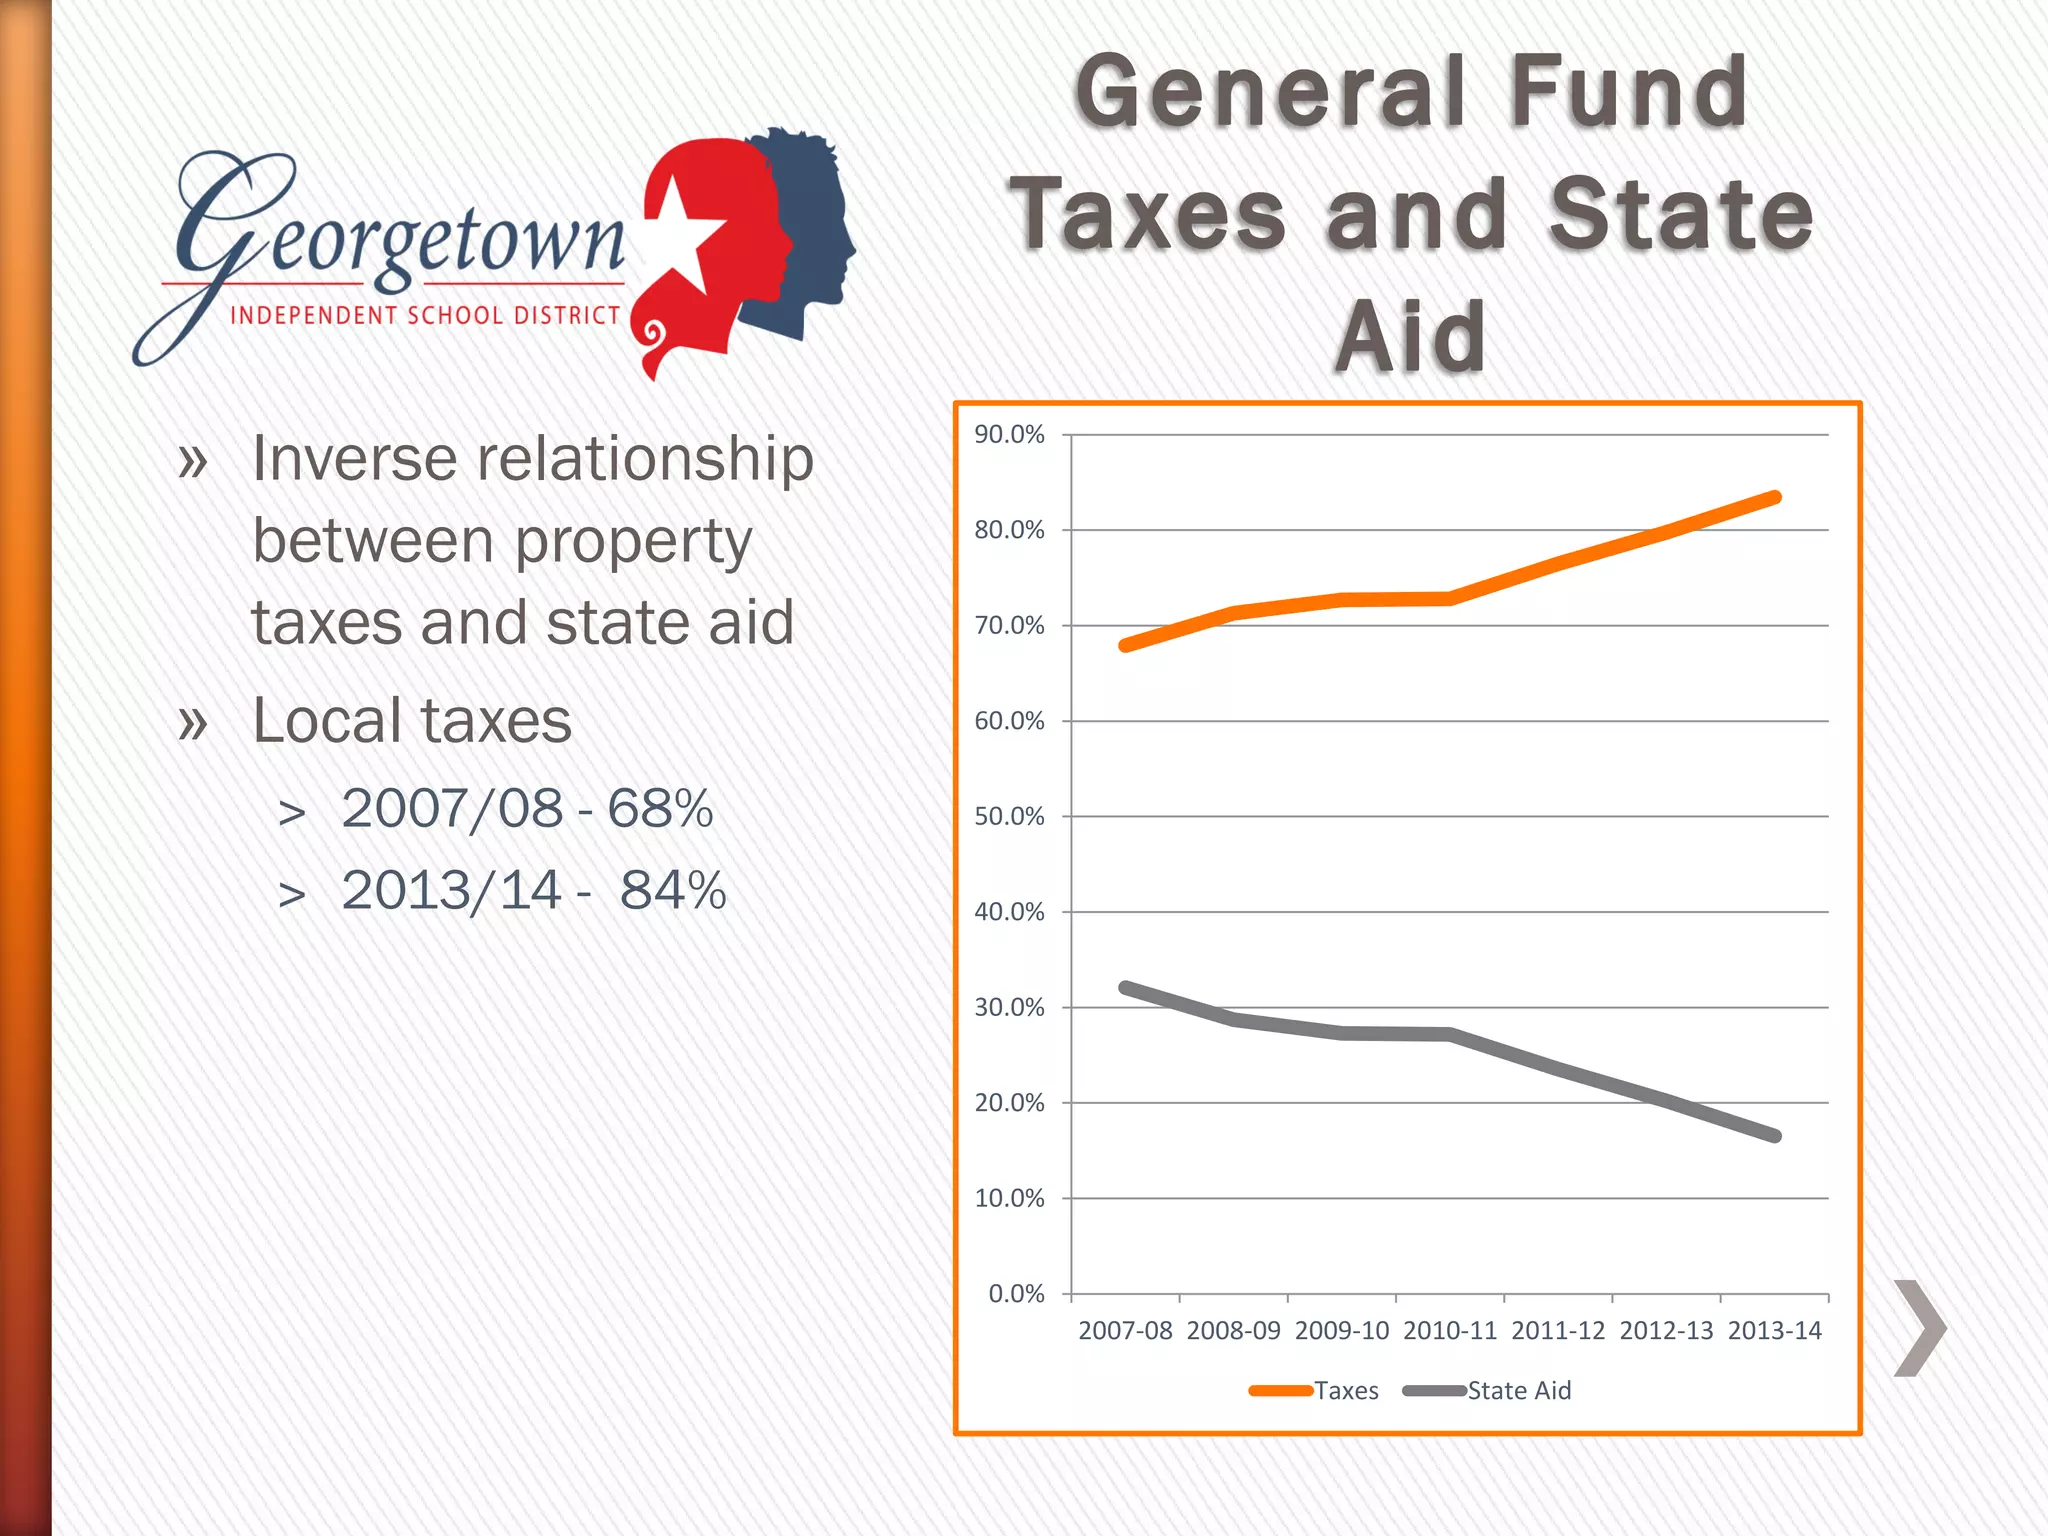
May 20, 2013
» Revenue
˃ House state aid funding version
˃ Taxable value growth rate of 5.8%
» Budget process work-in-progress until
legislation finalized
» Current projection of General Fund
deficit -- $608,000
» Projected enrollment
rate slower than
demographic study
» ADA (average daily
attendance) drives
state aid funding
» 2012-13 ADA est. –
9,730
» 2013-2014 ADA est. –
9,759
9,000
9,500
10,000
10,500
11,000
11,500
12,000
Deskmap (Conservative) Deskmap (Moderate)
Projected Enrollment Projected ADA
» 2012-2013
enrollment exceeds
prior year beginning in
Feb
» Attendance for last
months of current
year better than
expected
» If trend continues,
revenue for 2013-
2014 will be better
than projected
9,400
9,600
9,800
10,000
10,200
10,400
10,600
Aug Sep Oct Nov Dec Jan Feb Mar Apr May
2011/12 Enroll 2011/12 ADA
2012/13 Enroll 2012/13 ADA
» Taxable value
anticipated growth
rate of 5.8%
» Based on WCAD
preliminary values
received in April 2013
$4.7420
$5.3965
$5.4272
$5.4831
$5.6739
$5.8765
$6.2154
$6.4654
$6.6154
$6.7654
$6.9154
$4.00
$4.50
$5.00
$5.50
$6.00
$6.50
$7.00
$7.50
Billions
Net Taxable Value (before freeze)
» No change in tax rate
˃ M&O - $1.080
˃ Debt - $0.318
˃ Total - $1.398
» Budgeted tax levies
˃ M&O - $61,643,251
˃ Debt - $18,150,513
˃ Total $79,793,764
$1.040
$1.040
$1.040
$1.040
$1.040
$1.080
$1.080
$0.250
$0.250
$0.250
$0.250
$0.318
$0.318
$0.318
$-
$0.200
$0.400
$0.600
$0.800
$1.000
$1.200
$1.400
$1.600
2007/08 2008/09 2009/10 2010/11 2011/12 2012/13 2013/14
Local Maintenance Debt Service
» Salary & benefits (net)
» JJAEP
» Library books/resources
» Campus per pupil
allotments
» Drug testing
» Utilities
» $1,181,458
» 50,000
» 50,000
» 140,000
» 50,000
» (341,000)
In Thousands
2012-13
Revised
2013-14
Proposed
Inc
(Dec)
% Inc
(Dec)
Local $61,738 $64,405 $2,667 4.3%
State 18,291 15,536 (2,755) (15.1%)
Fed/Other 935 809 (92) (10.2%)
Total 80,964 80,750 (214) (-0.3%)
Less:
Expenditures 80,046 81,358 1,312 1.6%
Net Rev Over
(under) Exp 918 (608) (1,526)
Begin. Fund
Balance 11,306 12,224 918
Ending Fund
Balance $12,224 $11,616 ($608) (5.0%)
» 85% spent on salaries
and benefits
» Utilities, JJAEP,
appraisal cost and
recapture make up
2/3 of contracted
services
6100 Payroll
Costs, 84.8%
6200
Contracted
Serv, 9.1%
6300
Supplies/Materi
als, 3.8%
6400 Other
Operating, 1.9%
6500 Debt
Service, 0.0%
6600 Capital
Outlay, 0.4%
» Instructional services
includes teachers, aides
and librarians
» Instructional leadership –
campus and central office
staff costs
» Operations – custodians,
security, utilities,
maintenance, and
technology
» Student services –
counseling, health
services, transportation,
and extra-curricular
Instr Related
Serv
58.3%
Instr
Leadership
8.9%
Student Serv
12.1%
General Adm
3.0%
Operations
14.6%
Community
Serv
1.6%
Other
1.6%
» Inverse relationship
between property
taxes and state aid
» Local taxes
˃ 2007/08 - 68%
˃ 2013/14 - 84%
0.0%
10.0%
20.0%
30.0%
40.0%
50.0%
60.0%
70.0%
80.0%
90.0%
2007-08 2008-09 2009-10 2010-11 2011-12 2012-13 2013-14
Taxes State Aid
» Property taxes and
state aid combined
have trended
downward on per
student basis
» Slight revenue uptick
in 2012-13 with TRE
» Property wealthy
districts will feel the
revenue squeeze
more than lower
wealth districts
$5,000
$5,500
$6,000
$6,500
$7,000
$7,500
2007-08 2008-09 2009-10 2010-11 2011-12 2012-13 2013-14
State Aid and Local Taxes per Student
In Thousands
2012-13
Revised
2013-14
Proposed
Inc
(Dec)
% Inc
(Dec)
Local
Rev/Other
Sources $102,303 $18,301 ($84,002) (82%)
Less:
Expend/Other
Uses 101,112 16,255 (84,857) (84%)
Net Rev Over
(under) Exp 1,191 2,046 855 72%
Begin. Fund
Balance 7,526 8,718 1,191
Ending Fund
Balance 8,718 10,764 2,046 23%
» Board approved debt management plan
˃ Blend of debt types based on market
˃ Early debt retirement to save interest
˃ Total length of bonds under 23 years
» Debt Portfolio
˃ Principal 66%
˃ Interest 34%
» Ample capacity for
future bond sales
without tax increase
» Sufficient funds
available to make
August payment of
over $5.0 million
» With property value
growth, anticipate
early retirement of
portion of principal
Principal
Interest
-
2,000,000
4,000,000
6,000,000
8,000,000
10,000,000
12,000,000
14,000,000
16,000,000
18,000,000
2014 2015 2016 2017 2018 2019 2020 2021 2022 2023 2024 2025 2026 2027 2028 2029 2030 2031 2032 2033 2034 2035
As of June 30
» 93% of principal and
interest repaid in 20
years
» Two to one margin for
principal and interest
28%
53%
75%
93%
0% 20% 40% 60% 80% 100%
Five Years
Ten Years
Fifteen Years
Twenty Years

2013-2014 Budget Update Presentation

  • 1.
  • 2.
    » Revenue ˃ Housestate aid funding version ˃ Taxable value growth rate of 5.8% » Budget process work-in-progress until legislation finalized » Current projection of General Fund deficit -- $608,000
  • 3.
    » Projected enrollment rateslower than demographic study » ADA (average daily attendance) drives state aid funding » 2012-13 ADA est. – 9,730 » 2013-2014 ADA est. – 9,759 9,000 9,500 10,000 10,500 11,000 11,500 12,000 Deskmap (Conservative) Deskmap (Moderate) Projected Enrollment Projected ADA
  • 4.
    » 2012-2013 enrollment exceeds prioryear beginning in Feb » Attendance for last months of current year better than expected » If trend continues, revenue for 2013- 2014 will be better than projected 9,400 9,600 9,800 10,000 10,200 10,400 10,600 Aug Sep Oct Nov Dec Jan Feb Mar Apr May 2011/12 Enroll 2011/12 ADA 2012/13 Enroll 2012/13 ADA
  • 5.
    » Taxable value anticipatedgrowth rate of 5.8% » Based on WCAD preliminary values received in April 2013 $4.7420 $5.3965 $5.4272 $5.4831 $5.6739 $5.8765 $6.2154 $6.4654 $6.6154 $6.7654 $6.9154 $4.00 $4.50 $5.00 $5.50 $6.00 $6.50 $7.00 $7.50 Billions Net Taxable Value (before freeze)
  • 6.
    » No changein tax rate ˃ M&O - $1.080 ˃ Debt - $0.318 ˃ Total - $1.398 » Budgeted tax levies ˃ M&O - $61,643,251 ˃ Debt - $18,150,513 ˃ Total $79,793,764 $1.040 $1.040 $1.040 $1.040 $1.040 $1.080 $1.080 $0.250 $0.250 $0.250 $0.250 $0.318 $0.318 $0.318 $- $0.200 $0.400 $0.600 $0.800 $1.000 $1.200 $1.400 $1.600 2007/08 2008/09 2009/10 2010/11 2011/12 2012/13 2013/14 Local Maintenance Debt Service
  • 7.
    » Salary &benefits (net) » JJAEP » Library books/resources » Campus per pupil allotments » Drug testing » Utilities » $1,181,458 » 50,000 » 50,000 » 140,000 » 50,000 » (341,000)
  • 8.
    In Thousands 2012-13 Revised 2013-14 Proposed Inc (Dec) % Inc (Dec) Local$61,738 $64,405 $2,667 4.3% State 18,291 15,536 (2,755) (15.1%) Fed/Other 935 809 (92) (10.2%) Total 80,964 80,750 (214) (-0.3%) Less: Expenditures 80,046 81,358 1,312 1.6% Net Rev Over (under) Exp 918 (608) (1,526) Begin. Fund Balance 11,306 12,224 918 Ending Fund Balance $12,224 $11,616 ($608) (5.0%)
  • 9.
    » 85% spenton salaries and benefits » Utilities, JJAEP, appraisal cost and recapture make up 2/3 of contracted services 6100 Payroll Costs, 84.8% 6200 Contracted Serv, 9.1% 6300 Supplies/Materi als, 3.8% 6400 Other Operating, 1.9% 6500 Debt Service, 0.0% 6600 Capital Outlay, 0.4%
  • 10.
    » Instructional services includesteachers, aides and librarians » Instructional leadership – campus and central office staff costs » Operations – custodians, security, utilities, maintenance, and technology » Student services – counseling, health services, transportation, and extra-curricular Instr Related Serv 58.3% Instr Leadership 8.9% Student Serv 12.1% General Adm 3.0% Operations 14.6% Community Serv 1.6% Other 1.6%
  • 11.
    » Inverse relationship betweenproperty taxes and state aid » Local taxes ˃ 2007/08 - 68% ˃ 2013/14 - 84% 0.0% 10.0% 20.0% 30.0% 40.0% 50.0% 60.0% 70.0% 80.0% 90.0% 2007-08 2008-09 2009-10 2010-11 2011-12 2012-13 2013-14 Taxes State Aid
  • 12.
    » Property taxesand state aid combined have trended downward on per student basis » Slight revenue uptick in 2012-13 with TRE » Property wealthy districts will feel the revenue squeeze more than lower wealth districts $5,000 $5,500 $6,000 $6,500 $7,000 $7,500 2007-08 2008-09 2009-10 2010-11 2011-12 2012-13 2013-14 State Aid and Local Taxes per Student
  • 13.
    In Thousands 2012-13 Revised 2013-14 Proposed Inc (Dec) % Inc (Dec) Local Rev/Other Sources$102,303 $18,301 ($84,002) (82%) Less: Expend/Other Uses 101,112 16,255 (84,857) (84%) Net Rev Over (under) Exp 1,191 2,046 855 72% Begin. Fund Balance 7,526 8,718 1,191 Ending Fund Balance 8,718 10,764 2,046 23%
  • 14.
    » Board approveddebt management plan ˃ Blend of debt types based on market ˃ Early debt retirement to save interest ˃ Total length of bonds under 23 years » Debt Portfolio ˃ Principal 66% ˃ Interest 34%
  • 15.
    » Ample capacityfor future bond sales without tax increase » Sufficient funds available to make August payment of over $5.0 million » With property value growth, anticipate early retirement of portion of principal Principal Interest - 2,000,000 4,000,000 6,000,000 8,000,000 10,000,000 12,000,000 14,000,000 16,000,000 18,000,000 2014 2015 2016 2017 2018 2019 2020 2021 2022 2023 2024 2025 2026 2027 2028 2029 2030 2031 2032 2033 2034 2035 As of June 30
  • 16.
    » 93% ofprincipal and interest repaid in 20 years » Two to one margin for principal and interest 28% 53% 75% 93% 0% 20% 40% 60% 80% 100% Five Years Ten Years Fifteen Years Twenty Years