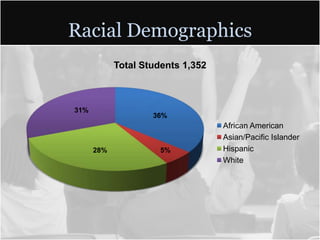
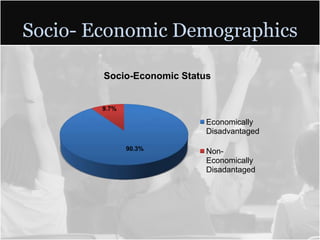
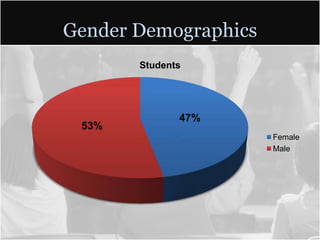
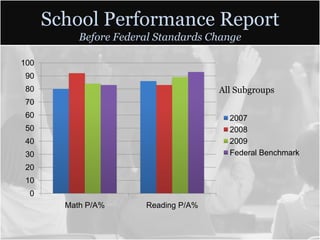
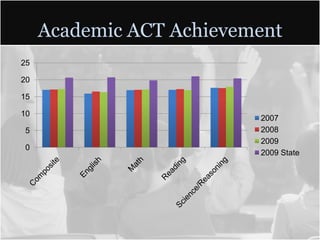
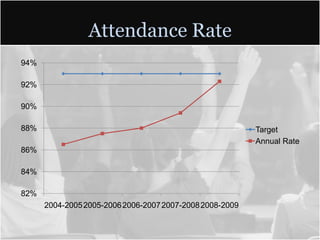
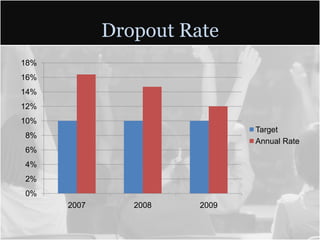
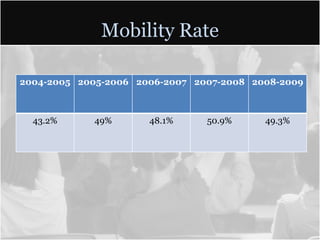
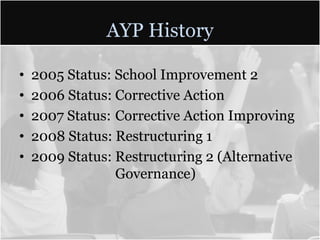
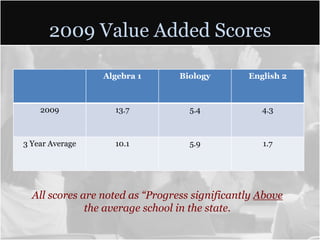
Glencliff High School
   Data Analysis
        2010
    By: Sonia Stewart
Glencliff High School
        “Our Diversity is Our Strength”


   Glencliff High
School is the most
diverse high school
   in the state of
Tennessee with 44
 countries and 40
     languages
represented in our
   student body.
Freshman Academy
90%
80%
70%
60%                                                           05-'06
50%                                                           06-'07
40%                                                           07-'08
30%                                                           08-'09
20%                                                           09-'10
10%
 0%
                   Ninth Grade Promotion Rate


 19.6% gains in the promotion rate since the implementation of the
                       Freshman Academy
SLC Reform Model
• Cliff Academy – Freshman Academy
• The Academy of Business with Ford
  Partnership for Advanced Studies
• The Academy of Medical Science &
  Research
• The Academy of Environmental & Urban
  Planning
• The Academy of Hospitality & Marketing
Racial Demographics
            Total Students 1,352


31%
                    36%
                                   African American
                                   Asian/Pacific Islander
      28%             5%           Hispanic
                                   White
Socio- Economic Demographics

        Socio-Economic Status


        9.7%

                            Economically
                            Disadvantaged

               90.3%
                            Non-
                            Economically
                            Disadantaged
Gender Demographics
       Students


              47%
 53%
                      Female
                      Male
School Performance Report
           Before Federal Standards Change

100
 90
 80                                   All Subgroups
 70
 60                                     2007
 50                                     2008
 40                                     2009
 30                                     Federal Benchmark
 20
 10
  0
        Math P/A%      Reading P/A%
School Performance Report
           Before Federal Standards Change

120

100
                                     All Subgroups
 80                                   All
                                      African American
 60                                   Asian/Pacific Islander
                                      Hispanic
 40                                   White
                                      ED
 20
                                      SWD
                                      LEP
  0
        Math P/A%     Reading P/A%
Tennessee NCLB Benchmarks
                              Reset 2009-2010

                            Read/LA Target Math Target   Grad Rate Target

’02-’03 through ‘03-’04          86%            65%            90%

‘04-’05-’ through ‘06-’07        90%            75%            90%

‘07-’08 through ‘08-’09          93%            83%            90%

         ‘09-’10                 49%            25%            90%

         ‘10-’11                 61%            44%            90%

         ‘11-’12                 74%            63%            90%

         ‘12-’13                 87%            81%            90%

         ‘13-’14                100%            100%           90%
School Performance Report
       After Federal Standards Change

                         49%
50%
                               45.9%
45%
40%
35%
30%    25%
25%           20.6%
                                       Federal Benchmark
 20%
 15%                                   GHS
 10%
  5%
  0%

       Math
                      Reading/LA
2009-2010 vs. 2010-2011
          Current Scores vs. Next Years Benchmark


70.00%                            61%
60.00%
                    44%   45.9%
50.00%

40.00%                                   2009-2010 GHS2
30.00%     20.6%                         2010-2011 Benchmark

20.00%

10.00%

0.00%
             Math          Read/LA
Academic ACT Achievement
25

20

15

10
                          2007
5                         2008
                          2009
0
                          2009 State
Attendance Rate
94%

92%

90%

88%                                                       Target
                                                          Annual Rate
86%

84%

82%
      2004-2005 2005-2006 2006-2007 2007-2008 2008-2009
Dropout Rate
18%
16%
14%
12%
10%
                              Target
8%
                              Annual Rate
6%
4%
2%
0%
      2007      2008   2009
Mobility Rate

2004-2005 2005-2006 2006-2007 2007-2008 2008-2009


  43.2%     49%       48.1%     50.9%     49.3%
AYP History

•   2005 Status: School Improvement 2
•   2006 Status: Corrective Action
•   2007 Status: Corrective Action Improving
•   2008 Status: Restructuring 1
•   2009 Status: Restructuring 2 (Alternative
                 Governance)
2009 Value Added Scores

                 Algebra 1       Biology       English 2


    2009           13.7            5.4            4.3


3 Year Average     10.1            5.9            1.7


  All scores are noted as “Progress significantly Above
              the average school in the state.
Faces Behind the Data

Behind every fact
and figure is a
child. Data must
never be the
mask that hides
the humanity of
the children it
intends to serve.
Sources of Information
• Tennessee Department of Education
  Report Card
• Glencliff High School TVAAS Performance
  Data, Demographic Data, and Gateway
  Data Summary
• Glencliff High School Transformational
  School Plan

Sample data presentation

  • 1.
    Glencliff High School Data Analysis 2010 By: Sonia Stewart
  • 2.
    Glencliff High School “Our Diversity is Our Strength” Glencliff High School is the most diverse high school in the state of Tennessee with 44 countries and 40 languages represented in our student body.
  • 3.
    Freshman Academy 90% 80% 70% 60% 05-'06 50% 06-'07 40% 07-'08 30% 08-'09 20% 09-'10 10% 0% Ninth Grade Promotion Rate 19.6% gains in the promotion rate since the implementation of the Freshman Academy
  • 4.
    SLC Reform Model •Cliff Academy – Freshman Academy • The Academy of Business with Ford Partnership for Advanced Studies • The Academy of Medical Science & Research • The Academy of Environmental & Urban Planning • The Academy of Hospitality & Marketing
  • 5.
    Racial Demographics Total Students 1,352 31% 36% African American Asian/Pacific Islander 28% 5% Hispanic White
  • 6.
    Socio- Economic Demographics Socio-Economic Status 9.7% Economically Disadvantaged 90.3% Non- Economically Disadantaged
  • 7.
    Gender Demographics Students 47% 53% Female Male
  • 8.
    School Performance Report Before Federal Standards Change 100 90 80 All Subgroups 70 60 2007 50 2008 40 2009 30 Federal Benchmark 20 10 0 Math P/A% Reading P/A%
  • 9.
    School Performance Report Before Federal Standards Change 120 100 All Subgroups 80 All African American 60 Asian/Pacific Islander Hispanic 40 White ED 20 SWD LEP 0 Math P/A% Reading P/A%
  • 10.
    Tennessee NCLB Benchmarks Reset 2009-2010 Read/LA Target Math Target Grad Rate Target ’02-’03 through ‘03-’04 86% 65% 90% ‘04-’05-’ through ‘06-’07 90% 75% 90% ‘07-’08 through ‘08-’09 93% 83% 90% ‘09-’10 49% 25% 90% ‘10-’11 61% 44% 90% ‘11-’12 74% 63% 90% ‘12-’13 87% 81% 90% ‘13-’14 100% 100% 90%
  • 11.
    School Performance Report After Federal Standards Change 49% 50% 45.9% 45% 40% 35% 30% 25% 25% 20.6% Federal Benchmark 20% 15% GHS 10% 5% 0% Math Reading/LA
  • 12.
    2009-2010 vs. 2010-2011 Current Scores vs. Next Years Benchmark 70.00% 61% 60.00% 44% 45.9% 50.00% 40.00% 2009-2010 GHS2 30.00% 20.6% 2010-2011 Benchmark 20.00% 10.00% 0.00% Math Read/LA
  • 13.
    Academic ACT Achievement 25 20 15 10 2007 5 2008 2009 0 2009 State
  • 14.
    Attendance Rate 94% 92% 90% 88% Target Annual Rate 86% 84% 82% 2004-2005 2005-2006 2006-2007 2007-2008 2008-2009
  • 15.
    Dropout Rate 18% 16% 14% 12% 10% Target 8% Annual Rate 6% 4% 2% 0% 2007 2008 2009
  • 16.
    Mobility Rate 2004-2005 2005-20062006-2007 2007-2008 2008-2009 43.2% 49% 48.1% 50.9% 49.3%
  • 17.
    AYP History • 2005 Status: School Improvement 2 • 2006 Status: Corrective Action • 2007 Status: Corrective Action Improving • 2008 Status: Restructuring 1 • 2009 Status: Restructuring 2 (Alternative Governance)
  • 18.
    2009 Value AddedScores Algebra 1 Biology English 2 2009 13.7 5.4 4.3 3 Year Average 10.1 5.9 1.7 All scores are noted as “Progress significantly Above the average school in the state.
  • 19.
    Faces Behind theData Behind every fact and figure is a child. Data must never be the mask that hides the humanity of the children it intends to serve.
  • 20.
    Sources of Information •Tennessee Department of Education Report Card • Glencliff High School TVAAS Performance Data, Demographic Data, and Gateway Data Summary • Glencliff High School Transformational School Plan

Editor's Notes

  • #4 Glencliff implemented a freshman academy during the ‘05-’06 school year as a school reform effort to address the low achievement and high drop out rates that characterized the schoolResearch indicates that 94% of first time ninth grade students who promote to the tenth grade after their freshman year in high school graduate, therefore there has been a great focus placed on ninth grade promotion rates.The ninth grade promotion rate has increased 19.6% to 80.6% over the past four years since the implementation of the freshman academy The NCLB graduation benchmark is 90% so it Is critical that the ninth grade promotion rate exceed 90%
  • #5  The Academy model is based on research about school size as well as career oriented experiences being offered to high school studentsAcademies as small learning communities (SLC) assist students explore career interests and acquire skills necessary for post secondary education, career, and lifeGlencliff is in the second year of SLC implementation in compliance with the district mandate for all MNPS high schools to be broken into small school academiesThe Academies have 104 business partners which provide support and real world opportunities for the studentsThe Academies allow for a stronger framework of support from community businesses and organizations, as well as more clearly defined pathways of engagement for those who want to help improve local schools Hindrances to the academy model include: Requires a large, strong leadership team: Academies are run by Assistant Principals who act as Principal for the academy. It is critical to the success of these academies that these leaders are prepared to lead at this scaleSome staff is resistant to change and see SLC’s as just another wave in the educational reform trends that sweep through schools; buy-in may be difficult and slowIn order for a school to effectively implement small school academies it must limit it’s scope which means that it cannot provide instruction in all areas of student interest forcing students to potentially be in an academic pathway that does not interest them
  • #6 Glencliff is the most diverse high school in the state of TennesseeThe diversity of the school acts as both a powerfully positive characteristic as well as a challengeDifferentiated instruction is critical to student success within this environmentChallenges:Unity within a student body that is so diverseTranslation services for so many students (40 languages represented)Family engagement with such vast cultural norms and differencesStrong ELL program to accurately assess and place English language learners
  • #7 Glencliff is a high poverty school with limited resourcesGlencliff is a title one school and receives title one funds for supports and interventionsChallenges in high poverty populations:Increased violence and crime within the communityLimited employment opportunities for families70+% single parent householdsParents with limited educationImmigration statusGang affiliationUnstable housing optionsHigh mobility ratesHigh rates of teen pregnancy
  • #9 During 2007-2009 Glencliff never reached the federal benchmarks in readingLiteracy based interventions are needed for students to succeedGlencliff exceeded the benchmark in math in 2008, but then saw significant decline in ‘09These scores show proficiency achievement levels at 80% and above indicating that students are achieving in fairly high numbers
  • #10  This data chart merits the recognition that GHS is made up of a highly divers student bodyThe API subgroup scores well but makes up only 5% of the populationStudents with Disabilities are the lowest achieving subgroup - Effective assessment measures should be in place clearly identifying student needs - IEP’s need to be current and well monitored - Academic specialists should be able to clearly identify student deficiencies and establish effective measures to focus support English language learners are scoring significantly lower than students with English as their first language - Strong curriculum based on current research is necessary to serve these students - Pace and rigor is essential to increasing student achievement and integrating these students into the general education curriculum
  • #11  This chart reflects the dramatic change in standards that occurred in the state of Tennessee as a result of low student achievement on national standardized testsPrior to the change in assessment standards TN student achievement results greatly misrepresented student knowledge and misguided the public by inaccurately communicating such high proficiency scoresThe 2014 NCLB proficiency standard of 100% still stands making the annual required gains significant; from 12%-13% in RLA and 18%-19% in Math
  • #12  Both Math and RLA scores are below the benchmark therefore failing to meet the NCLB standard Due to the fact that these are newly determined standards and are significantly lower than before (although measured against a different assessment) the failure to meet these benchmarks should force the school into greater and more intentional avenues of change
  • #13  By 2011 Glencliff H.S. needs to make 23.4% gains in Math and 15.1% gains in RLAGHS needs a focused strategic plan in order to address these deficits The strategic plan should be determined by a leadership team comprised of school administrators, academic specialists, department heads, and teacher representatives - This team should evaluate the currant program and implement changes immediately - Students just above and below the proficiency standard should be targeted first because they are the easiest students to move and can have the greatest impact on improvement of scores. This subgroup should then be followed by lower achieving students also receiving some intervention.Challenges: - Staffing - Funding - Time available within the school day for interventions and pull-out - Student responsibilities out side of school that limits the time they spend on homework Opportunities: - Radical changes are required to make these sorts of gains therefore there is a great opportunity to do something that is a significant divergence from the norm - New research should be conducted about programs and interventions that made the largest gains in the shortest amount of time
  • #14  GHS composite ACT score average for 2007-2009 was 17.033 which is 3.667 below the state MNPS has stated in their 5 year strategic plan the goal that all MNPS graduates score 21 or above in order to meet the Hope Scholarship qualifying standardGHS has addressed this by adding ACT enrichment programs to the 11th grade curriculum as well as introducing a word of the day each day to the entire student body
  • #15  GHS has made substantial gains in attendance over the last 5 years Attendance gains have been attributed to more accurate recording of attendance, a communicated priority to the staff, and gains made in positive school culture
  • #16  The dropout rate exceeds the benchmark of 10%, however GHS continues to make gains in decreasing the dropout rate The implementation of the GAINS Academy (Glencliff Academy in Non-traditional Settings) has helped with dropout prevention by providing alternative options to acquire credit through credit recovery, Twilight School, and virtual courseworkChallenges: - Families lack of value in education - Family economic position which needs students to work to support the family before graduation - Lack of post-secondary college opportunities due to immigration status - Teen pregnancy and teen parenting - Low student engagement - Lack of perceived real world application of educationOpportunities: - Engage the community directly in dropout prevention programs - Work to grow a culture that embraces and values education through parental education programs - Strengthen truancy officer programs and engage volunteers - Build reward and incentive programs throughout the life of the students educational experience in high school
  • #17  High mobility rates make it difficult to build a cohesive and comprehensive educational program Economic stability and stable affordable housing must be a community priority and require systemic changes at the city, state and federal level
  • #18  While GHS has made gains, the gains have not been significant enough to improve the declining AYP status Removal of the Executive Principal is required at this stage of the NCLB AYP requirementsWhile the school has made gains and has implemented new structures and programs it is still not fully sustainable without the currant Ex. Principal which poses a huge challenge for both the school and the district as they maneuver to comply with the RTTT and NCLB standard
  • #19 Glencliff HS is the only comprehensive high school to make progress significantly above the average school in the state. This data indicates that despite significant challenges, GHS continues to make substantial gains
  • #20  Our children must never be lost in the data. Our focus as educators should always be on our students not on numbers; numbers merely inform in order to direct.