Download to read offline
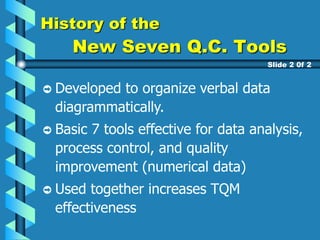
![Benefits of Incorporating
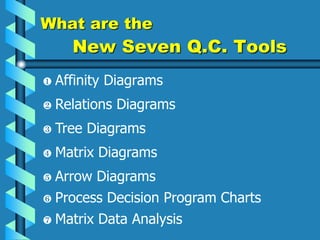
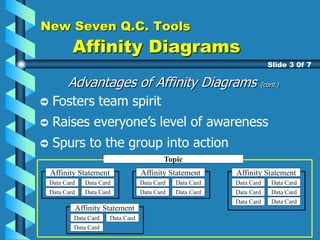
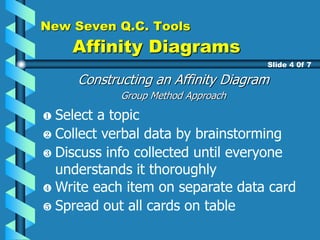
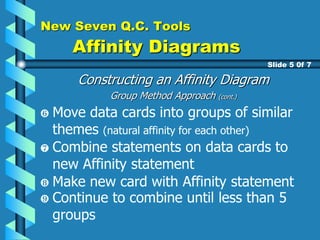
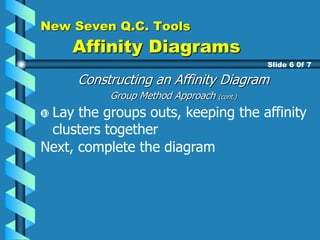
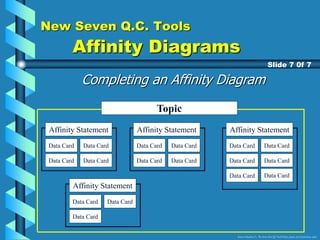
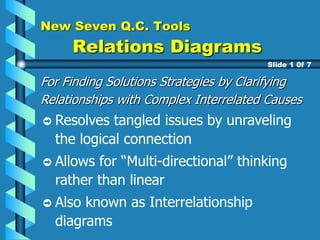
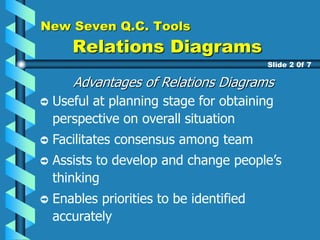
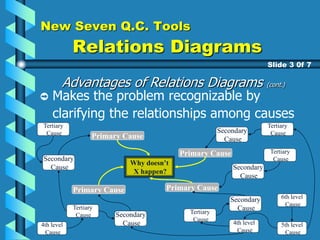
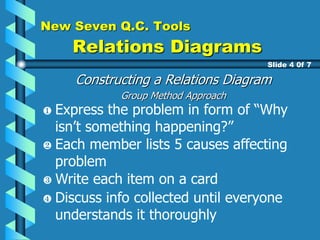
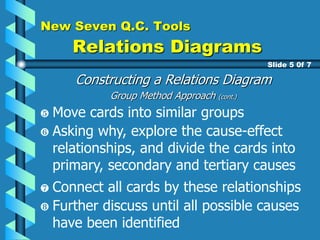
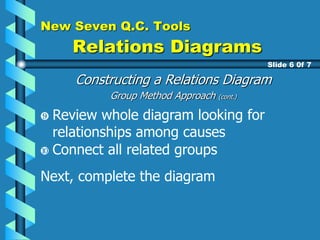
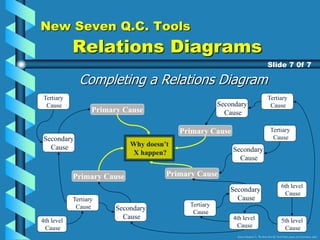
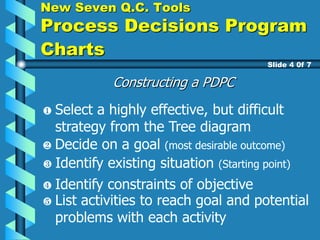
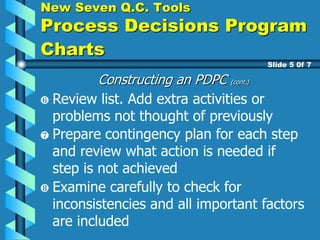
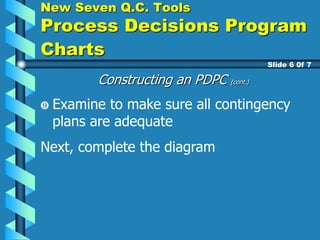
New Seven Q.C. Tools
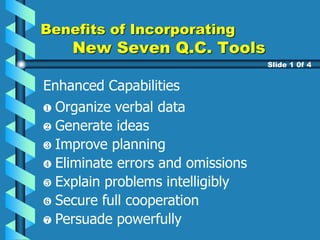
Unstructured Problem [must be put into solvable form]
Problem is mapped
Problem becomes
obvious to all
Problem is in solvable form
Slide 4 0f 4
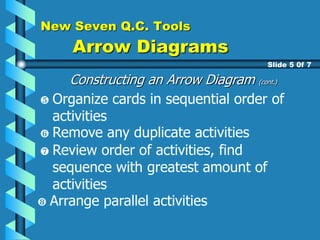
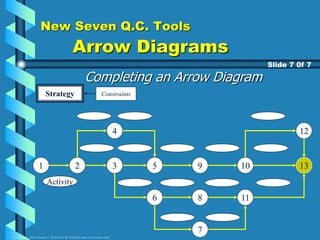
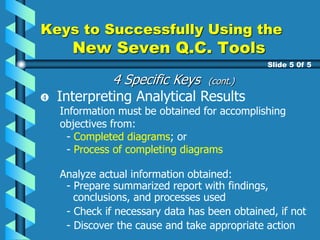
The Seven New Tools
Thoughts are
easily organized
Things go well
People understand
problem
Cooperation is
obtained
Countermeasures
are on target
Problem becomes
obvious to all
Nub of problem
is identified
Problem can be
clearly articulated
Plans are
easily laid
Nothing is
omitted
Source: Nayatani, Y., The Seven New QC Tools (Tokyo, Japan, 3A Corporation, 1984)](https://image.slidesharecdn.com/newsevenqctools-220823100406-57e3a394/85/New-Seven-QCTools-pptx-10-320.jpg)
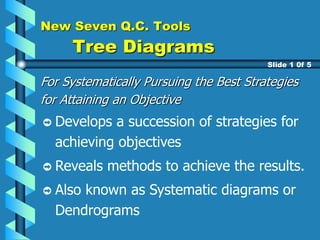
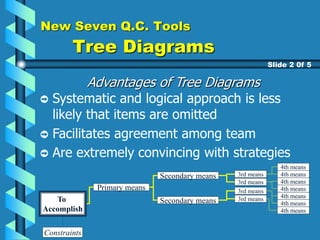
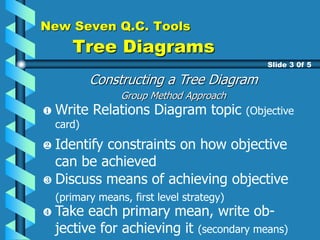
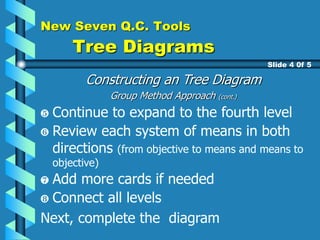
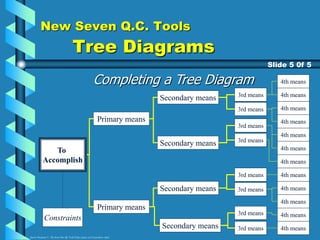
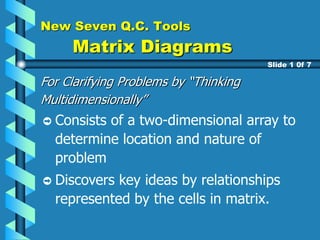
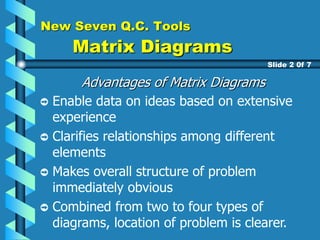
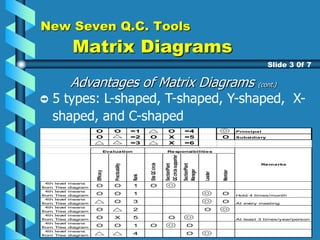
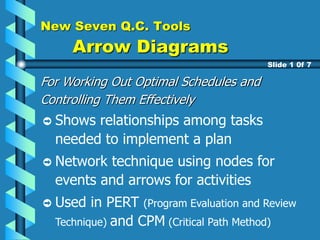

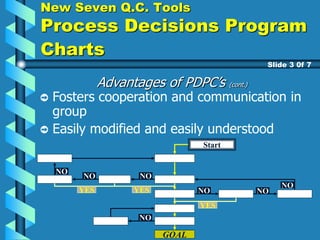
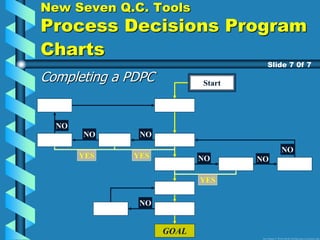
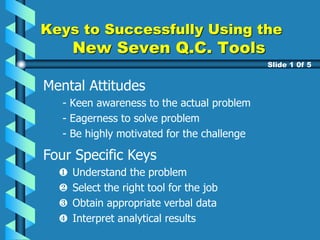

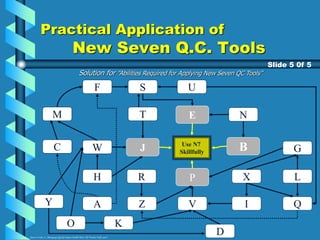

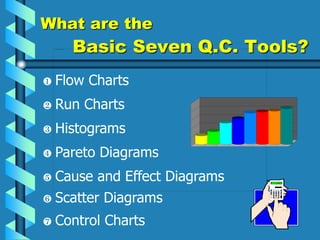
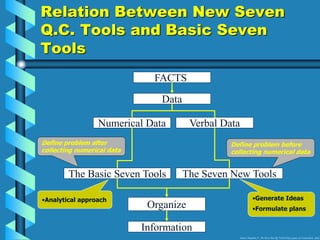
This document provides an overview and instructions for using the New Seven Quality Control tools, which were developed to organize verbal data in a visual way. It begins with an introduction to the New Seven tools and their history. Then each tool is explained in its own section with advantages, construction steps, and an example. The tools covered are Affinity Diagrams, Relations Diagrams, Tree Diagrams, Matrix Diagrams, Arrow Diagrams, and Process Decision Program Charts. The presentation aims to teach people how to effectively use these tools to identify problems, generate solutions, and improve organizational processes.