John Kretzschmar presented on advanced polyphase metering on June 20, 2017. The presentation covered the evolution of meters and loads over time, from the past to present and possibilities for the future. It also discussed changes in communications and how non-linear loads have impacted the basic computations of metering. The bulk of the presentation was focused on providing an overview of three-phase power concepts including phasors, voltage and current relationships, and different connection types for three-phase systems.
In this presentation, you will learn the basics - differences between self contained and transformer or instrument rated meter sites, transformer rated meter forms, test switches and CT's, meter accuracy testing in the field, checking the health of your CT's and PT's, and site verification
Learn the differences between self-contained and transformer or instrument rated meter sites, test switches and CTs, Blondel’s Theorem, meter accuracy testing, site verification, and more! This presentation was given at MEUA Meter School. 03.03.20
Then … Now … and Tomorrow. This presentation discusses how meters, loads, and communications have changed over the years and why it is important today. Standards Changes are reviewed as well as new definitions.
Four quadrant metering can be used to understand individually or collectively:
Real Power consumed by the end user
Apparent Power delivered by the utility
Real Power delivered to the utility by an end user’s generation source
Apparent Power generated by the end user’s generation source
Having these measurements allows for the calculation of Reactive Power, VA and VARS as well as providing kWh for billing purposes.
The best way to be sure you are getting the correct revenue from a site is to test the entire site. Learn how to find any diversions, corrosion, broken or frayed wiring as well as all the tests you can perform while at a site.
Did you know vehicle manufacturers have announced over 100 electric vehicle models are to be introduced by 2024? This presentation was given at the Southeastern Distribution Apparatus School in Auburn, AL and covers Electric Vehicle Service Equipment (EVSE) and the testing of Electric Vehicle stations. This presentation covers types of EVSEs, market growth, regulatory environment and type approval and testing.
The best way to be sure you are getting the correct revenue from a site is to test the entire site. Learn how to find any diversions, corrosion, broken or frayed wiring as well as all the tests you can perform while at a site.
This presentation discusses the differences between self-contained and transformer or instrument rated meter sites; transformer rated meter forms; test switches and CTs; meter accuracy testing in the field; checking the health of your CTs and PTs; and Site Verification. This presentation was given at the MEUA Meter School. 03/03/20
This presentation goes over the varying types of meter forms, self-contained vs. transformer-rated, as well as Blondel's Theorem. This presentation was given at the PREA Meter School.
This presentation reviews the different methods of communicating to your meters, the reasons for them, and some of the testing and challenges related to them.
In this presentation, the topics covered include: differences between self contained and transformer or instrument rated meter sites; transformer rated meter forms; test switches and CT's; Blondel's Theorem and why this matters to us in metering; meter accuracy testing in the field; checking the health of your CT's and PT's; and site verification.
This presentation was given during the 2022 Southeastern Meter School in Auburn, AL. Understand the need and best practices for instrument transformer testing in an AMI world, including why and how to test, and what range of tests and checks to perform in the shop and in the field.
Learning meter forms is as easy as 1S-2S-3S! You’ll learn the most common metering forms and how they are used. This presentation also dives into Blondel’s Theorem and how it is used to determine what type of meter to install at different services.
Discover the differences between transformer-rated and self-contained metering sites and discuss why we test, how we test, the types of meter tests, what to do with the data from these tests, and more. A must-see presentation for any meter tech or supervisor.
Learn the differences between self-contained and transformer or instrument rated meter sites, test switches and CTs, Blondel's Theorem, meter accuracy testing, site verification, and more! 01/29/2019
This presentation will cover the basics and differences between self-contained and transformer or instrument rated meter sites. Also discussed are transformer rated meter forms, test switches and CT's, Blondel's Theorem and why this matters to metering, meter accuracy testing in the field, checking the health of your CT's and PT's, and Site Verification (and not just meter testing).
Starting with a little bit of history, this presentation dives into anything and everything AC, including resistive, inductive, and capacitive load, energy, instantaneous power, complex circuits, phasors, and more.
Starting with a little bit of history, this presentation dives into the theory of AC and DC Meter Testing, including resistive, inductive, and capacitive load, energy, instantaneous power, complex circuits, phasors, and more. 6/26/2019
Starting with a little bit of history, this presentation dives into the theory of AC and DC Meter Testing, including resistive, inductive, and capacitive load, energy, instantaneous power, complex circuits, phasors, and more. 6/25/2019
Take a look at the history of AC and DC power distributions, the differences between the two, and usage today - presented at NC Meter School 2022 Advance Track.
Starting with a little bit of history, this presentation dives into the theory of AC and DC Meter Testing, including resistive, inductive, and capacitive load, energy, instantaneous power, complex circuits, phasors, and more. Presented at NC Meter School 2022.
"Impact of front-end architecture on development cost", Viktor TurskyiFwdays
I have heard many times that architecture is not important for the front-end. Also, many times I have seen how developers implement features on the front-end just following the standard rules for a framework and think that this is enough to successfully launch the project, and then the project fails. How to prevent this and what approach to choose? I have launched dozens of complex projects and during the talk we will analyze which approaches have worked for me and which have not.
Slack (or Teams) Automation for Bonterra Impact Management (fka Social Soluti...Jeffrey Haguewood
Sidekick Solutions uses Bonterra Impact Management (fka Social Solutions Apricot) and automation solutions to integrate data for business workflows.
We believe integration and automation are essential to user experience and the promise of efficient work through technology. Automation is the critical ingredient to realizing that full vision. We develop integration products and services for Bonterra Case Management software to support the deployment of automations for a variety of use cases.
This video focuses on the notifications, alerts, and approval requests using Slack for Bonterra Impact Management. The solutions covered in this webinar can also be deployed for Microsoft Teams.
Interested in deploying notification automations for Bonterra Impact Management? Contact us at sales@sidekicksolutionsllc.com to discuss next steps.
Software Delivery At the Speed of AI: Inflectra Invests In AI-Powered QualityInflectra
In this insightful webinar, Inflectra explores how artificial intelligence (AI) is transforming software development and testing. Discover how AI-powered tools are revolutionizing every stage of the software development lifecycle (SDLC), from design and prototyping to testing, deployment, and monitoring.
Learn about:
• The Future of Testing: How AI is shifting testing towards verification, analysis, and higher-level skills, while reducing repetitive tasks.
• Test Automation: How AI-powered test case generation, optimization, and self-healing tests are making testing more efficient and effective.
• Visual Testing: Explore the emerging capabilities of AI in visual testing and how it's set to revolutionize UI verification.
• Inflectra's AI Solutions: See demonstrations of Inflectra's cutting-edge AI tools like the ChatGPT plugin and Azure Open AI platform, designed to streamline your testing process.
Whether you're a developer, tester, or QA professional, this webinar will give you valuable insights into how AI is shaping the future of software delivery.
Transcript: Selling digital books in 2024: Insights from industry leaders - T...BookNet Canada
The publishing industry has been selling digital audiobooks and ebooks for over a decade and has found its groove. What’s changed? What has stayed the same? Where do we go from here? Join a group of leading sales peers from across the industry for a conversation about the lessons learned since the popularization of digital books, best practices, digital book supply chain management, and more.
Link to video recording: https://bnctechforum.ca/sessions/selling-digital-books-in-2024-insights-from-industry-leaders/
Presented by BookNet Canada on May 28, 2024, with support from the Department of Canadian Heritage.
Smart TV Buyer Insights Survey 2024 by 91mobiles.pdf91mobiles
91mobiles recently conducted a Smart TV Buyer Insights Survey in which we asked over 3,000 respondents about the TV they own, aspects they look at on a new TV, and their TV buying preferences.
Epistemic Interaction - tuning interfaces to provide information for AI supportAlan Dix
Paper presented at SYNERGY workshop at AVI 2024, Genoa, Italy. 3rd June 2024
https://alandix.com/academic/papers/synergy2024-epistemic/
As machine learning integrates deeper into human-computer interactions, the concept of epistemic interaction emerges, aiming to refine these interactions to enhance system adaptability. This approach encourages minor, intentional adjustments in user behaviour to enrich the data available for system learning. This paper introduces epistemic interaction within the context of human-system communication, illustrating how deliberate interaction design can improve system understanding and adaptation. Through concrete examples, we demonstrate the potential of epistemic interaction to significantly advance human-computer interaction by leveraging intuitive human communication strategies to inform system design and functionality, offering a novel pathway for enriching user-system engagements.
GraphRAG is All You need? LLM & Knowledge GraphGuy Korland
Guy Korland, CEO and Co-founder of FalkorDB, will review two articles on the integration of language models with knowledge graphs.
1. Unifying Large Language Models and Knowledge Graphs: A Roadmap.
https://arxiv.org/abs/2306.08302
2. Microsoft Research's GraphRAG paper and a review paper on various uses of knowledge graphs:
https://www.microsoft.com/en-us/research/blog/graphrag-unlocking-llm-discovery-on-narrative-private-data/
JMeter webinar - integration with InfluxDB and GrafanaRTTS
Watch this recorded webinar about real-time monitoring of application performance. See how to integrate Apache JMeter, the open-source leader in performance testing, with InfluxDB, the open-source time-series database, and Grafana, the open-source analytics and visualization application.
In this webinar, we will review the benefits of leveraging InfluxDB and Grafana when executing load tests and demonstrate how these tools are used to visualize performance metrics.
Length: 30 minutes
Session Overview
-------------------------------------------
During this webinar, we will cover the following topics while demonstrating the integrations of JMeter, InfluxDB and Grafana:
- What out-of-the-box solutions are available for real-time monitoring JMeter tests?
- What are the benefits of integrating InfluxDB and Grafana into the load testing stack?
- Which features are provided by Grafana?
- Demonstration of InfluxDB and Grafana using a practice web application
To view the webinar recording, go to:
https://www.rttsweb.com/jmeter-integration-webinar
Let's dive deeper into the world of ODC! Ricardo Alves (OutSystems) will join us to tell all about the new Data Fabric. After that, Sezen de Bruijn (OutSystems) will get into the details on how to best design a sturdy architecture within ODC.
LF Energy Webinar: Electrical Grid Modelling and Simulation Through PowSyBl -...DanBrown980551
Do you want to learn how to model and simulate an electrical network from scratch in under an hour?
Then welcome to this PowSyBl workshop, hosted by Rte, the French Transmission System Operator (TSO)!
During the webinar, you will discover the PowSyBl ecosystem as well as handle and study an electrical network through an interactive Python notebook.
PowSyBl is an open source project hosted by LF Energy, which offers a comprehensive set of features for electrical grid modelling and simulation. Among other advanced features, PowSyBl provides:
- A fully editable and extendable library for grid component modelling;
- Visualization tools to display your network;
- Grid simulation tools, such as power flows, security analyses (with or without remedial actions) and sensitivity analyses;
The framework is mostly written in Java, with a Python binding so that Python developers can access PowSyBl functionalities as well.
What you will learn during the webinar:
- For beginners: discover PowSyBl's functionalities through a quick general presentation and the notebook, without needing any expert coding skills;
- For advanced developers: master the skills to efficiently apply PowSyBl functionalities to your real-world scenarios.
UiPath Test Automation using UiPath Test Suite series, part 4DianaGray10
Welcome to UiPath Test Automation using UiPath Test Suite series part 4. In this session, we will cover Test Manager overview along with SAP heatmap.
The UiPath Test Manager overview with SAP heatmap webinar offers a concise yet comprehensive exploration of the role of a Test Manager within SAP environments, coupled with the utilization of heatmaps for effective testing strategies.
Participants will gain insights into the responsibilities, challenges, and best practices associated with test management in SAP projects. Additionally, the webinar delves into the significance of heatmaps as a visual aid for identifying testing priorities, areas of risk, and resource allocation within SAP landscapes. Through this session, attendees can expect to enhance their understanding of test management principles while learning practical approaches to optimize testing processes in SAP environments using heatmap visualization techniques
What will you get from this session?
1. Insights into SAP testing best practices
2. Heatmap utilization for testing
3. Optimization of testing processes
4. Demo
Topics covered:
Execution from the test manager
Orchestrator execution result
Defect reporting
SAP heatmap example with demo
Speaker:
Deepak Rai, Automation Practice Lead, Boundaryless Group and UiPath MVP
GDG Cloud Southlake #33: Boule & Rebala: Effective AppSec in SDLC using Deplo...James Anderson
Effective Application Security in Software Delivery lifecycle using Deployment Firewall and DBOM
The modern software delivery process (or the CI/CD process) includes many tools, distributed teams, open-source code, and cloud platforms. Constant focus on speed to release software to market, along with the traditional slow and manual security checks has caused gaps in continuous security as an important piece in the software supply chain. Today organizations feel more susceptible to external and internal cyber threats due to the vast attack surface in their applications supply chain and the lack of end-to-end governance and risk management.
The software team must secure its software delivery process to avoid vulnerability and security breaches. This needs to be achieved with existing tool chains and without extensive rework of the delivery processes. This talk will present strategies and techniques for providing visibility into the true risk of the existing vulnerabilities, preventing the introduction of security issues in the software, resolving vulnerabilities in production environments quickly, and capturing the deployment bill of materials (DBOM).
Speakers:
Bob Boule
Robert Boule is a technology enthusiast with PASSION for technology and making things work along with a knack for helping others understand how things work. He comes with around 20 years of solution engineering experience in application security, software continuous delivery, and SaaS platforms. He is known for his dynamic presentations in CI/CD and application security integrated in software delivery lifecycle.
Gopinath Rebala
Gopinath Rebala is the CTO of OpsMx, where he has overall responsibility for the machine learning and data processing architectures for Secure Software Delivery. Gopi also has a strong connection with our customers, leading design and architecture for strategic implementations. Gopi is a frequent speaker and well-known leader in continuous delivery and integrating security into software delivery.
6. Slide 6
WHY DO THESE CHANGES MATTER?
• Changes to our loads have changed the
basic computations of metering
• When loads were linear the power
triangle was all we needed to know
7. Slide 7
WHY DO THESE CHANGES MATTER?
Today’s loads look more like these
-150
-100
-50
0
50
100
150
0.00 60.00 120.00 180.00 240.00 300.00 360.00
Voltage/Current
Current for CCFL Light Bulb
Voltage
Current
8. Slide 8
WHY DO THESE CHANGES MATTER?
Today’s loads look more like these
-150
-100
-50
0
50
100
150
0 60 120 180 240 300 360
Voltage/Current
Variable Speed Motor
Voltage
Current
9. Slide 9
WHY DO THESE CHANGES MATTER?
Today’s loads look more like these
-150
-100
-50
0
50
100
150
0.00 60.00 120.00 180.00 240.00 300.00 360.00
Voltage
Current for Switching Power Supply
Voltage
Current
10. Slide 10
THREE PHASE POWER
INTRODUCTION
Van
Vcn
Vbn
Phase A
Phase B
Phase C
Neutral
(Ground)
Basic Assumptions
•Three AC voltage sources
•Voltages Displaced in time
•Each sinusoidal
•Identical in Amplitude
11. Slide 11
AC THEORY – SINE WAVE
max)( VSinV
120rmsV
169pkV
707.0max VVRMS
15. Slide 15
-1.5
-1.0
-0.5
0.0
0.5
1.0
1.5
0 120 240 360 480
AMPLITUDE
PHASE ANGLE
THREE PHASE POWER
AT THE GENERATOR
Three voltage vectors
each separated by
120°.
Peak voltages
essentially equal.
Most of what makes three phase systems seem complex is what we do to this
simple picture in the delivery system and loads.
VcnVan Vbn
16. Slide 16
THREE PHASE POWER
BASIC CONCEPT – PHASE ROTATION
-1.5
-1.0
-0.5
0.0
0.5
1.0
1.5
0 120 240 360 480
PHASE ANGLE
AMPLITUDE
VanVbnVcn
Phase Rotation:
The order in which the
phases reach peak
voltage.
There are only two
possible sequences:
A-B-C (previous slide)
C-B-A (this slide)
Phase rotation is important because the direction of rotation of a three phase
motor is determined by the phase order.
18. Slide 18
-1.5
-1.0
-0.5
0.0
0.5
1.0
1.5
0 120 240 360 480
AMPLITUDE
PHASE ANGLE
0
270
90
180
THREE PHASE THEORY
PHASORS AND VECTOR NOTATION
• Phasors are a graphical means of representing the
amplitude and phase relationships of voltages and
currents.
V = sin(θ)
19. Slide 19
0
270
90
180
THREE PHASE POWER
PHASORS AND VECTOR NOTATION
• As stated in the Handbook of Electricity Metering, by
common consent, counterclockwise phase rotation has
been chosen for general use in phasor diagrams.
-1.5
-1.0
-0.5
0.0
0.5
1.0
1.5
0 120 240 360 480
AMPLITUDE
PHASE ANGLE
V = V0sin(θ-120)
20. Slide 20
0
270
90
180
THREE PHASE POWER
PHASORS AND VECTOR NOTATION
• The phasor diagram for a simple 3-phase system has
three voltage phasors equally spaced at 120° intervals.
• Going clockwise the order is A – B – C.
-1.5
-1.0
-0.5
0.0
0.5
1.0
1.5
0 120 240 360 480
AMPLITUDE
PHASE ANGLE
V = V0sin(θ-240)
21. Slide 21
THREE PHASE THEORY
SYMBOLS AND CONVENTIONS
• Systems formed by
interconnecting secondaries
of 3 single phase
transformers.
• Generally primaries are not
show unless details of actual
transformer are being
discussed.
A
B
C
N
Ia
Ib
Ic
22. Slide 22
THREE PHASE THEORY
SYMBOLS AND CONVENTIONS
• Often even the coils are not
shown but are replaced by
simple line drawings
A
B
C
N
Ia
Ib
Ic
23. Slide 23
3 PHASE, 4-WIRE “Y” SERVICE
0° = UNITY POWER FACTOR
• Three
Voltage
Phasors
• 120° Apart
• Three
Current
Phasors
• Aligned with
Voltage at
PF=1
24. Slide 24
SYMBOLS AND CONVENTIONS
LABELING
• Voltages are generally labeled Va, Vb, Vc, Vn for the
three phases and neutral
• This can be confusing in complex cases
• The recommended approach is to use two
subscripts so the two points between which the
voltage is measured are unambiguous
B
C
A
N Vca
Vbn
Van
Vcn
Vab
Vbc
Vab means voltage at “a” as
measured relative to “b”.
25. Slide 25
Source
B
C
N
Ia
Ib
Load
A
B
C
N
A
208
120
120
2 PHASE, 3-WIRE “Y” SERVICE
“NETWORK CONNECTION”
Single phase variant of the service.
Two voltage sources with their returns connected to a common point.
Provides 208 rather than 240 volts across “high side” wires.
26. Slide 26
2 PHASE, 3-WIRE “NETWORK” SERVICE
• Two Voltage
Phasors
• 120° Apart
• Two Current
Phasors
• Aligned with
Voltage at
PF=1
27. Slide 27
Source
B
C
Ia
Ib
Ic
Load
A
B
C
A
240
240
240
3 PHASE, 3-WIRE DELTA SERVICE
Common service type for industrial customers. This service has NO
neutral.
•Voltages normally measured relative to phase B.
•Voltage and current vectors do not align.
•Service is provided even when a phase is grounded.
28. Slide 28
3 PHASE, 3-WIRE DELTA SERVICE
RESISTIVE LOADS
• Two Voltage
Phasors
• 60° Apart
• Two Current
Phasors
• For a
resistive load
one current
leads by 30°
while the
other lags by
30°
29. Slide 29
3 PHASE, 3-WIRE DELTA SERVICE
RESISTIVE LOAD
• Two Voltage
Phasors
• 60° Apart
• Two Current
Phasors
• For a
resistive load
one current
leads by 30°
while the
other lags by
30°
30. Slide 30
Source
B
C
Ib
Ic
Load
IaA
N
3 PHASE, 4-WIRE DELTA SERVICE
Common service type for industrial customers. Provides a residential
like 120/240 service (lighting service) single phase 208 (high side) and
even 3 phase 240 V.
•Voltage phasors form a “T” 90° apart
•Currents are at 120° spacing
•In 120/120/208 form only the “hot” (208) leg has its voltage and
current vectors aligned.
31. Slide 31
3 PHASE, 4-WIRE DELTA SERVICE
RESISTIVE LOAD
• Three
Voltage
Phasors
• 90° Apart
• Three
Current
Phasors
• 120°
apart
32. Slide 32
AC THEORY – RESISTIVE LOAD
Sine Wave
-200
-150
-100
-50
0
50
100
150
200
0 60 120 180 240 300 360 420 480 540 600 660 720
Degrees
Amplitude
AC
RVrms
Irms
Resistors are measured in Ohms. When an AC voltage is applied to a resistor, the
current is in phase. A resistive load is considered a “linear” load because when the
voltage is sinusoidal the current is also sinusoidal.
33. Slide 33
Sine Wave
-200
-150
-100
-50
0
50
100
150
200
0 60 120 180 240 300 360 420 480 540 600 660 720
Degrees
Amplitude
AC
LVrms
Irms
AC THEORY – INDUCTIVE LOAD
Inductors are measured in Henries. When an AC voltage is applied to an inductor,
the current is 90 degrees out of phase. We say the current “lags” the voltage. A
inductive load is considered a “linear” load because when the voltage is sinusoidal
the current is also sinusoidal.
34. Slide 34
AC THEORY – CAPACITIVE LOAD
AC CVrms
Irms
Sine Wave
-200
-150
-100
-50
0
50
100
150
200
0 60 120 180 240 300 360 420 480 540 600 660 720
Degrees
Amplitude
Capacitors are measured in Farads. When an AC voltage is applied to a capacitor,
the current is 90 degrees out of phase. We say the current “leads” the voltage. A
capacitive load is considered a “linear” load because when the voltage is
sinusoidal the current is sinusoidal.
35. Slide 35
AC THEORY – POWER
• Power is defined as: P = VI
• Since the voltage and current at every point
in time for an AC signal is different, we have
to distinguish between instantaneous power
and average power. Generally when we say
“power” we mean average power.
• Average power is only defined over an
integral number of cycles.
36. Slide 36
TIME OUT FOR TRIG
(RIGHT TRIANGLES)
c
a
Cos )(
a
b
Tan )( a
c
b
90°
The Right Triangle:
The Pythagorean theory
c2 = a2 + b2
c
b
Sin )(
37. Slide 37
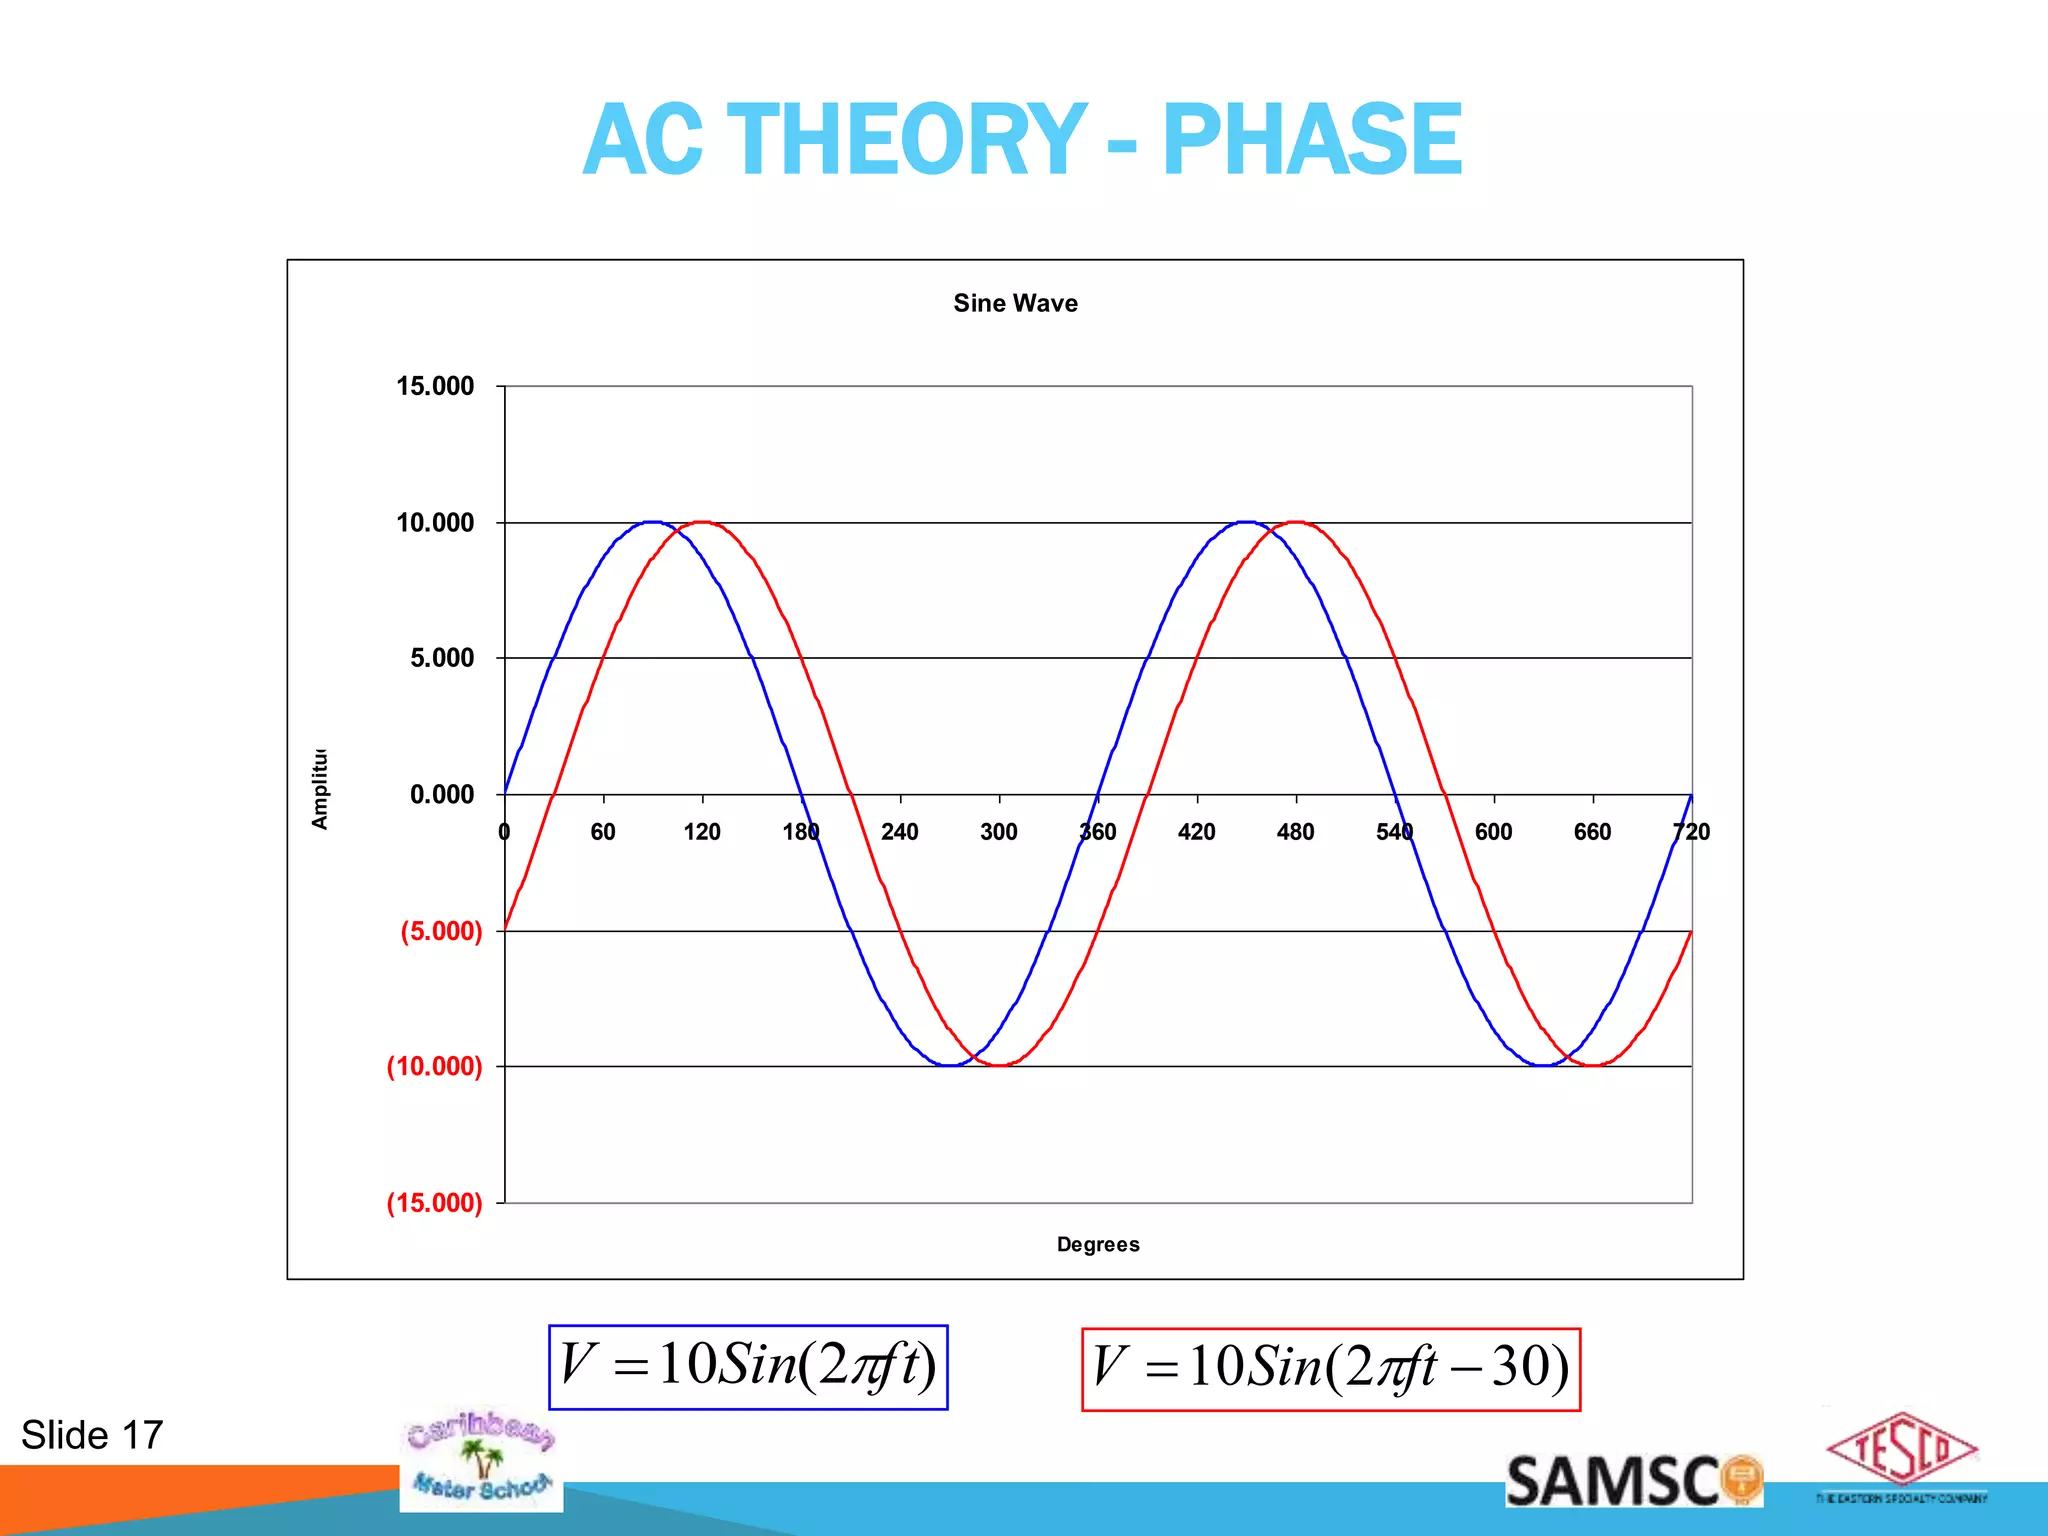
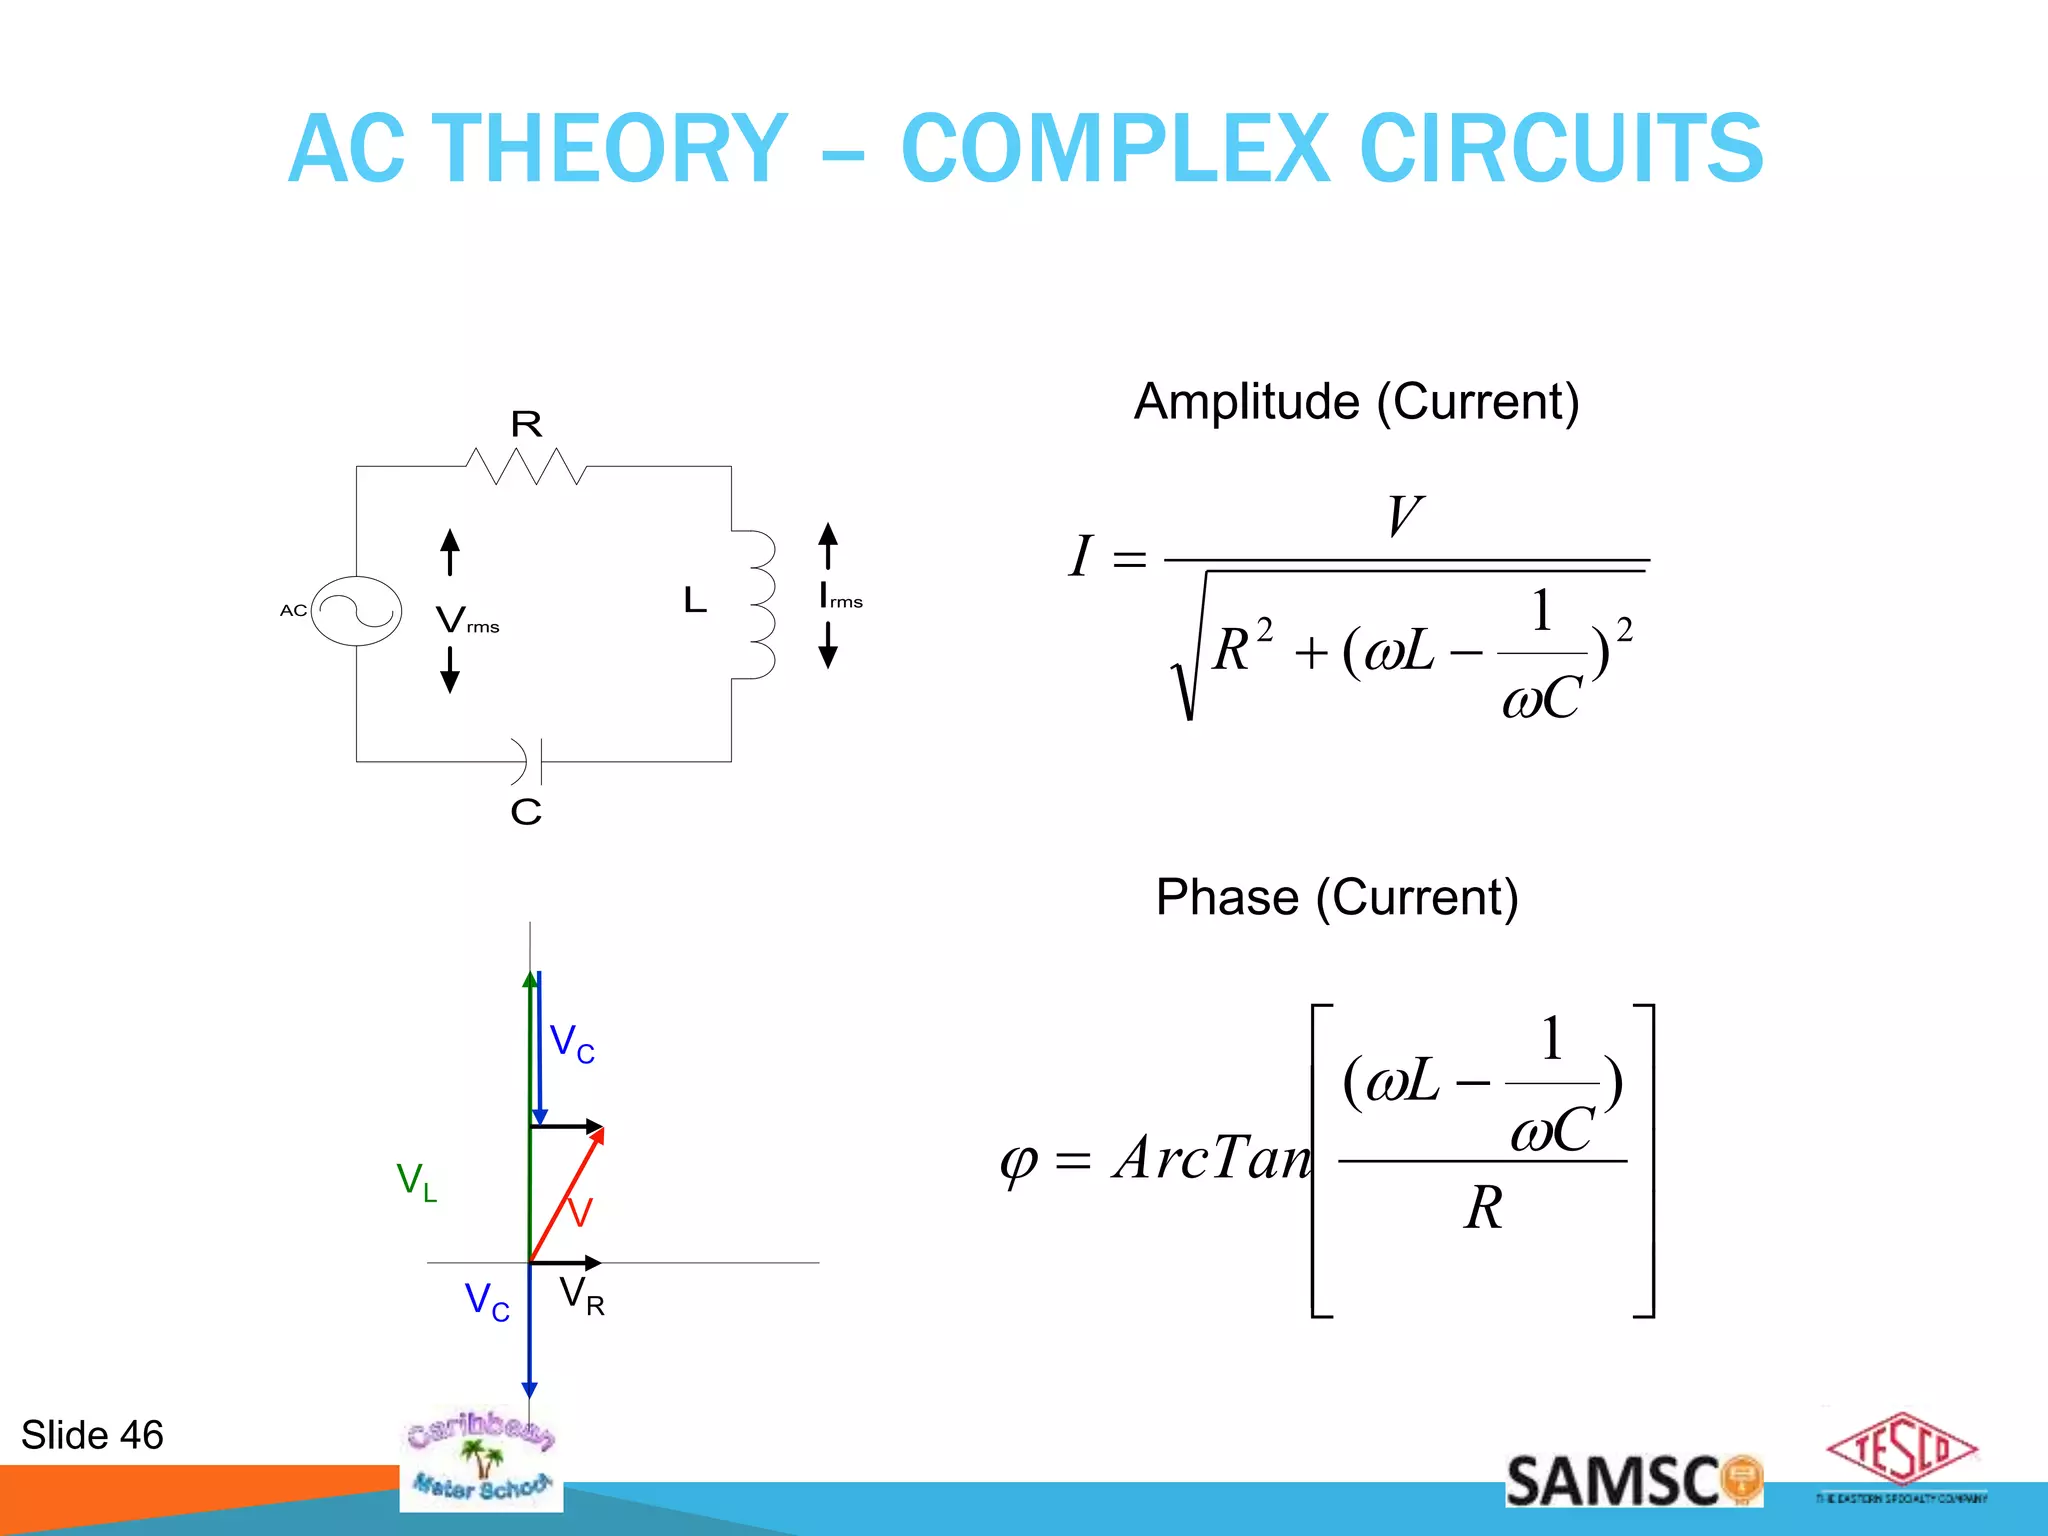
AC THEORY – DEFINITIONS
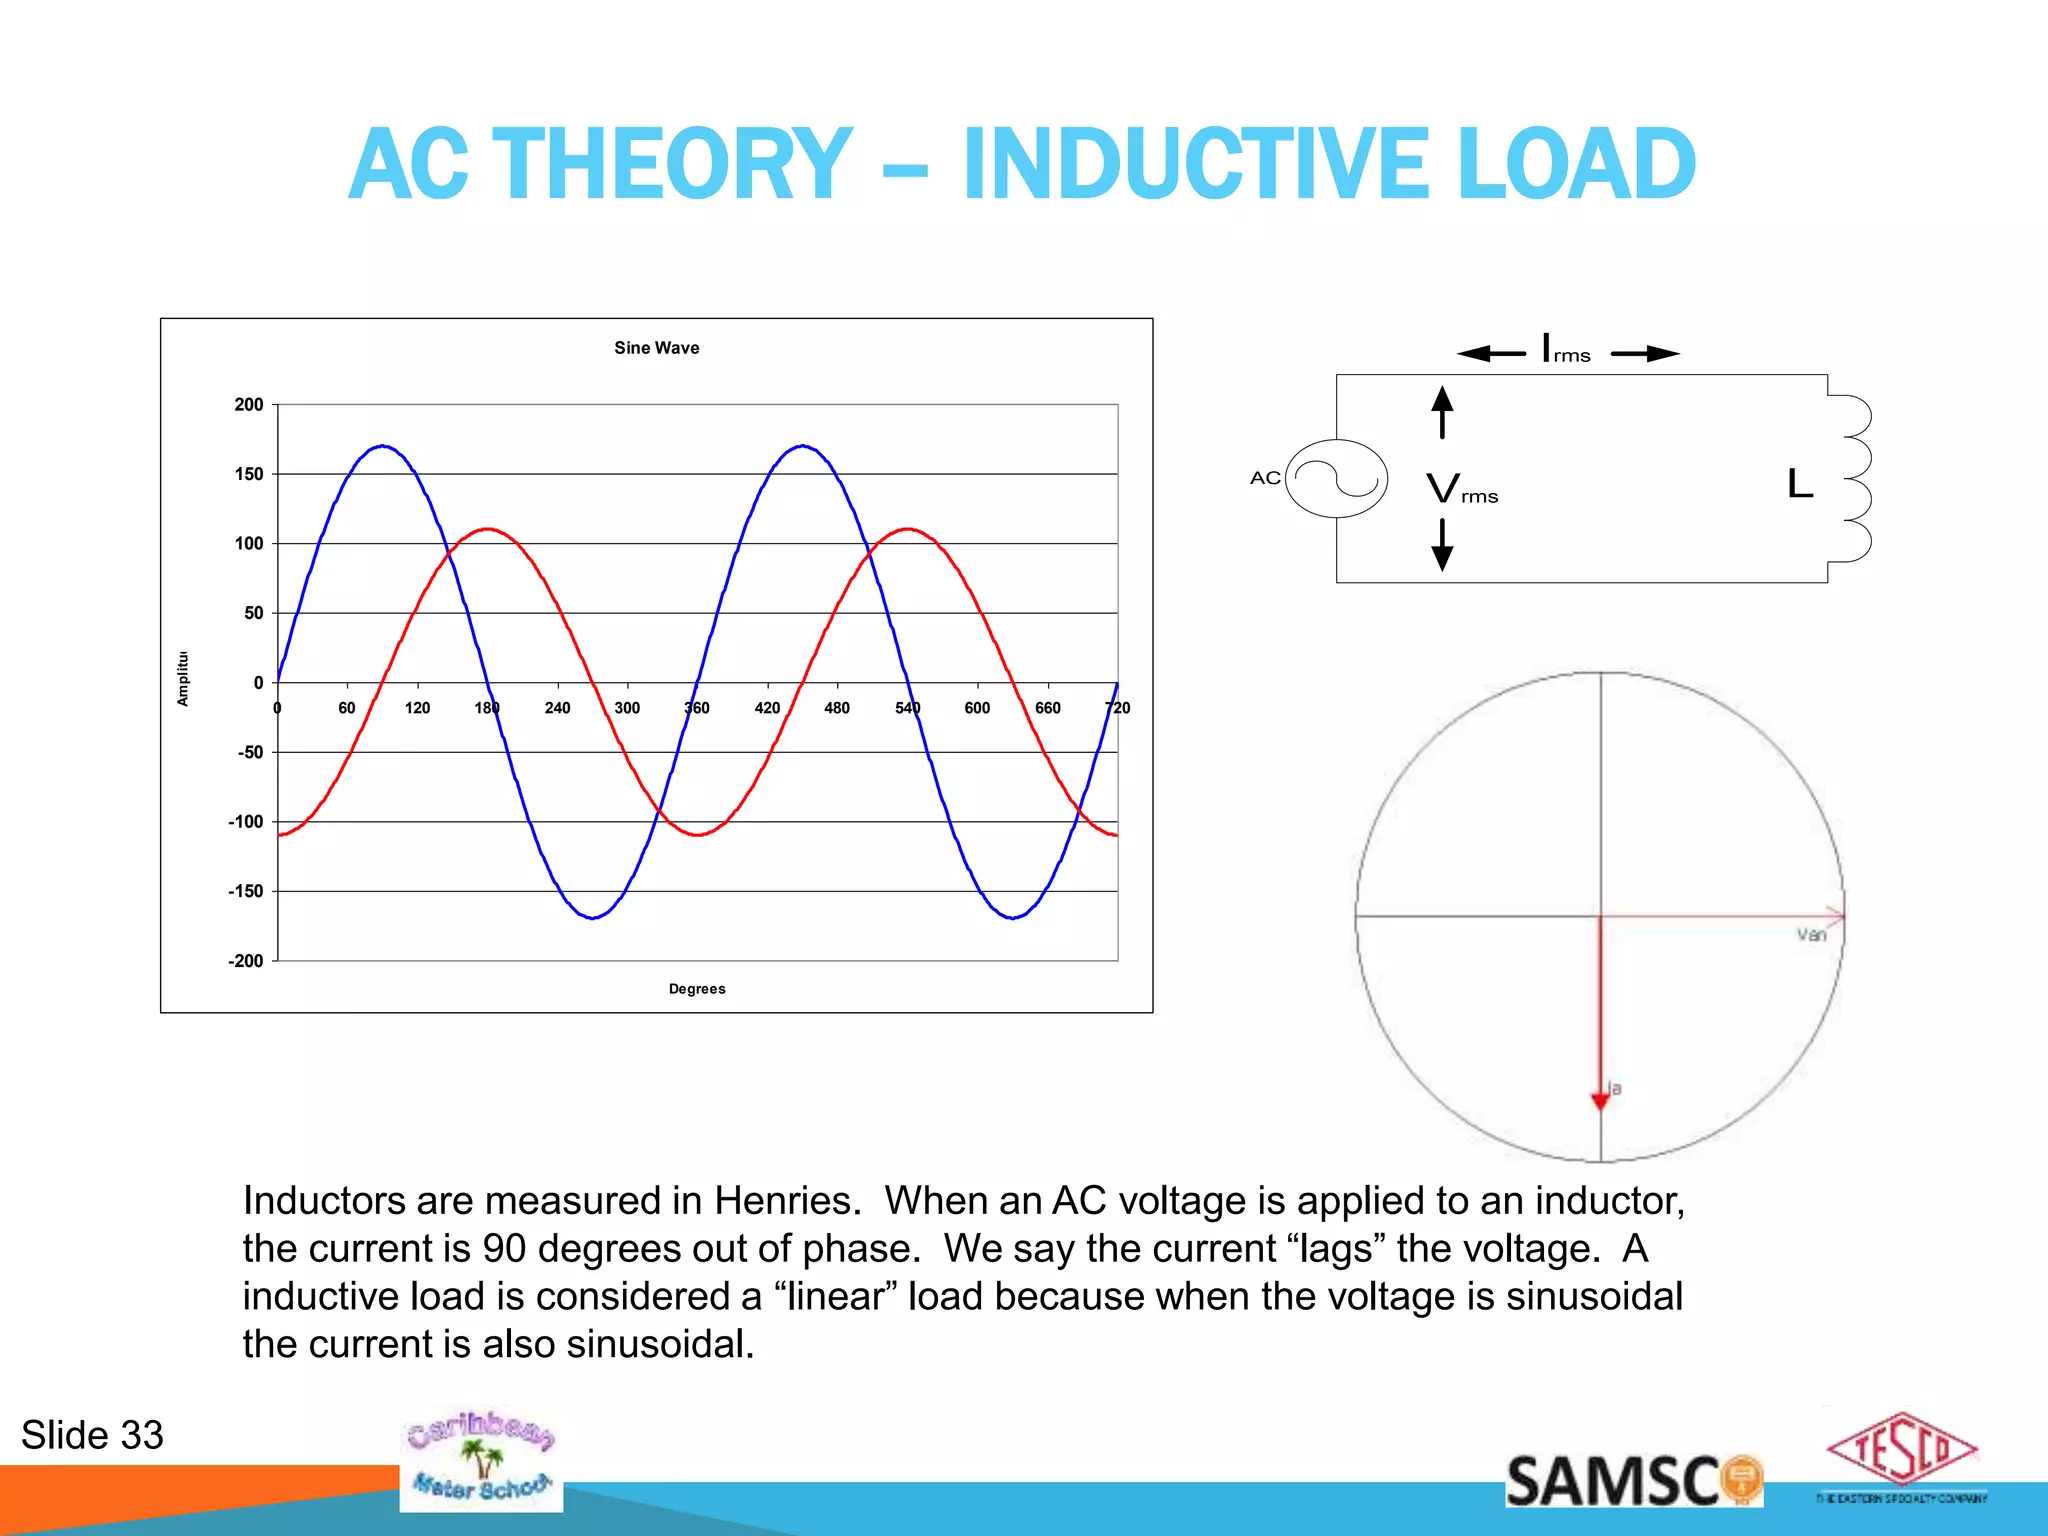
• Inductive Reactance – The inductive opposition in a AC circuit = XL
• Capacitive Reactance – The capacitive opposition in a AC circuit =
XC
• Impedance – Total opposition to the flow of current in an AC circuit
which includes resistance, XL and XC.
Impedance = Z = √ [R2 + (XL – XC)2]
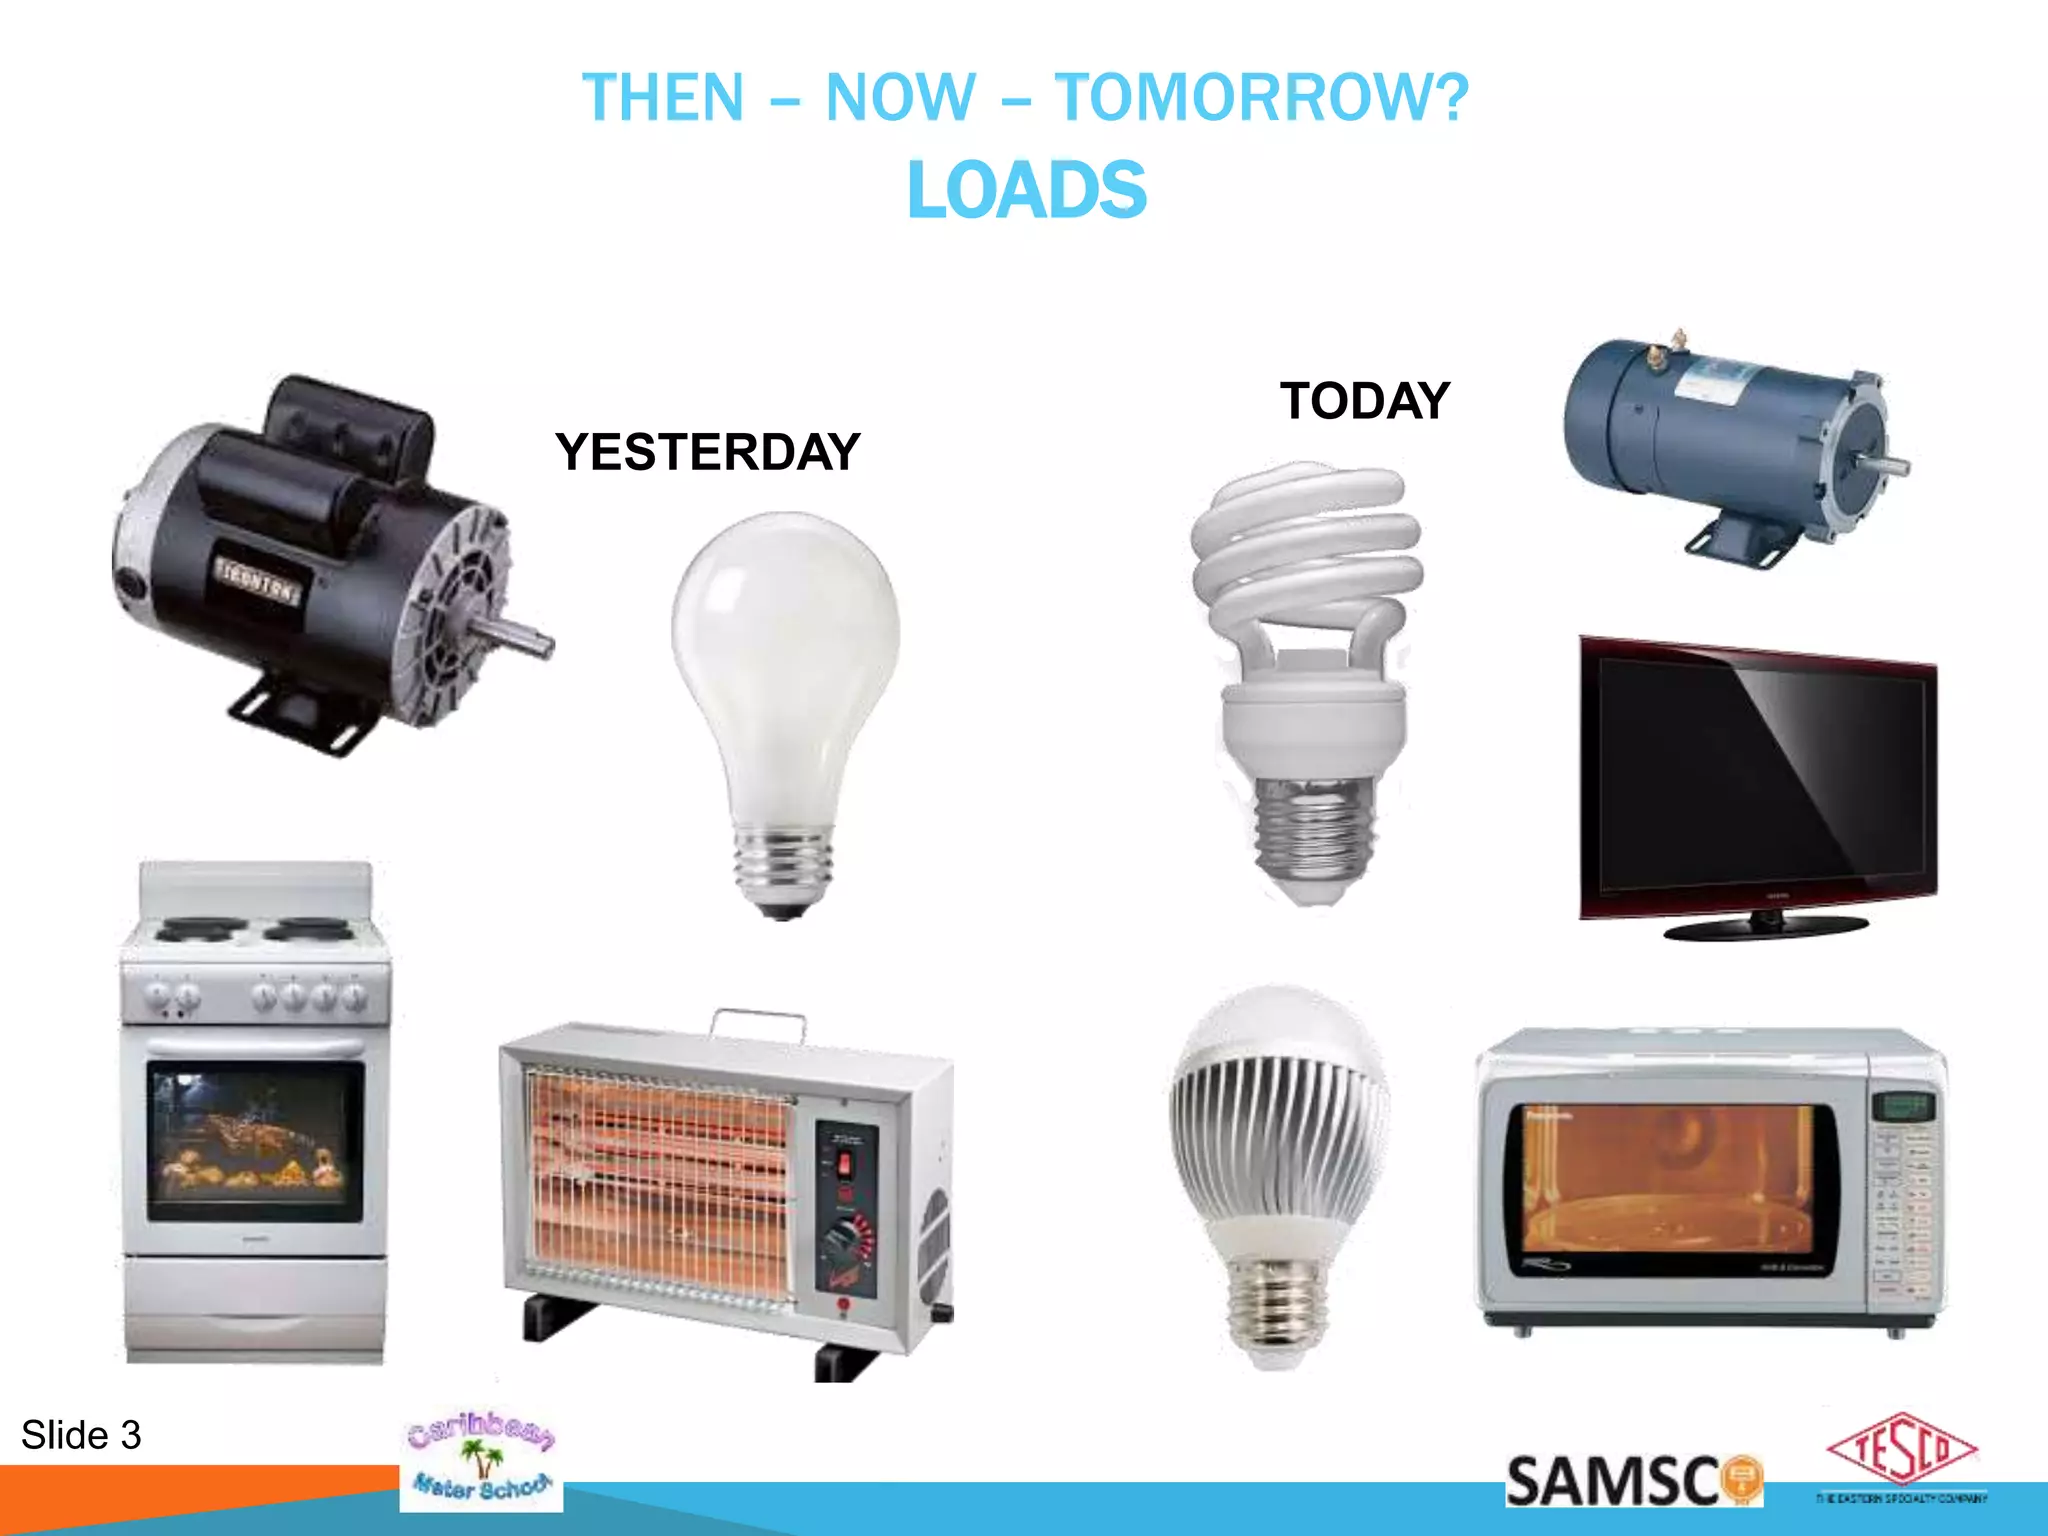
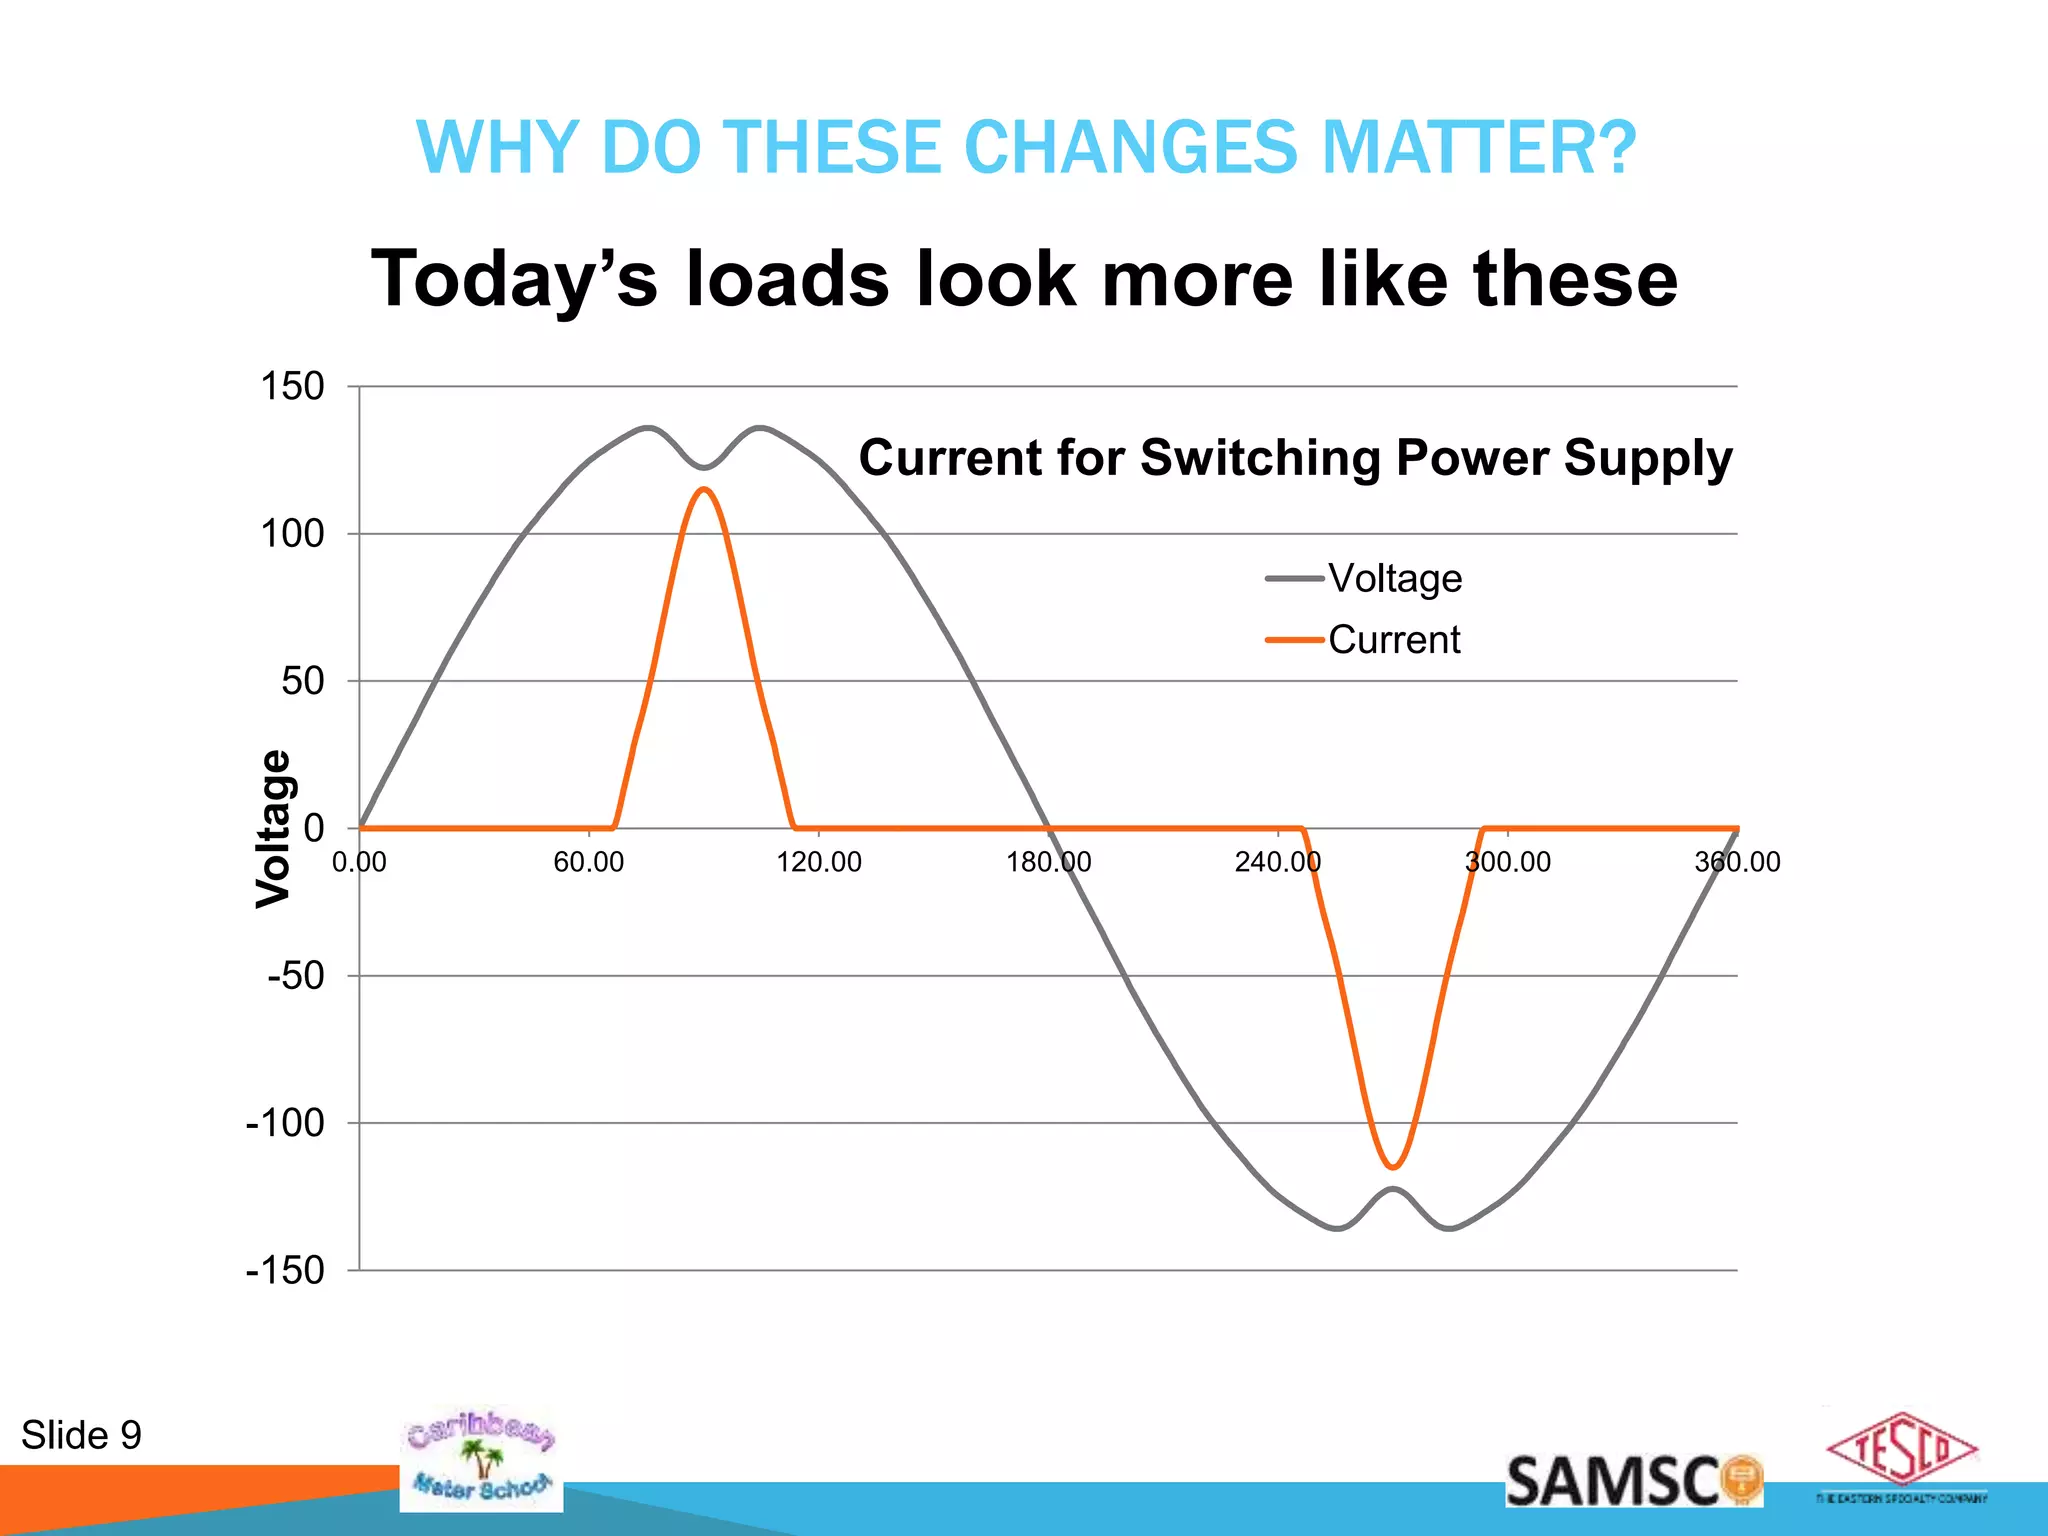
• Resistive Loads – Light bulbs, heater, etc
• Inductive Loads – Electric motors, fans, air conditioners, etc.
• Capacitive Loads – Capacitors used to compensate for inductive
loads
38. Slide 38
AC THEORY – POWER TRIANGLE
(SINUSOIDAL WAVEFORMS)
If V = Sin(ωt) and I = Sin(ωt - θ) (the load is linear) then:
Active Power = VICos(θ) Watts
Reactive Power = VISin(θ) VARs
Apparent Power = VI VA
Power Factor = Active/Apparent = Cos(θ)
Watts
VARs
39. Slide 39
AC THEORY – ACTIVE POWER
(REAL POWER (KW))
• In a circuit that contains only resistance:
– Real Power (kW) = VRMS * IRMS
• In a circuit that contains resistance and reactance:
– Real Power (kW) = VRMS * IRMS * COS (θ)
40. Slide 40
AC THEORY – APPARENT POWER
(KVA)
• Kilo-Volt-Amperes (kVA) are the product of Volts and the Total Current which
flows because of the voltage.
• In a circuit that contains only resistance, KVA (apparent power) is equal to the
Real Power (kW).
• When reactance is introduced into a circuit, and VRMS and IRMS are measured
quantities, then:
• kVA = VRMS * IRMS
• In a circuit where only Real Power (kW) and Reactive Power (kVAR) are
measured quantities, then:
• kVA = √(kW2 + kVAR2)
41. Slide 41
AC THEORY – REACTIVE POWER
(KVAR)
• Reactive Volt Amperes are the product of the total Volt-
Amperes and the Sine of the angle of displacement
between Voltage and Current.
• Reactive Power (kVAR) = VRMS * IRMS * SIN(θ)
• kVAR reduces the efficiency in the distribution system,
and is NOT used to deliver active power (kW) to the load.
43. Slide 43
AC THEORY
INSTANTANEOUS POWER
Sine Wave
(200)
(150)
(100)
(50)
0
50
100
150
200
0 60 120 180 240 300 360 420 480 540 600 660 720
Degrees
Amplitude
(25000)
(20000)
(15000)
(10000)
(5000)
0
5000
10000
15000
20000
25000
WATTS
)(max VtCosVV )tCos(I Imax I
For a resistive load: )(I)( maxmax Iv tCostCosVvip
44. Slide 44
AC THEORY
INSTANTANEOUS POWER
Sine Wave
-200
-150
-100
-50
0
50
100
150
200
0 60 120 180 240 300 360 420 480 540 600 660 720
Degrees
Amplitude
-15000
-10000
-5000
0
5000
10000
15000
For an inductive load: )(I)( maxmax Iv tCostCosVvip
)(max VtCosVV )tCos(I Imax I
45. Slide 45
AC THEORY
INSTANTANEOUS POWER
Sine Wave
-200
-150
-100
-50
0
50
100
150
200
0 60 120 180 240 300 360 420 480 540 600 660 720
Degrees
Amplitude
-15000
-10000
-5000
0
5000
10000
15000
For a capacitive load:
)tCos(I Imax I)(max VtCosVV
)(I)( maxmax Iv tCostCosVvip
46. Slide 46
AC THEORY – COMPLEX CIRCUITS
AC
C
Vrms
Irms
R
L
22
)
1
(
C
LR
V
I
Amplitude (Current)
R
C
L
ArcTan
)
1
(
Phase (Current)
VC
V
VL
VC
VR
48. Slide 48
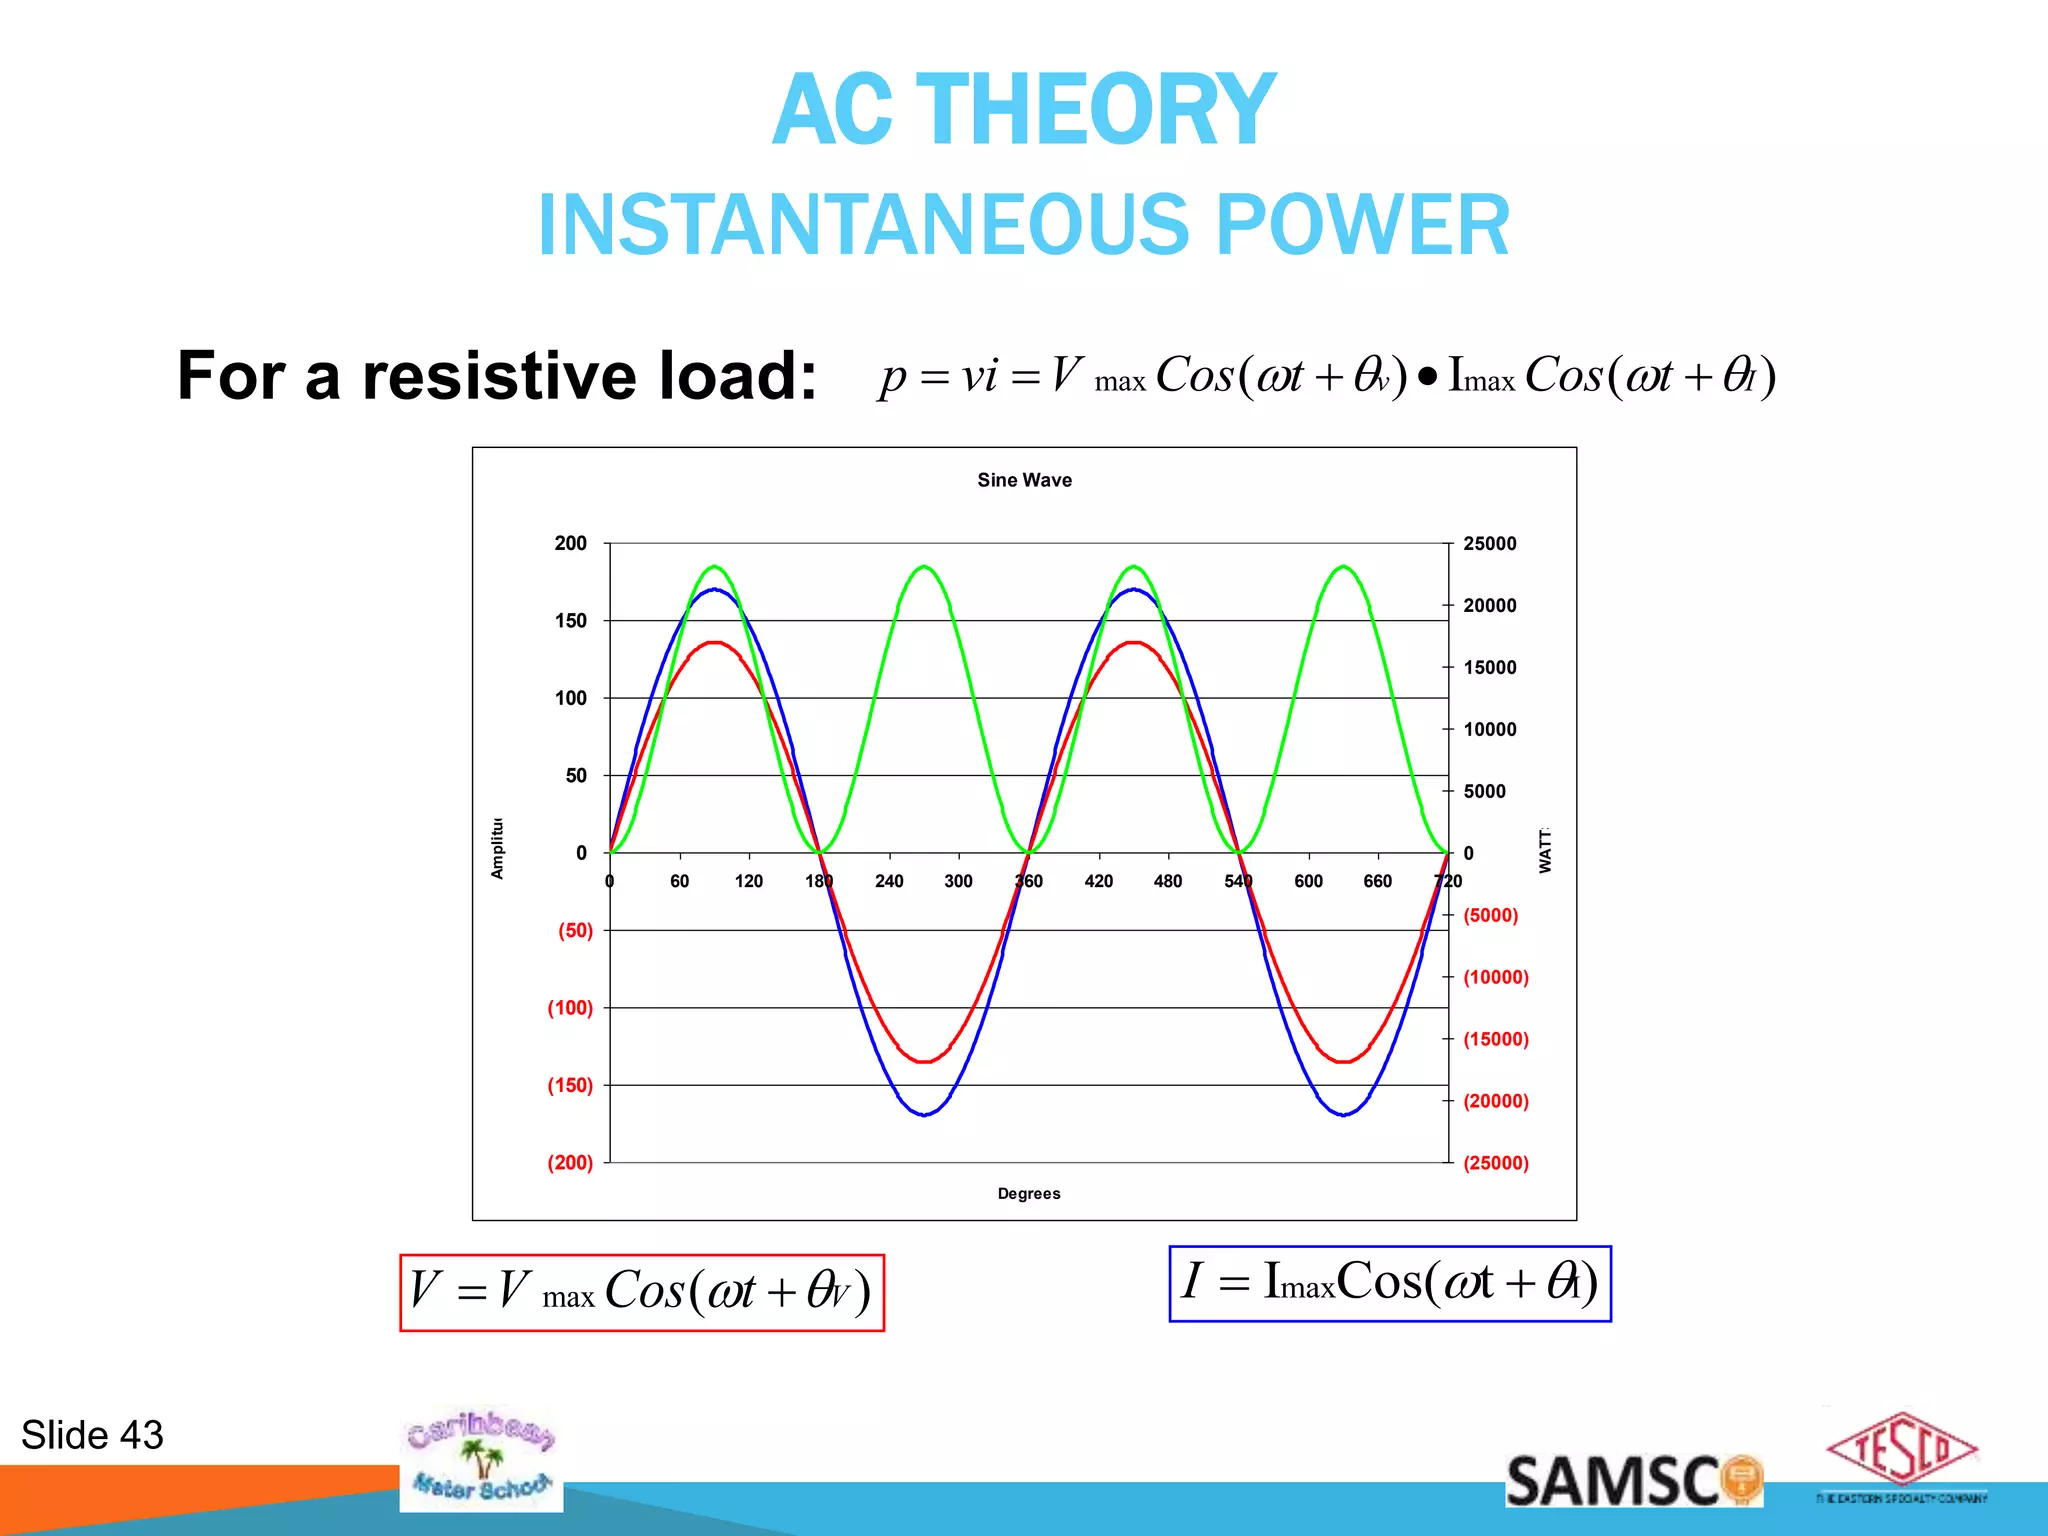
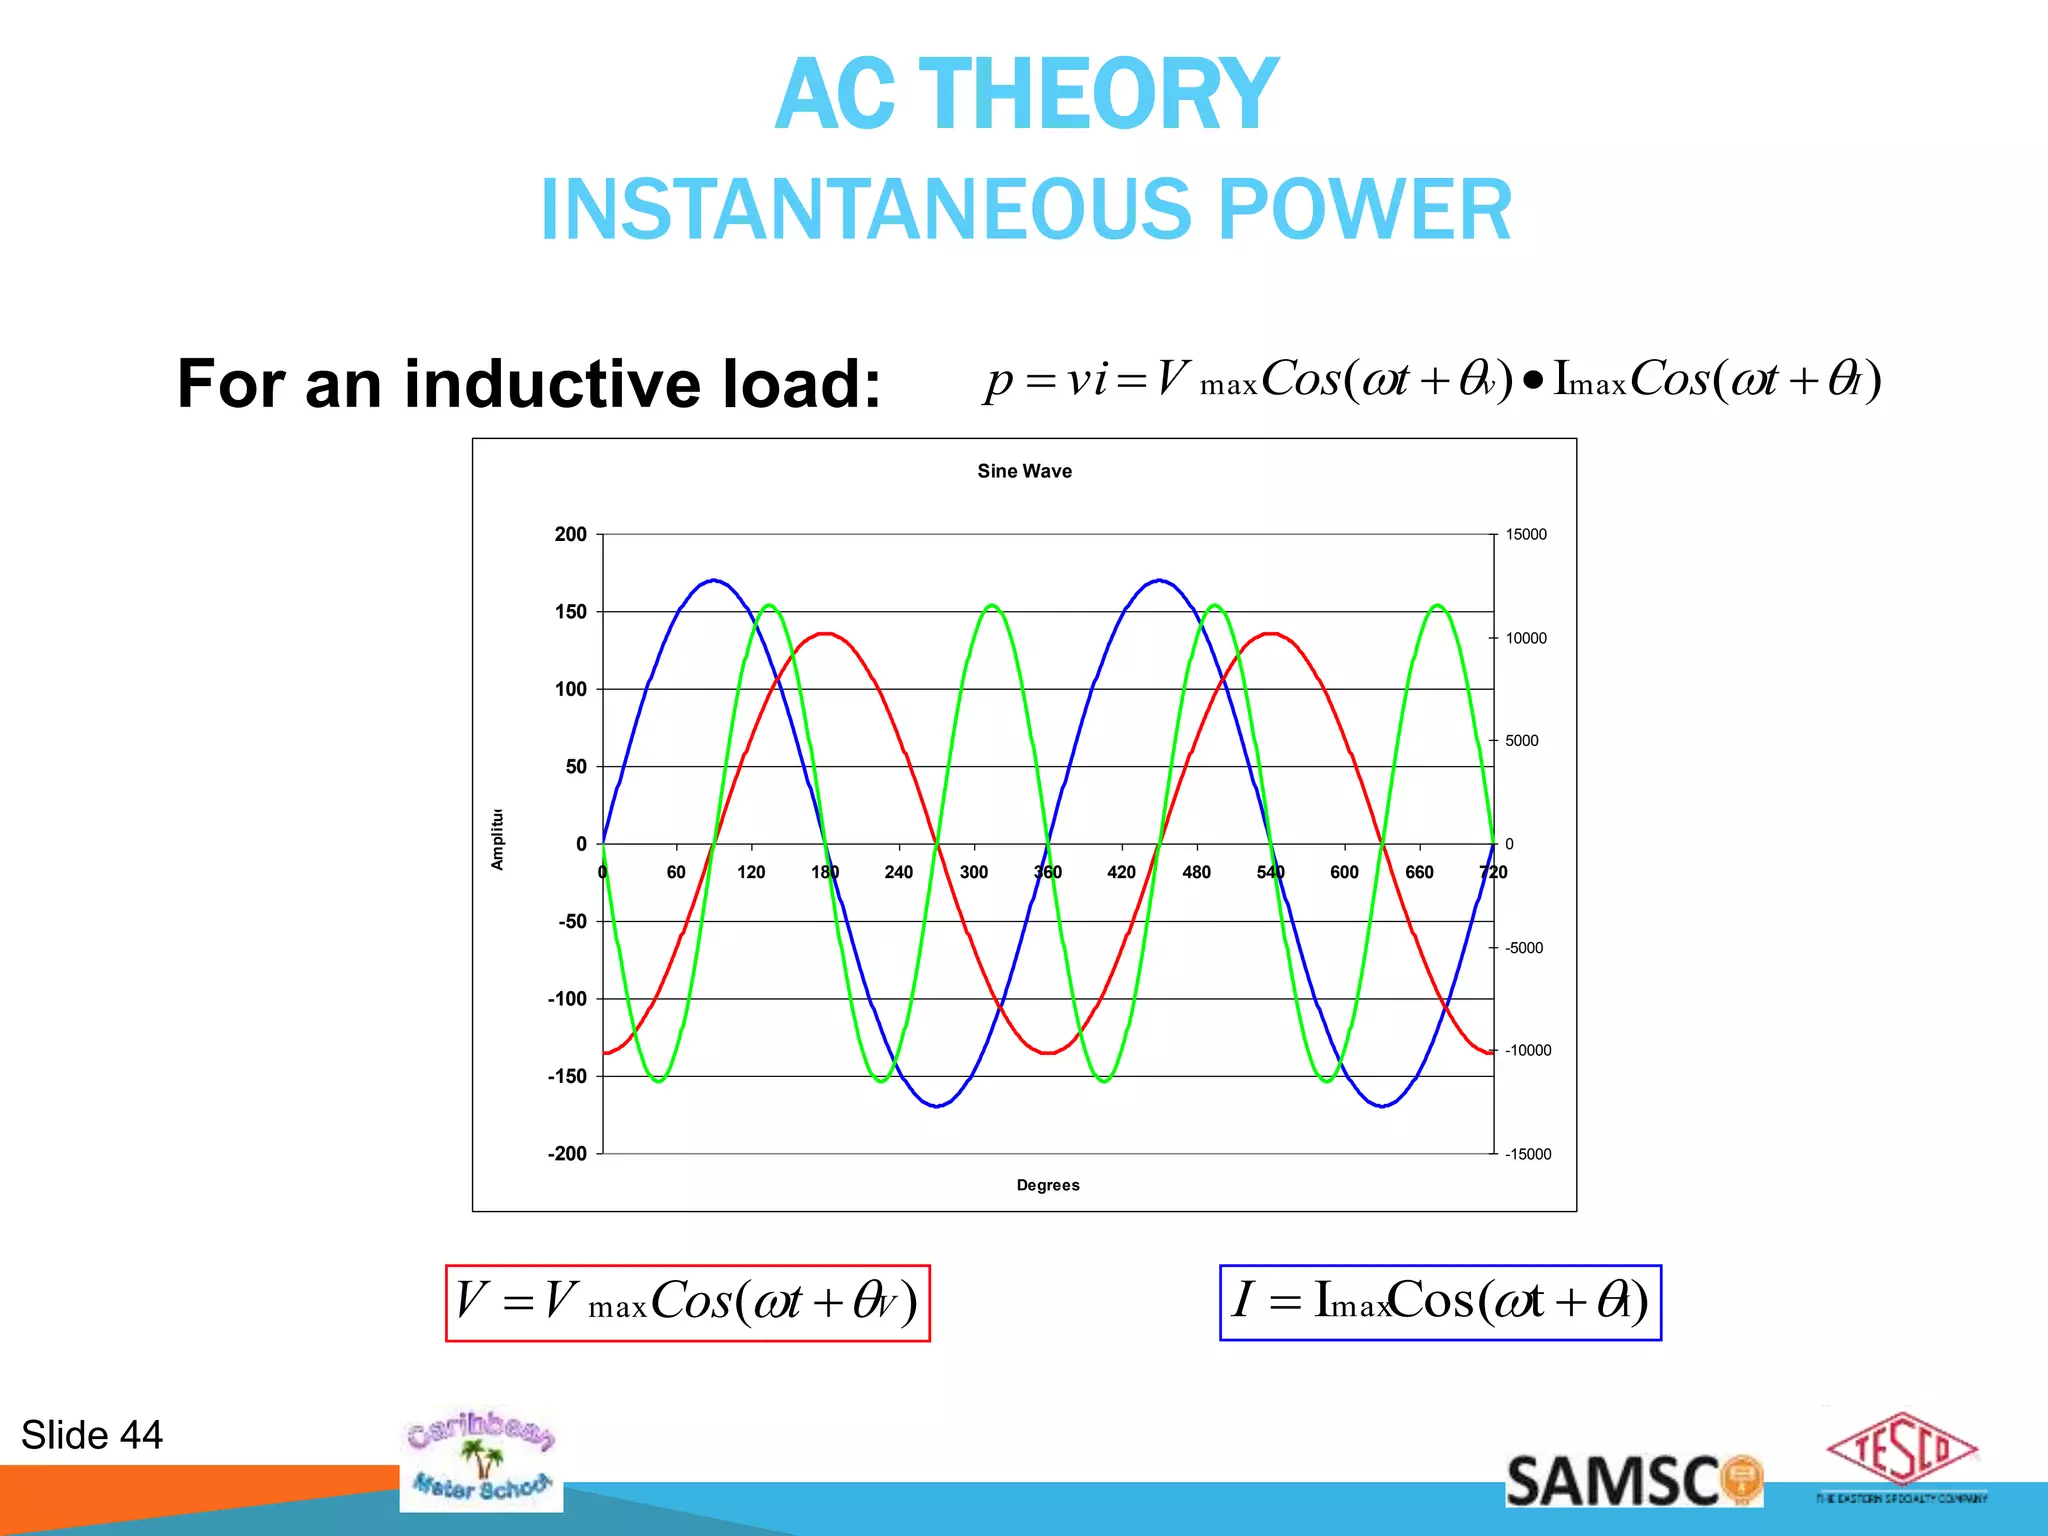
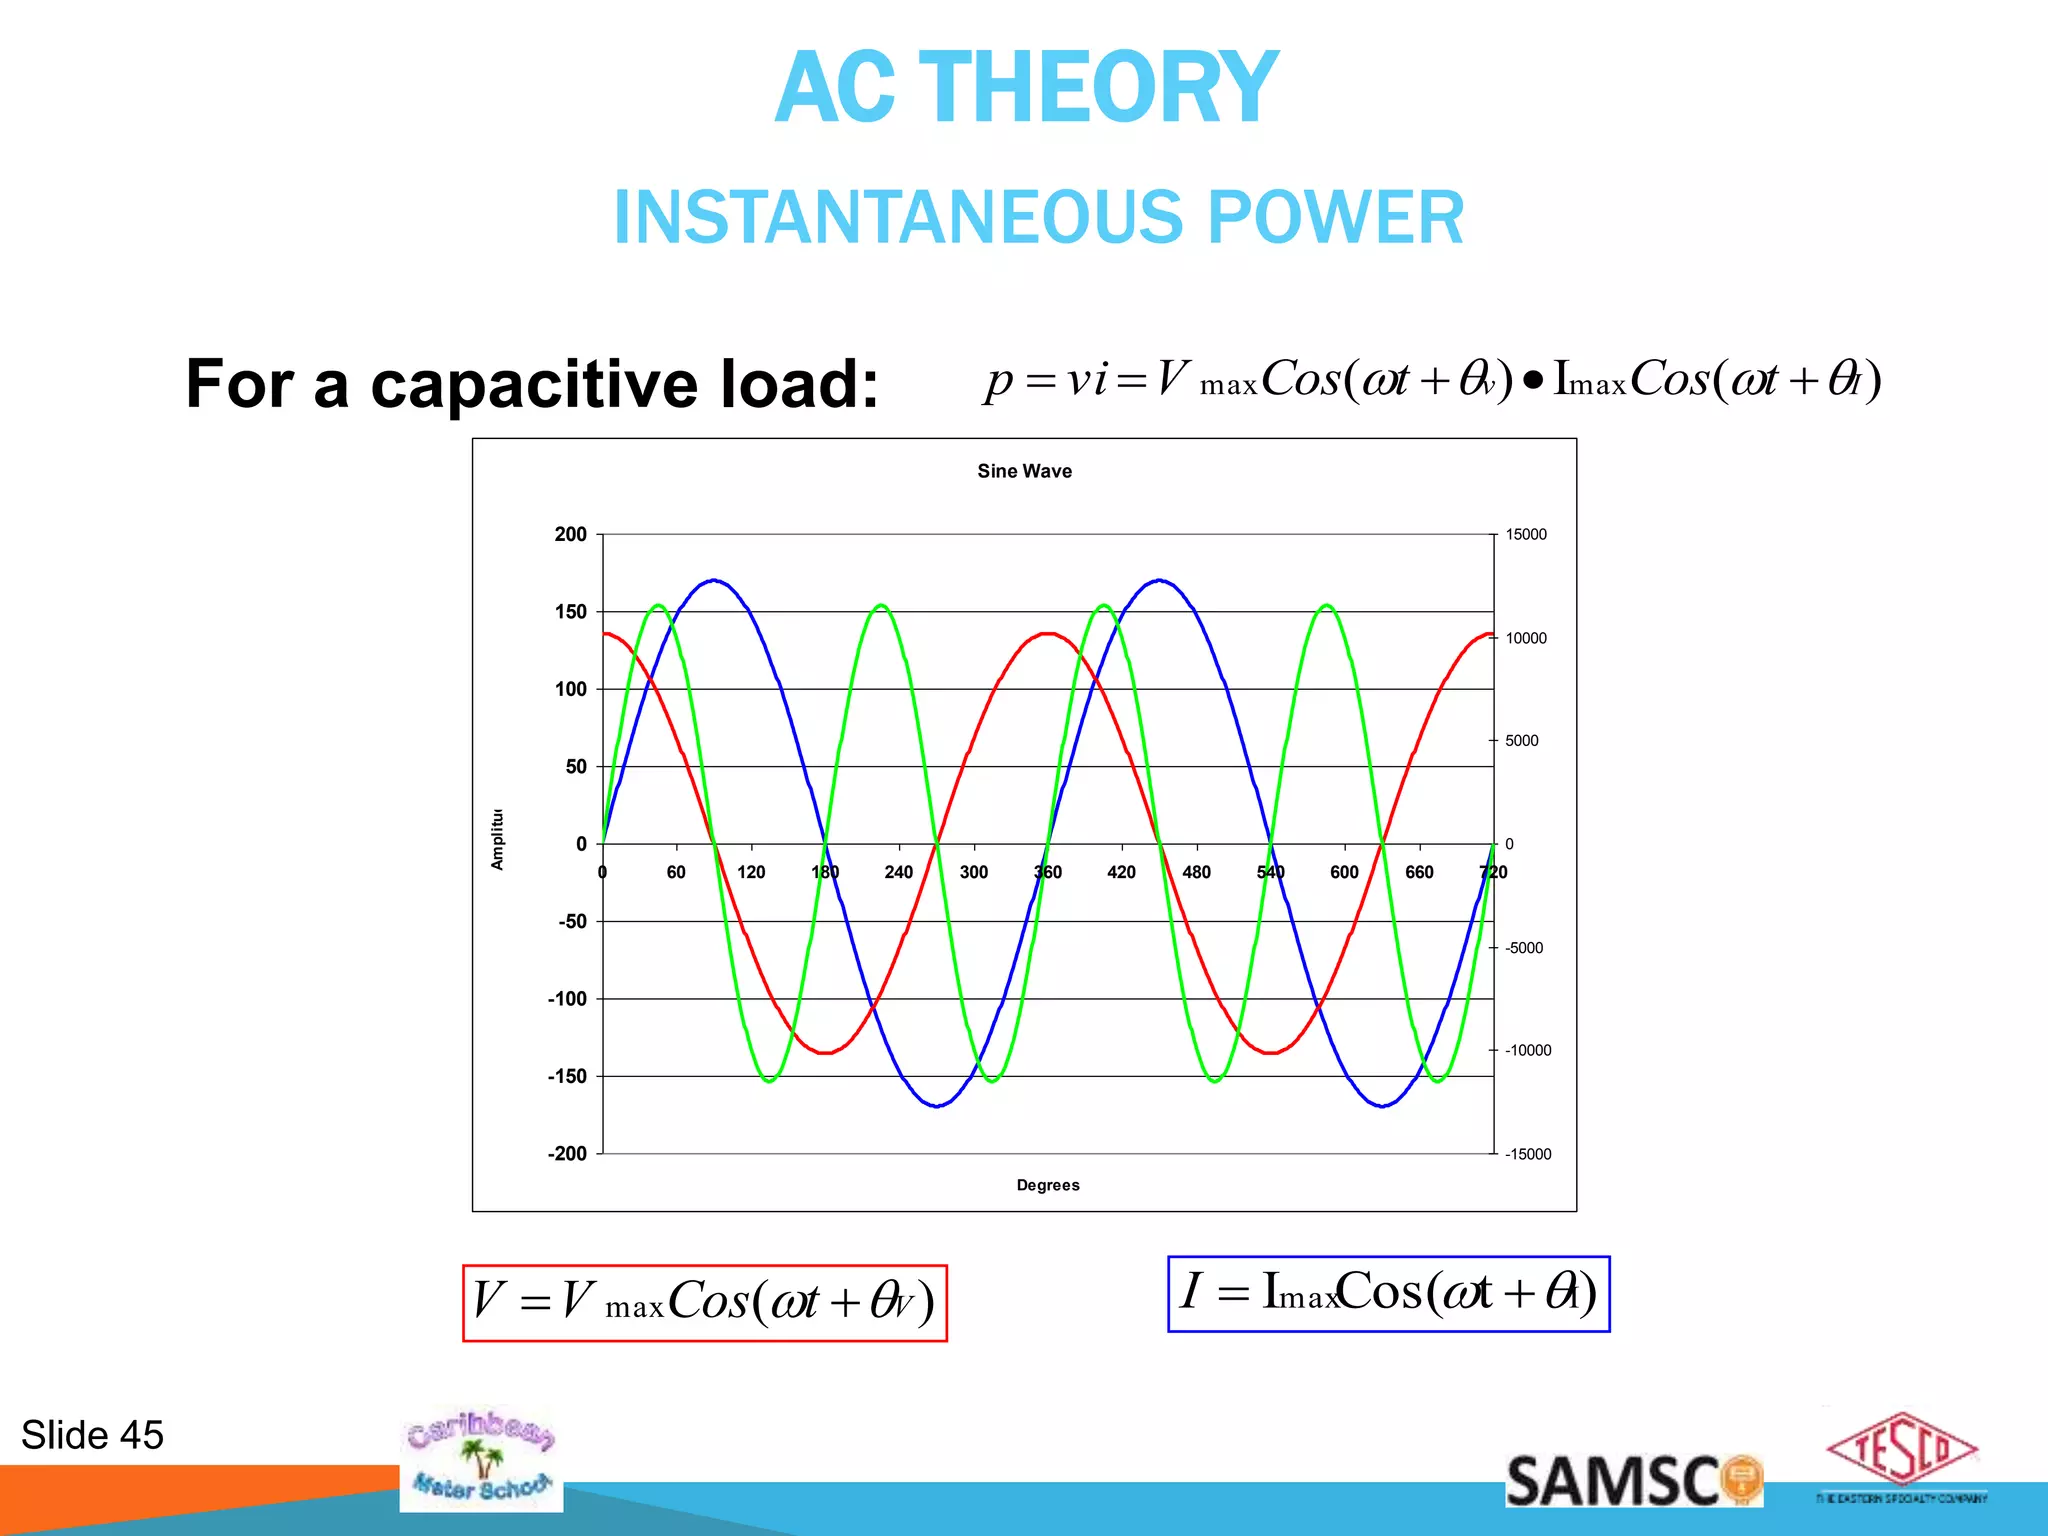
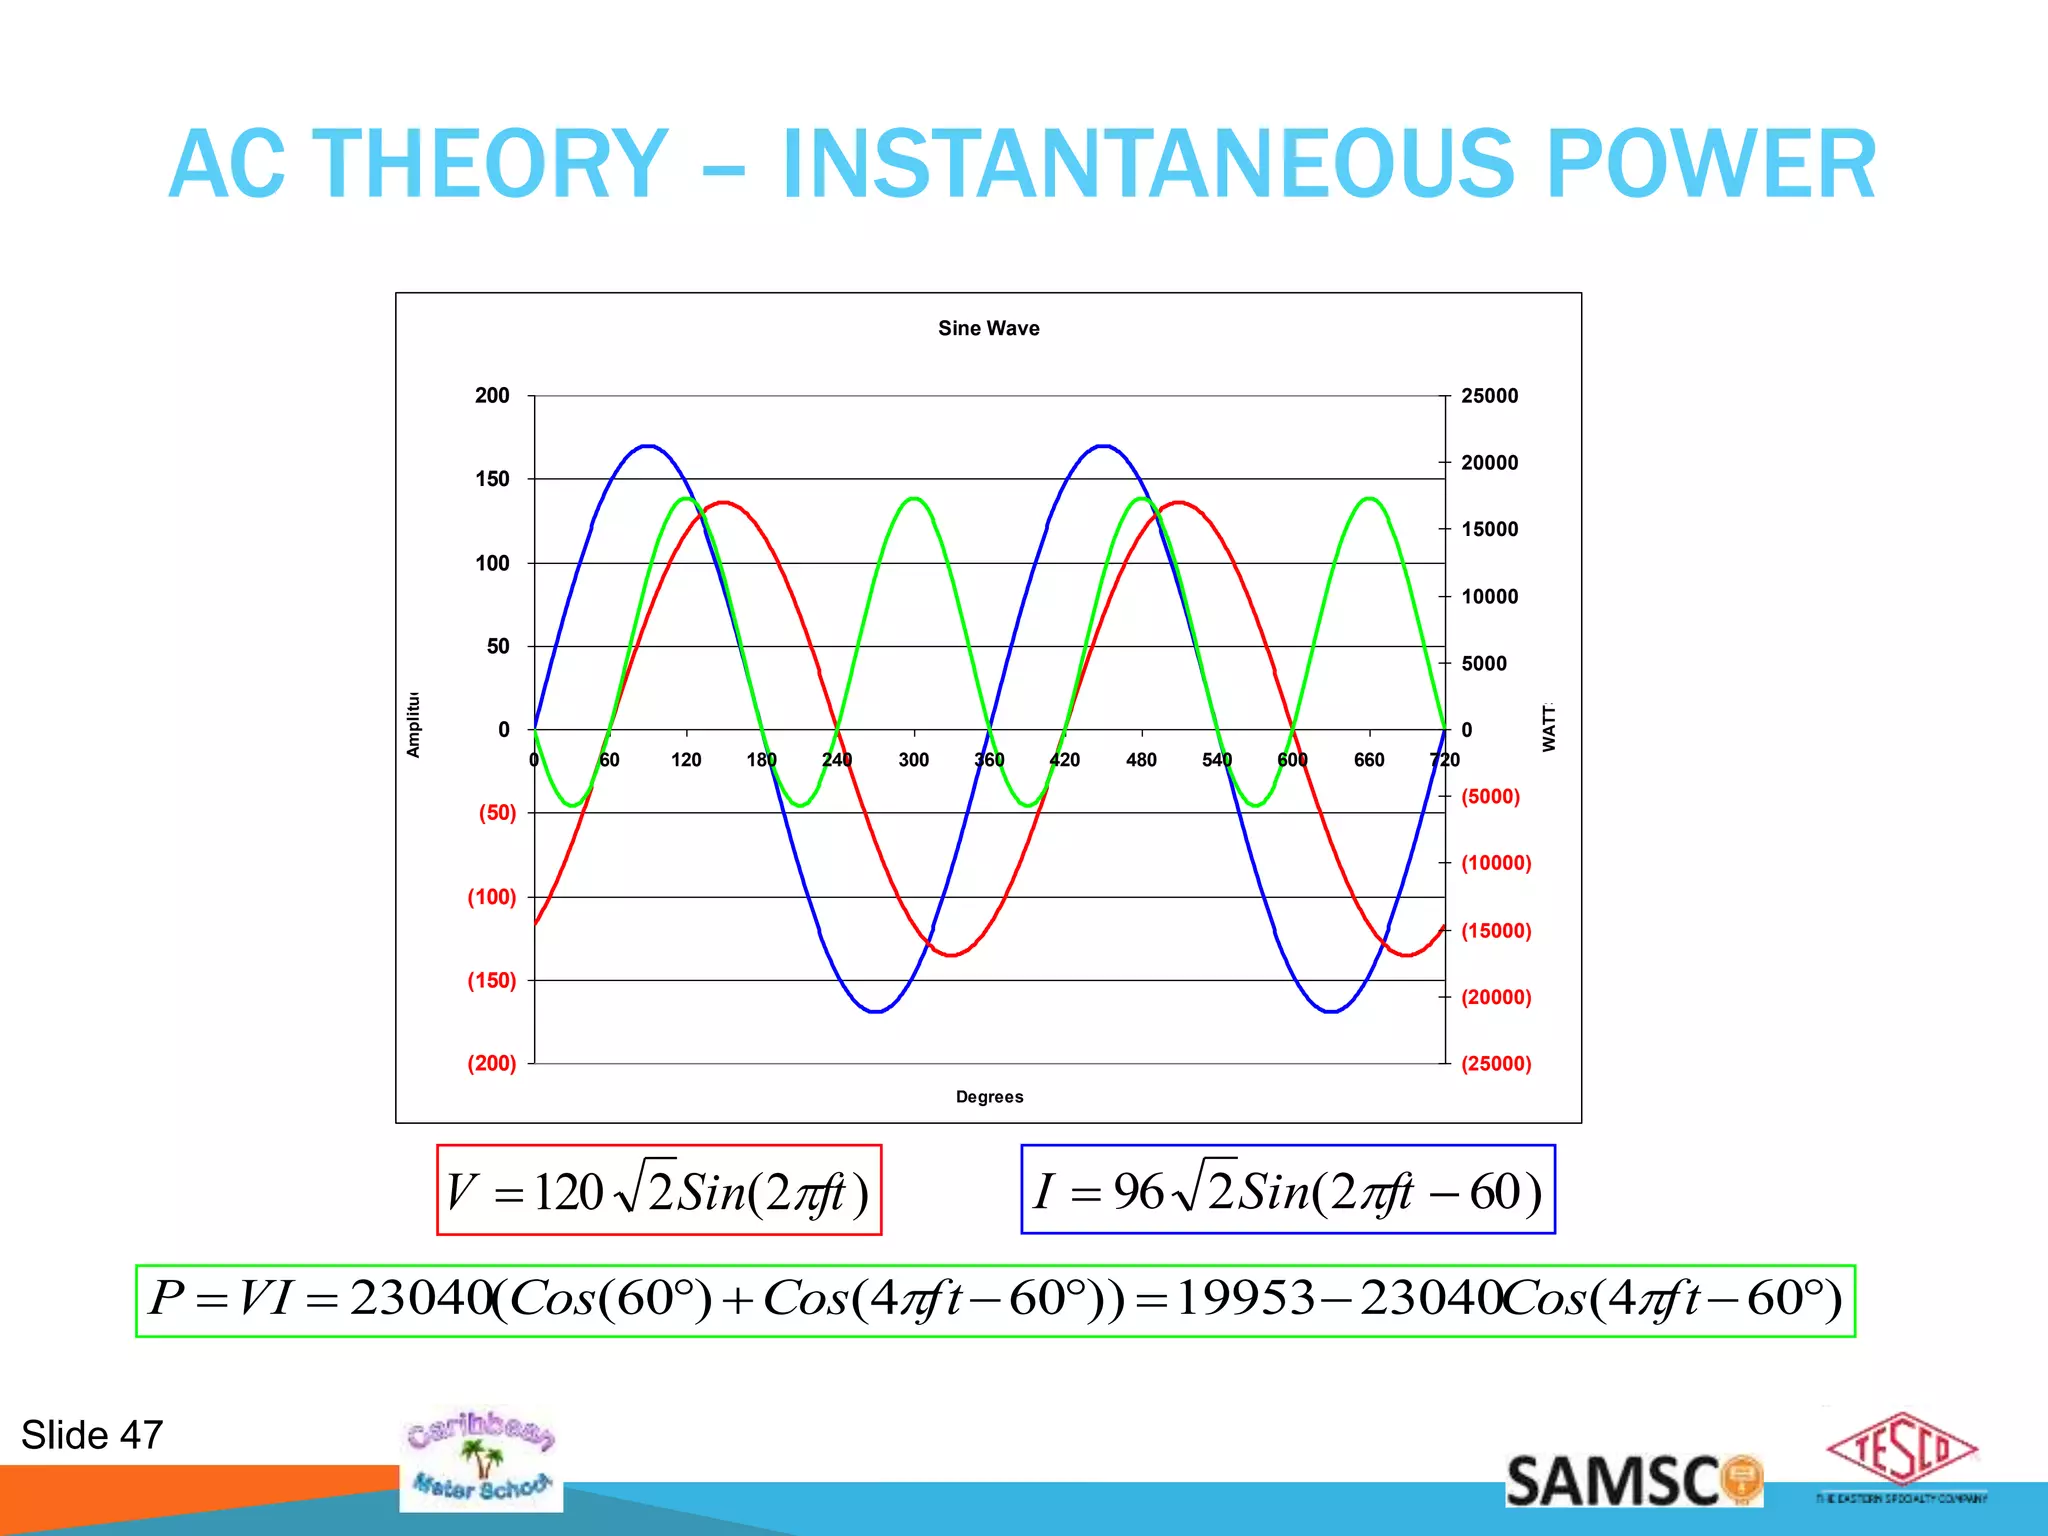
AC THEORY – INSTANTANEOUS
POWER
From IEEE1459 instantaneous power can be
written in several forms:
Sine Wave
(15000)
(10000)
(5000)
0
5000
10000
15000
20000
0 60 120 180 240 300 360 420 480 540 600 660 720
Degrees
Amplitude
Sine Wave
(15000)
(10000)
(5000)
0
5000
10000
15000
20000
0 60 120 180 240 300 360 420 480 540 600 660 720
Degrees
Amplitude
)2cos(cos tVIVIp )2sin(sin)]2cos(1[cos tVItVIp
Active Power Reactive Power
49. Slide 49
THREE PHASE POWER
BLONDEL’S THEOREM
If energy be supplied to any system of conductors
through N wires, the total power in the system is
given by the algebraic sum of the readings of N
wattmeters, so arranged that each of the N wires
contains one current coil, the corresponding voltage
coil being connected between that wire and some
common point. If this common point is on one of the
N wires, the measurement may be made by the use
of N-1 wattmeters.
50. Slide 50
THREE PHASE POWER
BLONDEL’S THEOREM
• Simply put – We can measure the power in a N
wire system by measuring the power in N-1
conductors.
• For example, in a 4-wire, 3-phase system we
need to measure the power in 3 circuits.
51. Slide 51
THREE PHASE POWER
BLONDEL’S THEOREM
• In practice, Blondel’s Theorem is not strictly
adhered to in all applications.
• Meter manufacturers have found ways to design
meters that allow adequate accuracy without
the required number of stators.
52. Slide 52
THREE PHASE POWER
BLONDEL’S THEOREM
• One such meter is the common (form 2S) house meter.
• It is a single stator meter that is specifically designed to meter
a 3-wire circuit.
53. Slide 53
THREE PHASE POWER
BLONDEL’S THEOREM
• Additionally, other meters may be connected in
configurations, which may also provide adequate
levels of accuracy without the required number of
stators.
• These are often referred to as Non-Blondel
configurations.
54. Slide 54
THREE PHASE POWER
BLONDEL’S THEOREM
Why are Non-Blondel circuits challenging?
• Makes the assumption that the service voltages
are balanced.
• The assumption may not be true so there are
likely to be measurement errors.
55. Slide 55
THREE PHASE POWER
BLONDEL’S THEOREM
Why are Non-Blondel meters used?
• Fewer elements in the meter means lower meter
costs.
• Fewer PTs and CTs mean lower installation costs.
58. Slide 58
BLONDEL’S THEOREM
Three wires
Two voltage measurements with one
side common to Line 2
Current measurements on lines 1 & 3.
This satisfies Blondel’s Theorem.
59. Slide 59
BLONDEL’S THEOREM
Four wires
Two voltage measurements to neutral
Current measurements are on lines 1
and 3 but not line 2.
This DOES NOT satisfy Blondel’s
Theorem.
62. Slide 62
BLONDEL’S THEOREM
• Phase B power would be:
P = VbIbCosθ
• But we aren’t measuring Vb
• What we are measuring is:
IbVaCos(60- θ) + IbVcCos(60+ θ)
64. Slide 64
BLONDEL’S THEOREM
• If Va ≠ Vb ≠ Vc then the error is
• %Error =
-Ib{(Va+Vc)/(2Vb) - (Va-Vc) 0.866Sin(θ)/(VbCos(θ))
How big is this in reality? If
Va=117, Vb=120, Vc=119, PF=1 then E=-1.67%
Va=117, Vb=116, Vc=119, PF=.866 then E=-1.67%
65. Slide 65
AC THEORY – POWER
• Power is defined as: P = VI
• Since the voltage and current at every point
in time for an AC signal is different, we have
to distinguish between instantaneous power
and average power.
• Generally when we say “power” we mean
average power.
• Average power is only defined over an
integer number of cycles.
66. Slide 66
HARMONICS
CURSE OF THE MODERN WORLD
• Every thing discussed so far was based on
“Linear” loads.
For linear loads the current is always a simple sine
wave. Everything we have discussed is true.
• For nearly a century after AC power was in
use ALL loads were linear.
• Today, many loads are NON-LINEAR.
67. Slide 67
HARMONICS - DEFINITION
• Non-sinusoidal complex waveforms are constructed by
“adding” together a series of sine wave frequencies
known as “Harmonics.”
• Harmonics is the generalized term used to describe the
distortion of a sinusoidal waveform by waveforms of
different frequencies.
68. Slide 68
Eq.# Quantity Phase A
1 V(rms) (Direct Sum) 100
2 I(rms) (Direct Sum) 108
3 V(rms) (Fourier) 100
4 I(rms) (Fourier) 108
5 Pa = (∫ V(t)I(t)dt) 10000
6 Pb = ½∑VnIncos(θ) 10000
7 Q = ½∑VnInsin(θ) 0.000
8 Sa = Sqrt(P^2 +Q^2) 10000
9 Sb = Vrms*Irms(DS) 10833
10 Sc = Vrms*Irms(F) 10833
13 PF = Pa/Sa 1.000
14 PF = Pb/Sb 0.923
15 PF = Pb/Sc 0.923
Six Pole Motor
-250
-200
-150
-100
-50
0
50
100
150
200
250
0 60 120 180 240 300 360
-45000
-35000
-25000
-15000
-5000
5000
15000
25000
35000
Pa Voltage
Pa Current
Pa Power
Pa VAR
HARMONIC LOAD WAVEFORM
V = 100Sin(ωt) I = 100Sin(ωt) + 42Sin(5 ωt)
69. Slide 69
HARMONIC LOAD WAVEFORM
Eq.# Quantity Phase A
1 V(rms) (Direct Sum) 100
2 I(rms) (Direct Sum) 108
3 V(rms) (Fourier) 100
4 I(rms) (Fourier) 108
5 Pa = (∫ V(t)I(t)dt) 10000
6 Pb = ½∑VnIncos(θ) 10000
7 Q = ½∑VnInsin(θ) 0.000
8 Sa = Sqrt(P^2 +Q^2) 10000
9 Sb = Vrms*Irms(DS) 10833
10 Sc = Vrms*Irms(F) 10833
13 PF = Pa/Sa 1.000
14 PF = Pb/Sb 0.923
15 PF = Pb/Sc 0.923
Important things to note:
Because the voltage is NOT
distorted, the harmonic in the
current does not contribute to active
power.
It does contribute to the Apparent
power.
Does the Power Triangle hold
There is considerable disagreement
about the definition of various power
quantities when harmonics are
present.
V = 100Sin(ωt) I = 100Sin(ωt) + 42Sin(5 ωt)
22
? QPS
70. Slide 70
3 PHASE POWER MEASUREMENT
• We have discussed how to measure and view power
quantities (W, VARs, VA) in a single phase case.
• How do we combine them in a multi-phase system?
• Two common approaches:
Arithmetic
Vectorial
71. Slide 71
3 PHASE POWER MEASUREMENT
Arithmetic vs Vectoral
• Both a magnitude and a direction must be specified for
a vector quantity.
• In contrast, a scalar quantity which can be quantified
with just a number.
• Any number of vector quantities of the same type (i.e.,
same units) can be combined by basic vector
operations.
72. Slide 72
3 PHASE POWER MEASUREMENT
VAR and VA calculations can lead to some
strange results:
If we define
PH W Q VA
A 100 0 100
B 120 55 132
C 120 -55 132
Arithmetic VA 364
Vector VA 340
22
)()( CBACBA QQQWWWVA
Arithmetic VA VS I
Vector VA SPQ
73. Slide 73
3 PHASE POWER MEASUREMENT
Arithmetic Calculation - Form 6 – 4 Wire Y Site
Voltages and Currents Aligned at 0°
74. Slide 74
3 PHASE POWER MEASUREMENT
Vector Calculation - Form 6 – 4 Wire Y Site
Voltages and Currents Aligned at 0°
75. Slide 75
3 PHASE POWER MEASUREMENT
Arithmetic Calculation - Form 6 – 4 Wire Y Site
Currents All shifted by 30°
76. Slide 76
3 PHASE POWER MEASUREMENT
Vector Calculation - Form 6 – 4 Wire Y Site
Currents All shifted by 30°
78. Slide 78 Phase B & C reversed!
Actual Field Test Case #1: Lots of Clues!
79. Slide 79
What is the problem?There is no problem!
3-Wire Delta load
On a 4-Wire Wye service.
Actual Field Test Case #2
80. Slide 80
STANDARDS CHANGES
New Revision of C12.20 in 2015
Polyphase meters tested using polyphase
Recommended 2015, required 2020
Unbalanced load testing required
Full harmonic testing required
0.1% Accuracy Class added
Specific call out of Non-Blondel applications where C12.20 does not
apply
Detailed requirements and specs for test outputs added
81. Slide 81
STANDARDS CHANGES
New Revision of C12.20 in 2015
Tighter reference condition performance specifications
When using polyphase loading meters must be tested in each
configuration used
82. Slide 82
STANDARDS CHANGES
New Revision of C12.1 in 2015
0.5% Accuracy Class added
Testing required for unbalanced loads
Testing required under unbalanced conditions
Tighter reference performance requirements
Bi-directional energy flow testing
Extensive update on in-service testing
83. Slide 83
STANDARDS CHANGES
New Revision of C12.10 in 2015
Accuracy tests moved here from C12.1
Much broader safety requirements
Coordinated effort with UL2735
Utilities exempt from UL2735 but only if they own and install the
equipment
84. Slide 84
STANDARDS CHANGES
New Revision of C12.9 in 2014
Full specifications for test plugs included in standard
Ensures safe operation between all switches and all plugs
previously some combinations produced safety hazards
New barrier requirements between switch elements
85. Slide 85
STANDARDS CHANGES
Communications Standards
New C12.19 which replaces C12.18 and C12.19 is in ballot process
Major changes – major controversy has held up approval for two
years
Standard will still not guarantee inter-operability
C12.23 the “Compliance Testing” standard is nearly complete
86. Slide 86
NEXT GENERATION STANDARDS
ANSI C12.46
New standard in development to replace C12.1 and C12.20
Structured like OIML IR-46
A true digital age standard
Applies to ALL energy measurements
Watts, VA and VAR
Contains precise definitions for the quantities based on digitally
sampled waveforms
87. Slide 87
NEXT GENERATION STANDARDS
ANSI C12.46
Covers ALL waveform types
sinusoidal, harmonic, time varying
Defines the meter as everything under the cover
If there is auxiliary functions in the meter they must be fully
operational during accuracy testing
If a option is added to a meter, it must be tested with the option
running to remain qualified
88. Slide 88
NEXT GENERATION STANDARDS
ANSI C12.46
View of accuracy changes
Currently changes with respect to reference
New approach is absolute error
Philosophy of C12.46 – When a meter is
claimed to be of a specific accuracy class, for
example , AC 0.2%, then it’s accuracy under all
commonly occurring conditions should be within
±0.2% maximum error.
89. Slide 89
NEW ENERGY DEFINITIONS
Time Domain
n iit IV
N
P
1
1
0
21
1
0
21
Ni
i
iN
Ni
i
iN
rmsrmst IVIVVAS
22
PSQt
Active Power
Apparent Power
Reactive Power
90. Slide 90
NEW ENERGY DEFINITIONS
Frequency Domain
n
nnn
n
vnininvn
n
nnf
IV
bbaaIVP
)cos(
)(
2
1
2/1
2222
)()(
2
1
n n
ininvnvnf babaS
n
nnn
n
vnininvn
n
nnf
IV
babaIVQ
)sin(
)(
2
1
Active Power
Apparent Power
Reactive Power
91. Slide 91
WHAT DOES THE FUTURE HOLD?
• Over the next FEW years metering may have a whole new
meaning
• Do these look like meters to you?
92. Slide 92
WHAT DOES THE FUTURE HOLD?
• Each has an embedded revenue meter
• Each claims ANSI C12.1 compliance
METER
93. Slide 93
Questions and Discussion
John Kretzschmar
john@samscometering.com
864-590-2883 (cell)
This presentation can also be found under Meter Conferences and
Schools on the TESCO web site:
www.tesco-advent.com