Downloaded 93 times


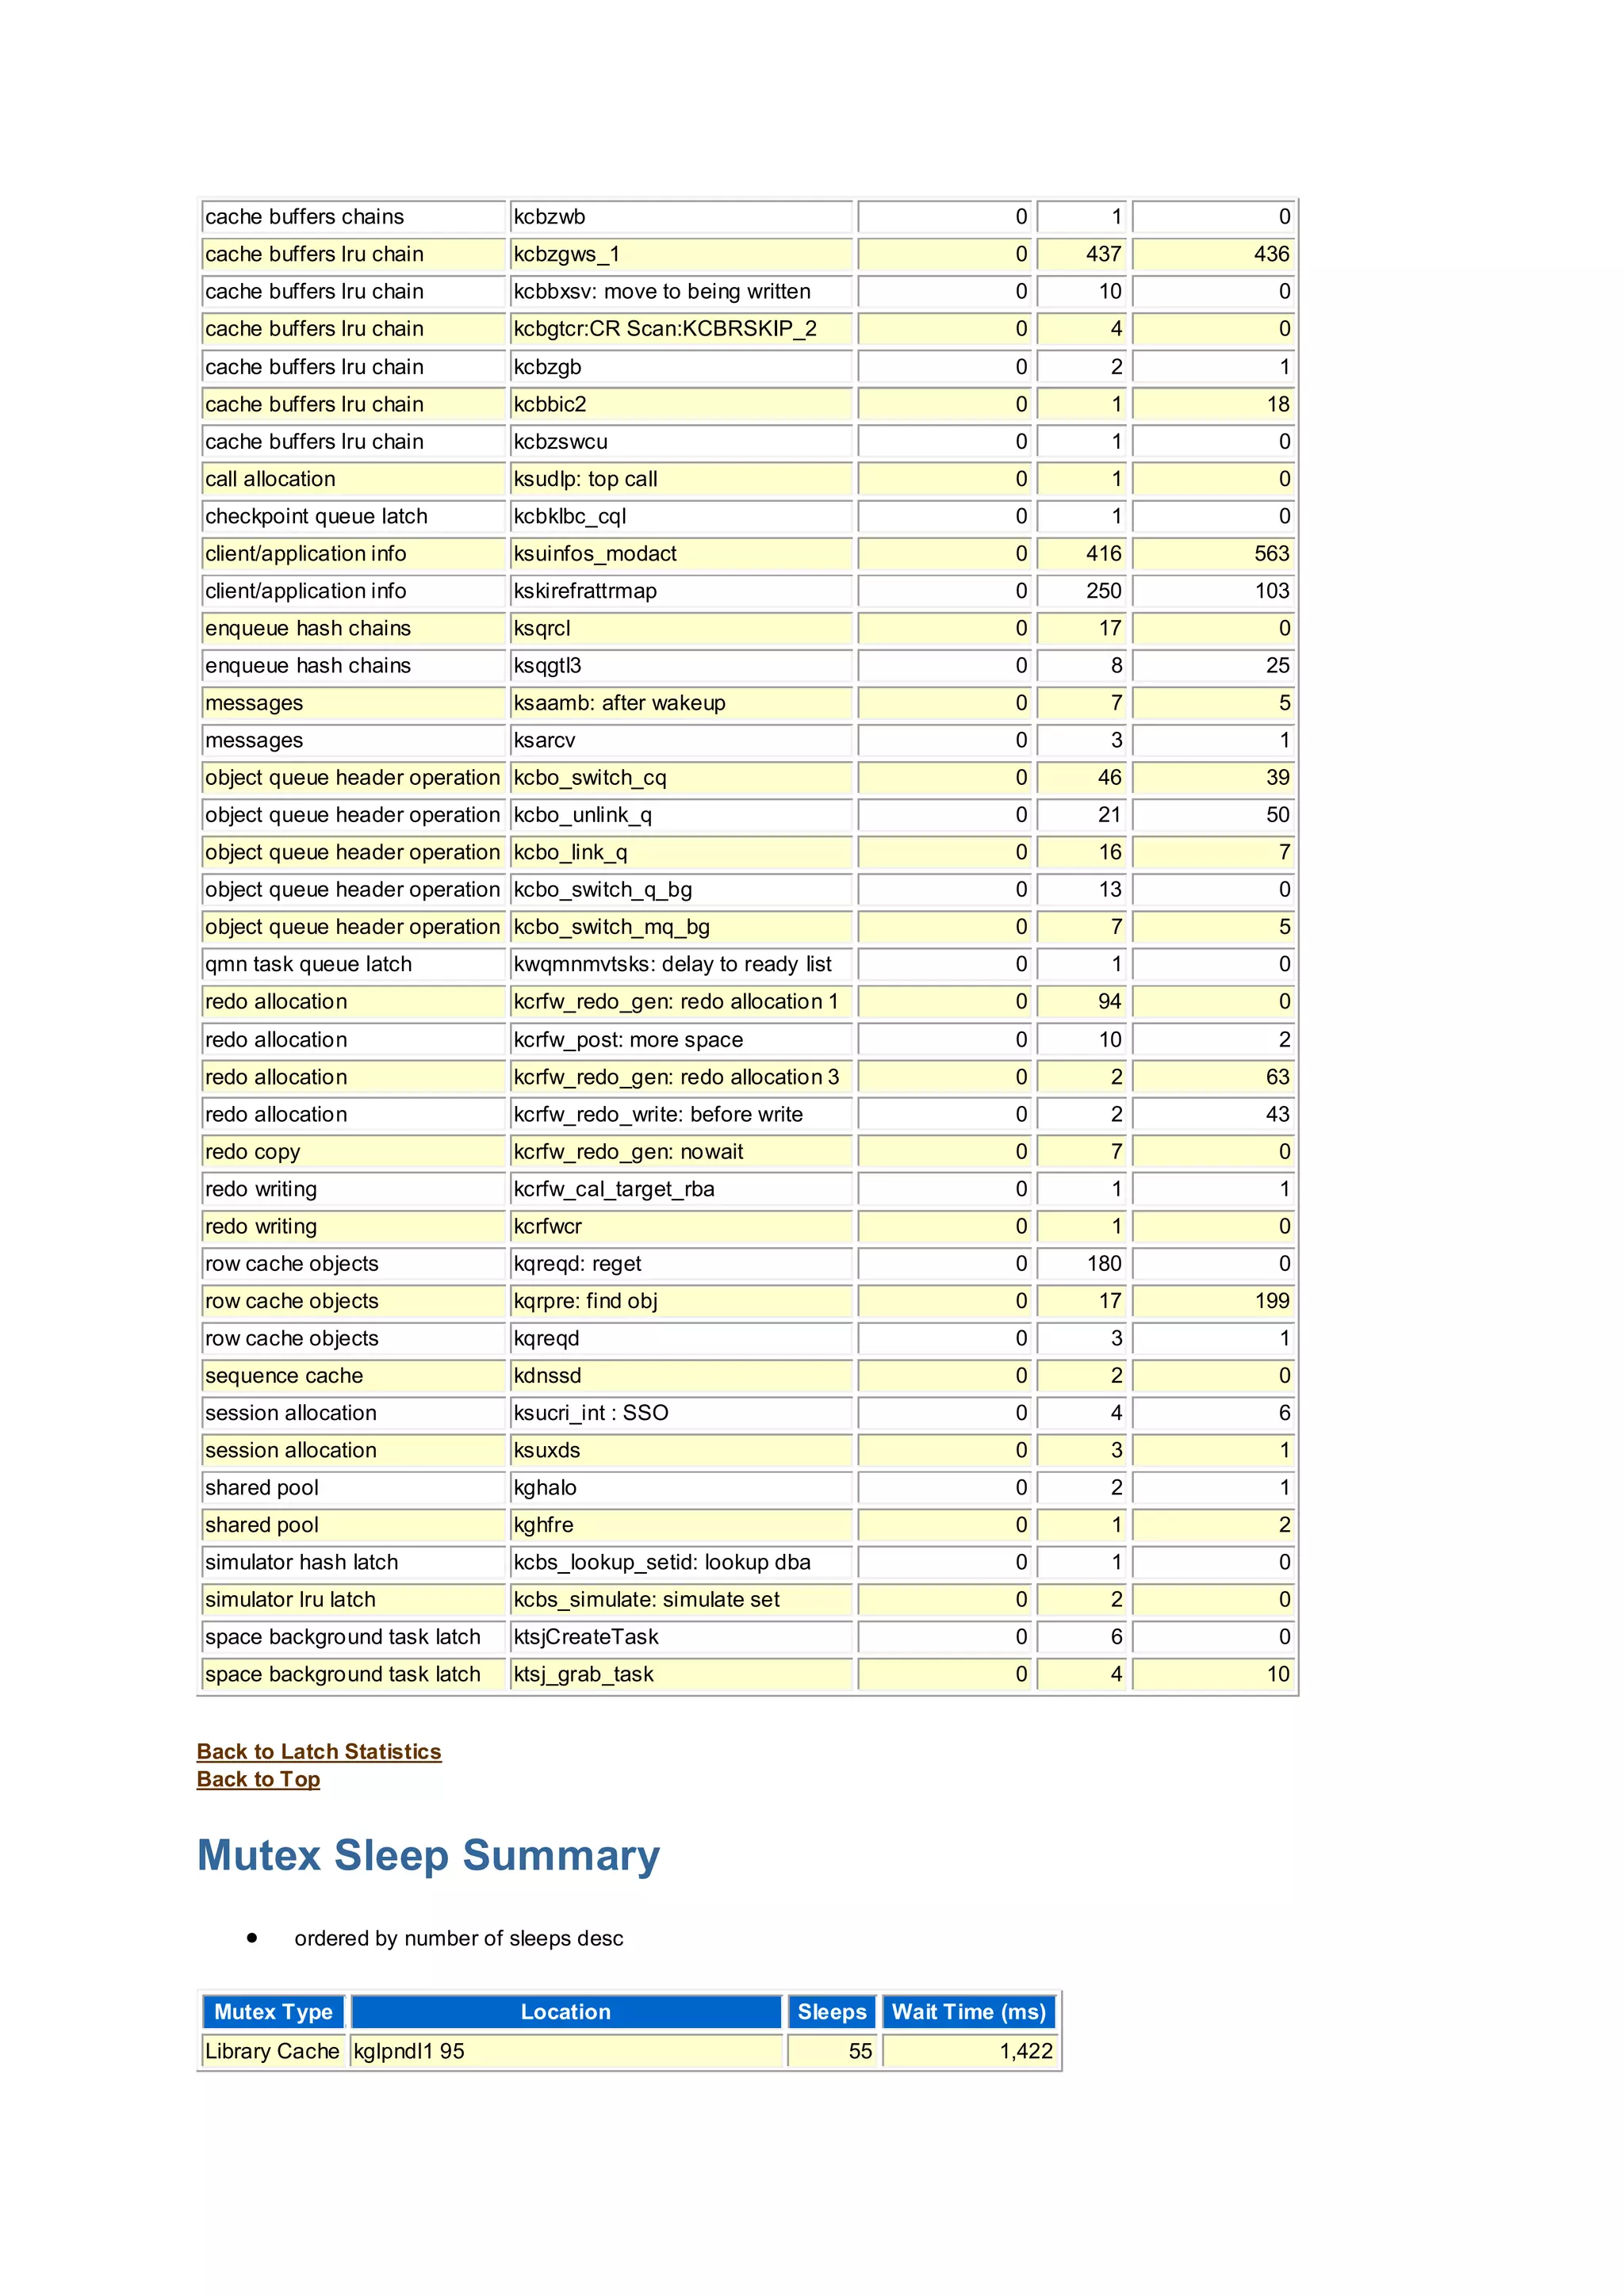
![Library Cache kglpin1 4 53 3,257
Cursor Pin kksfbc [KKSCHLFSP2] 31 775
Library Cache kglhdgn2 106 25 676
Library Cache kglget1 1 10 278
Library Cache kglobpn1 71 6 107
Cursor Stat kkocsStoreBindAwareStats [KKSSTALOC8] 1 10
Back to Latch Statistics
Back to Top
Parent Latch Statistics
No data exists for this section of the report.
Back to Latch Statistics
Back to Top
Child Latch Statistics
No data exists for this section of the report.
Back to Latch Statistics
Back to Top
Segment Statistics
Segments by Logical Reads
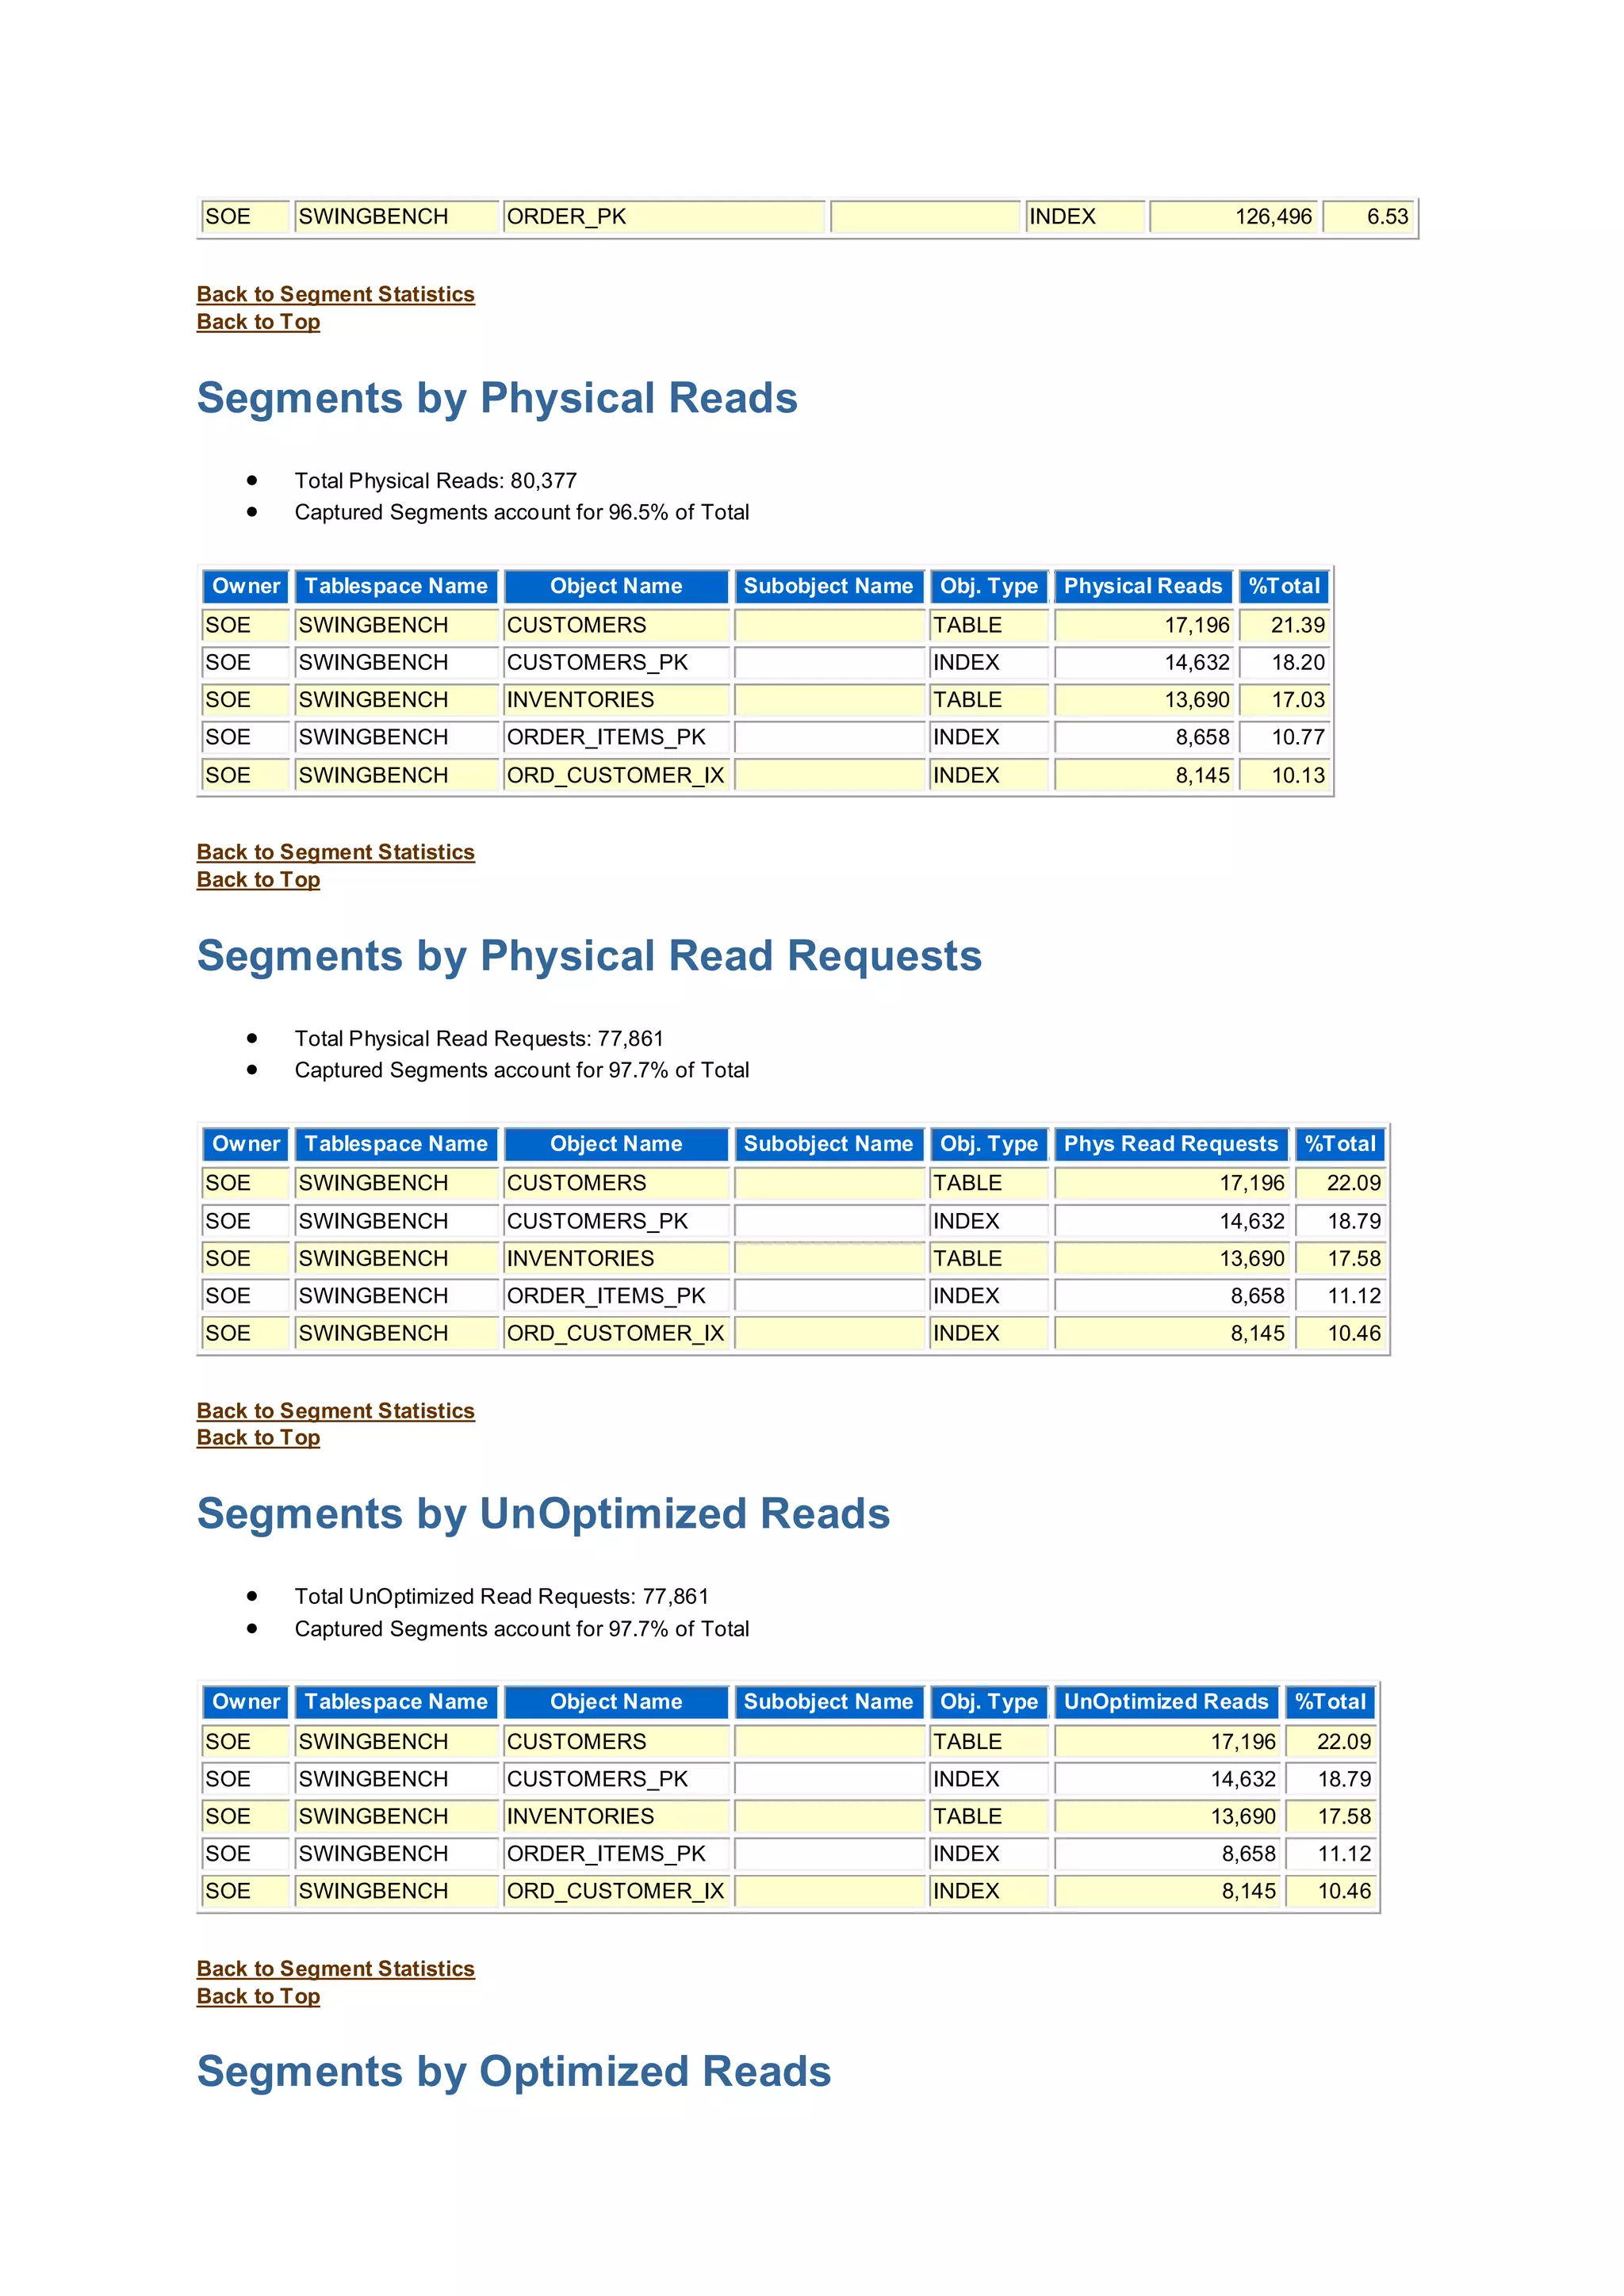
Segments by Physical Reads
Segments by Physical Read Requests
Segments by UnOptimized Reads
Segments by Optimized Reads
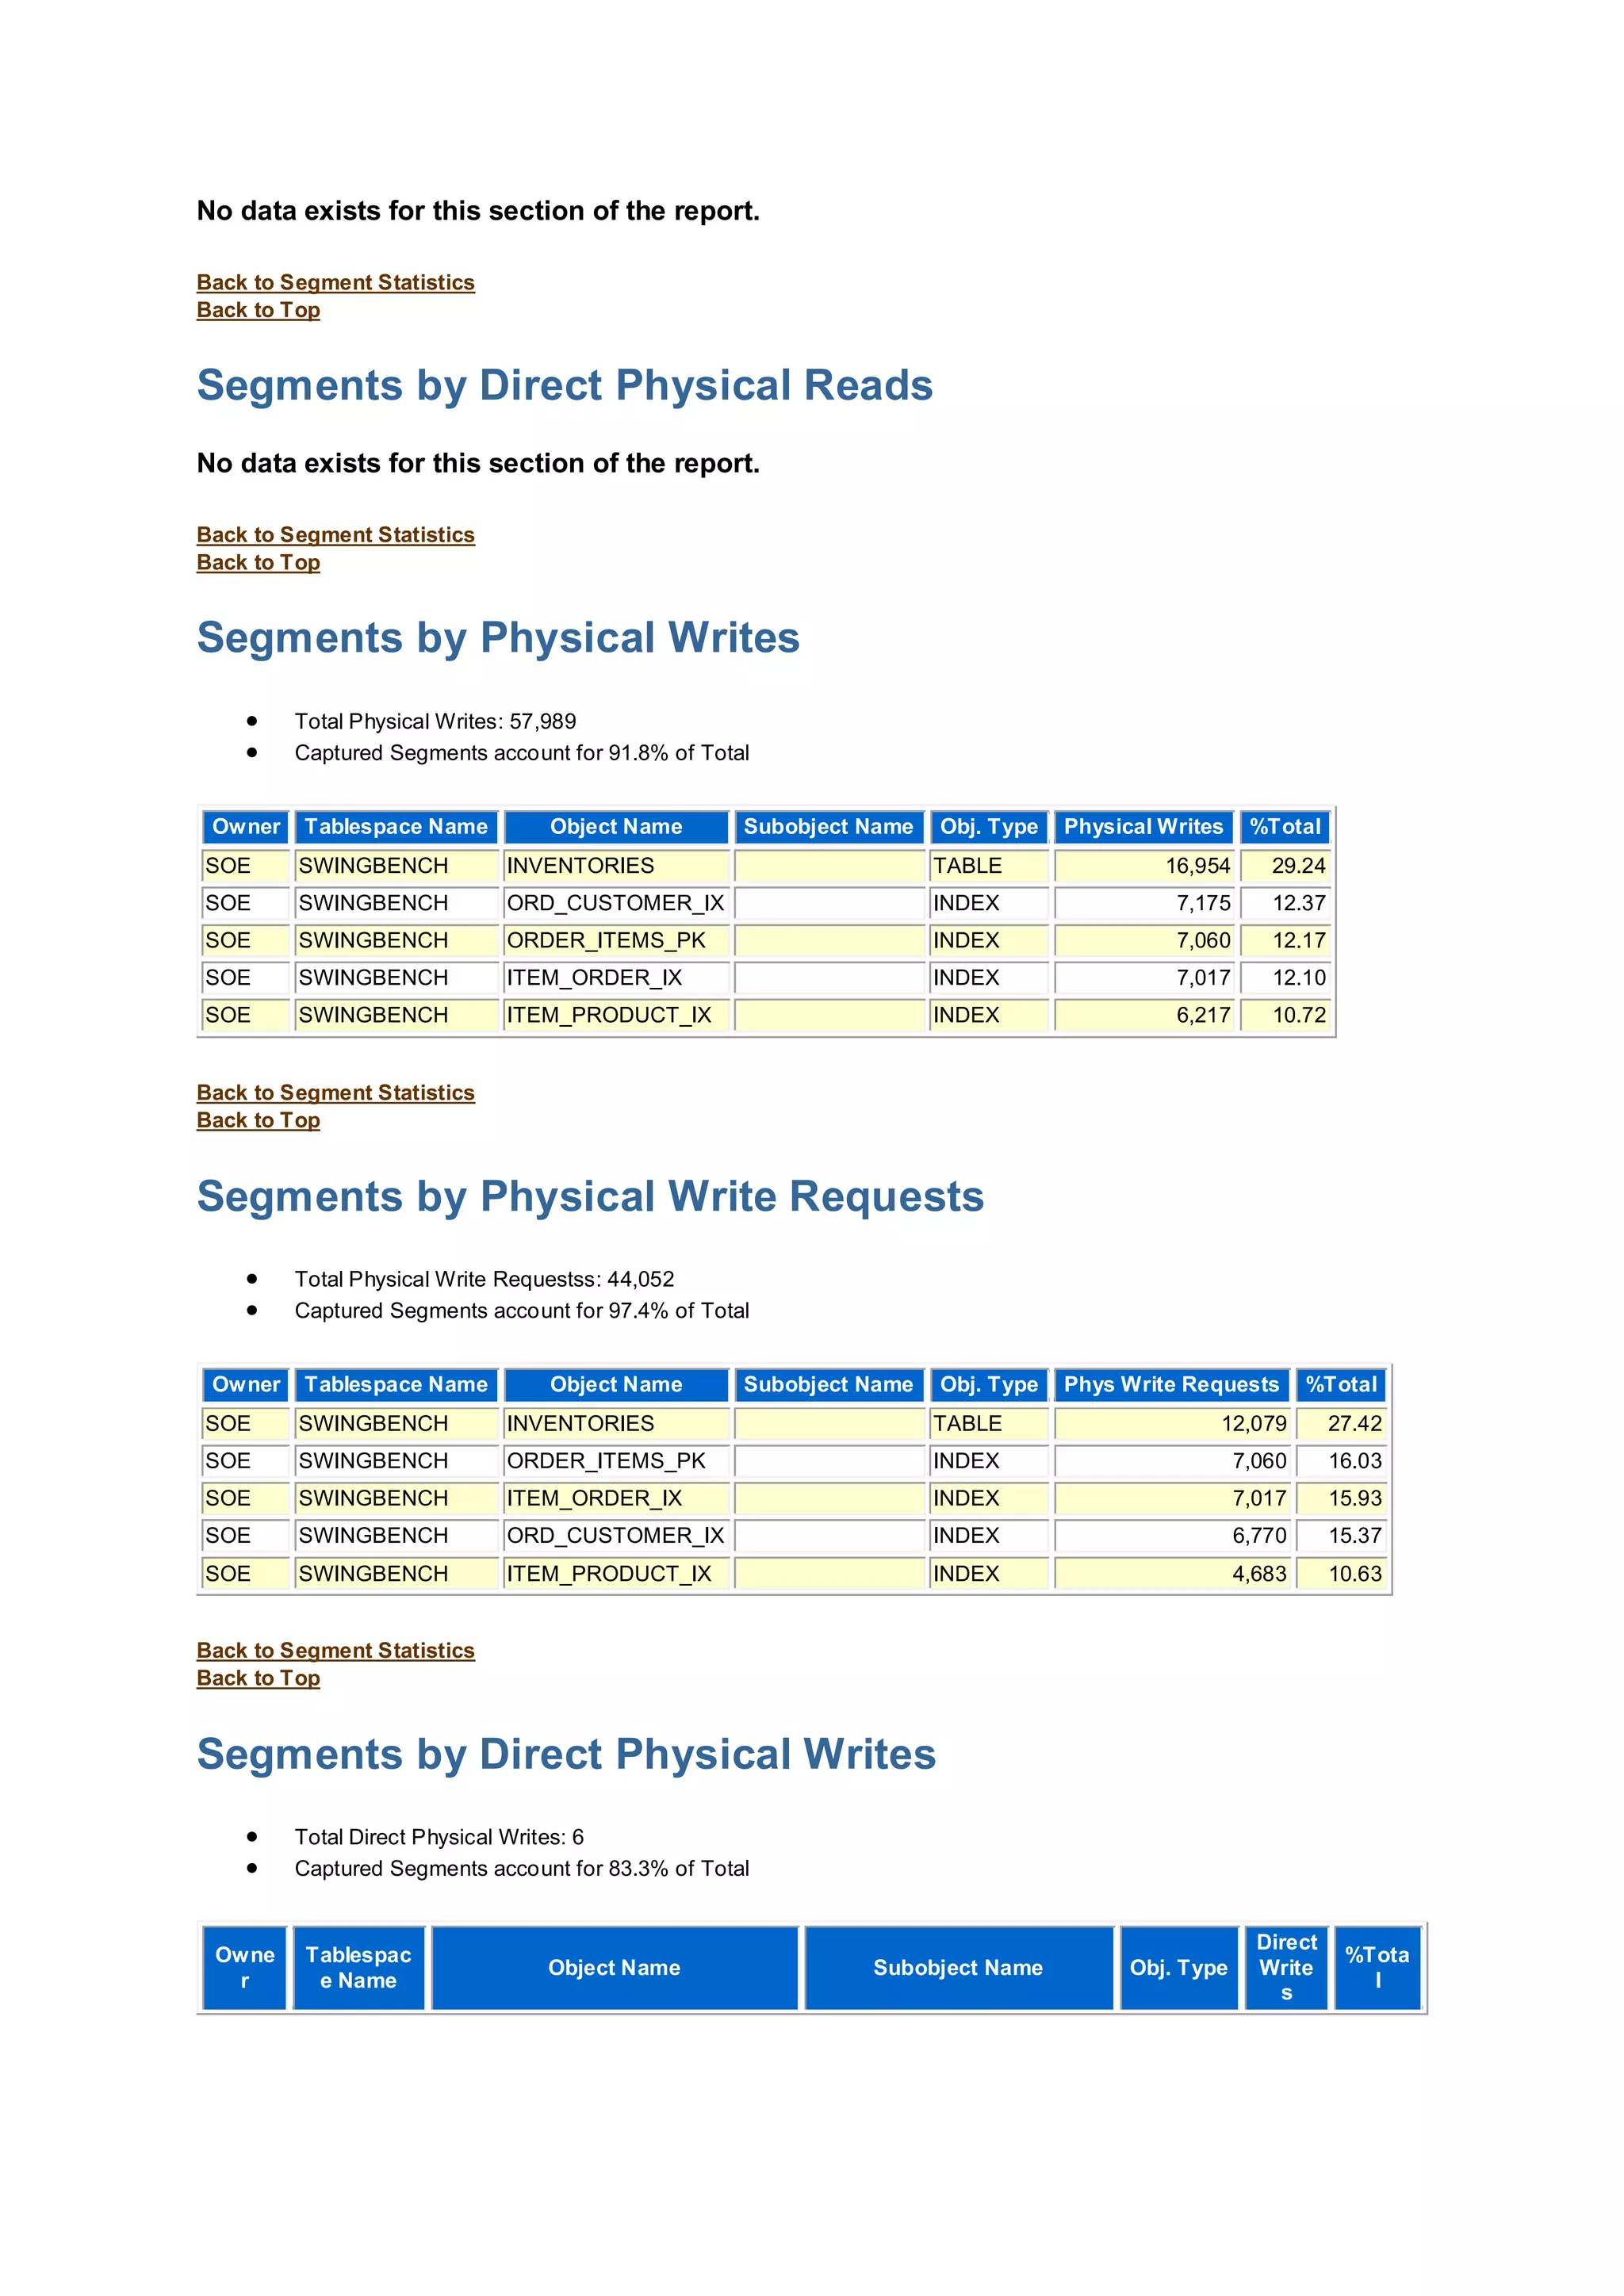
Segments by Direct Physical Reads
Segments by Physical Writes
Segments by Physical Write Requests
Segments by Direct Physical Writes
Segments by Table Scans
Segments by DB Blocks Changes
Segments by Row Lock Waits
Segments by ITL Waits
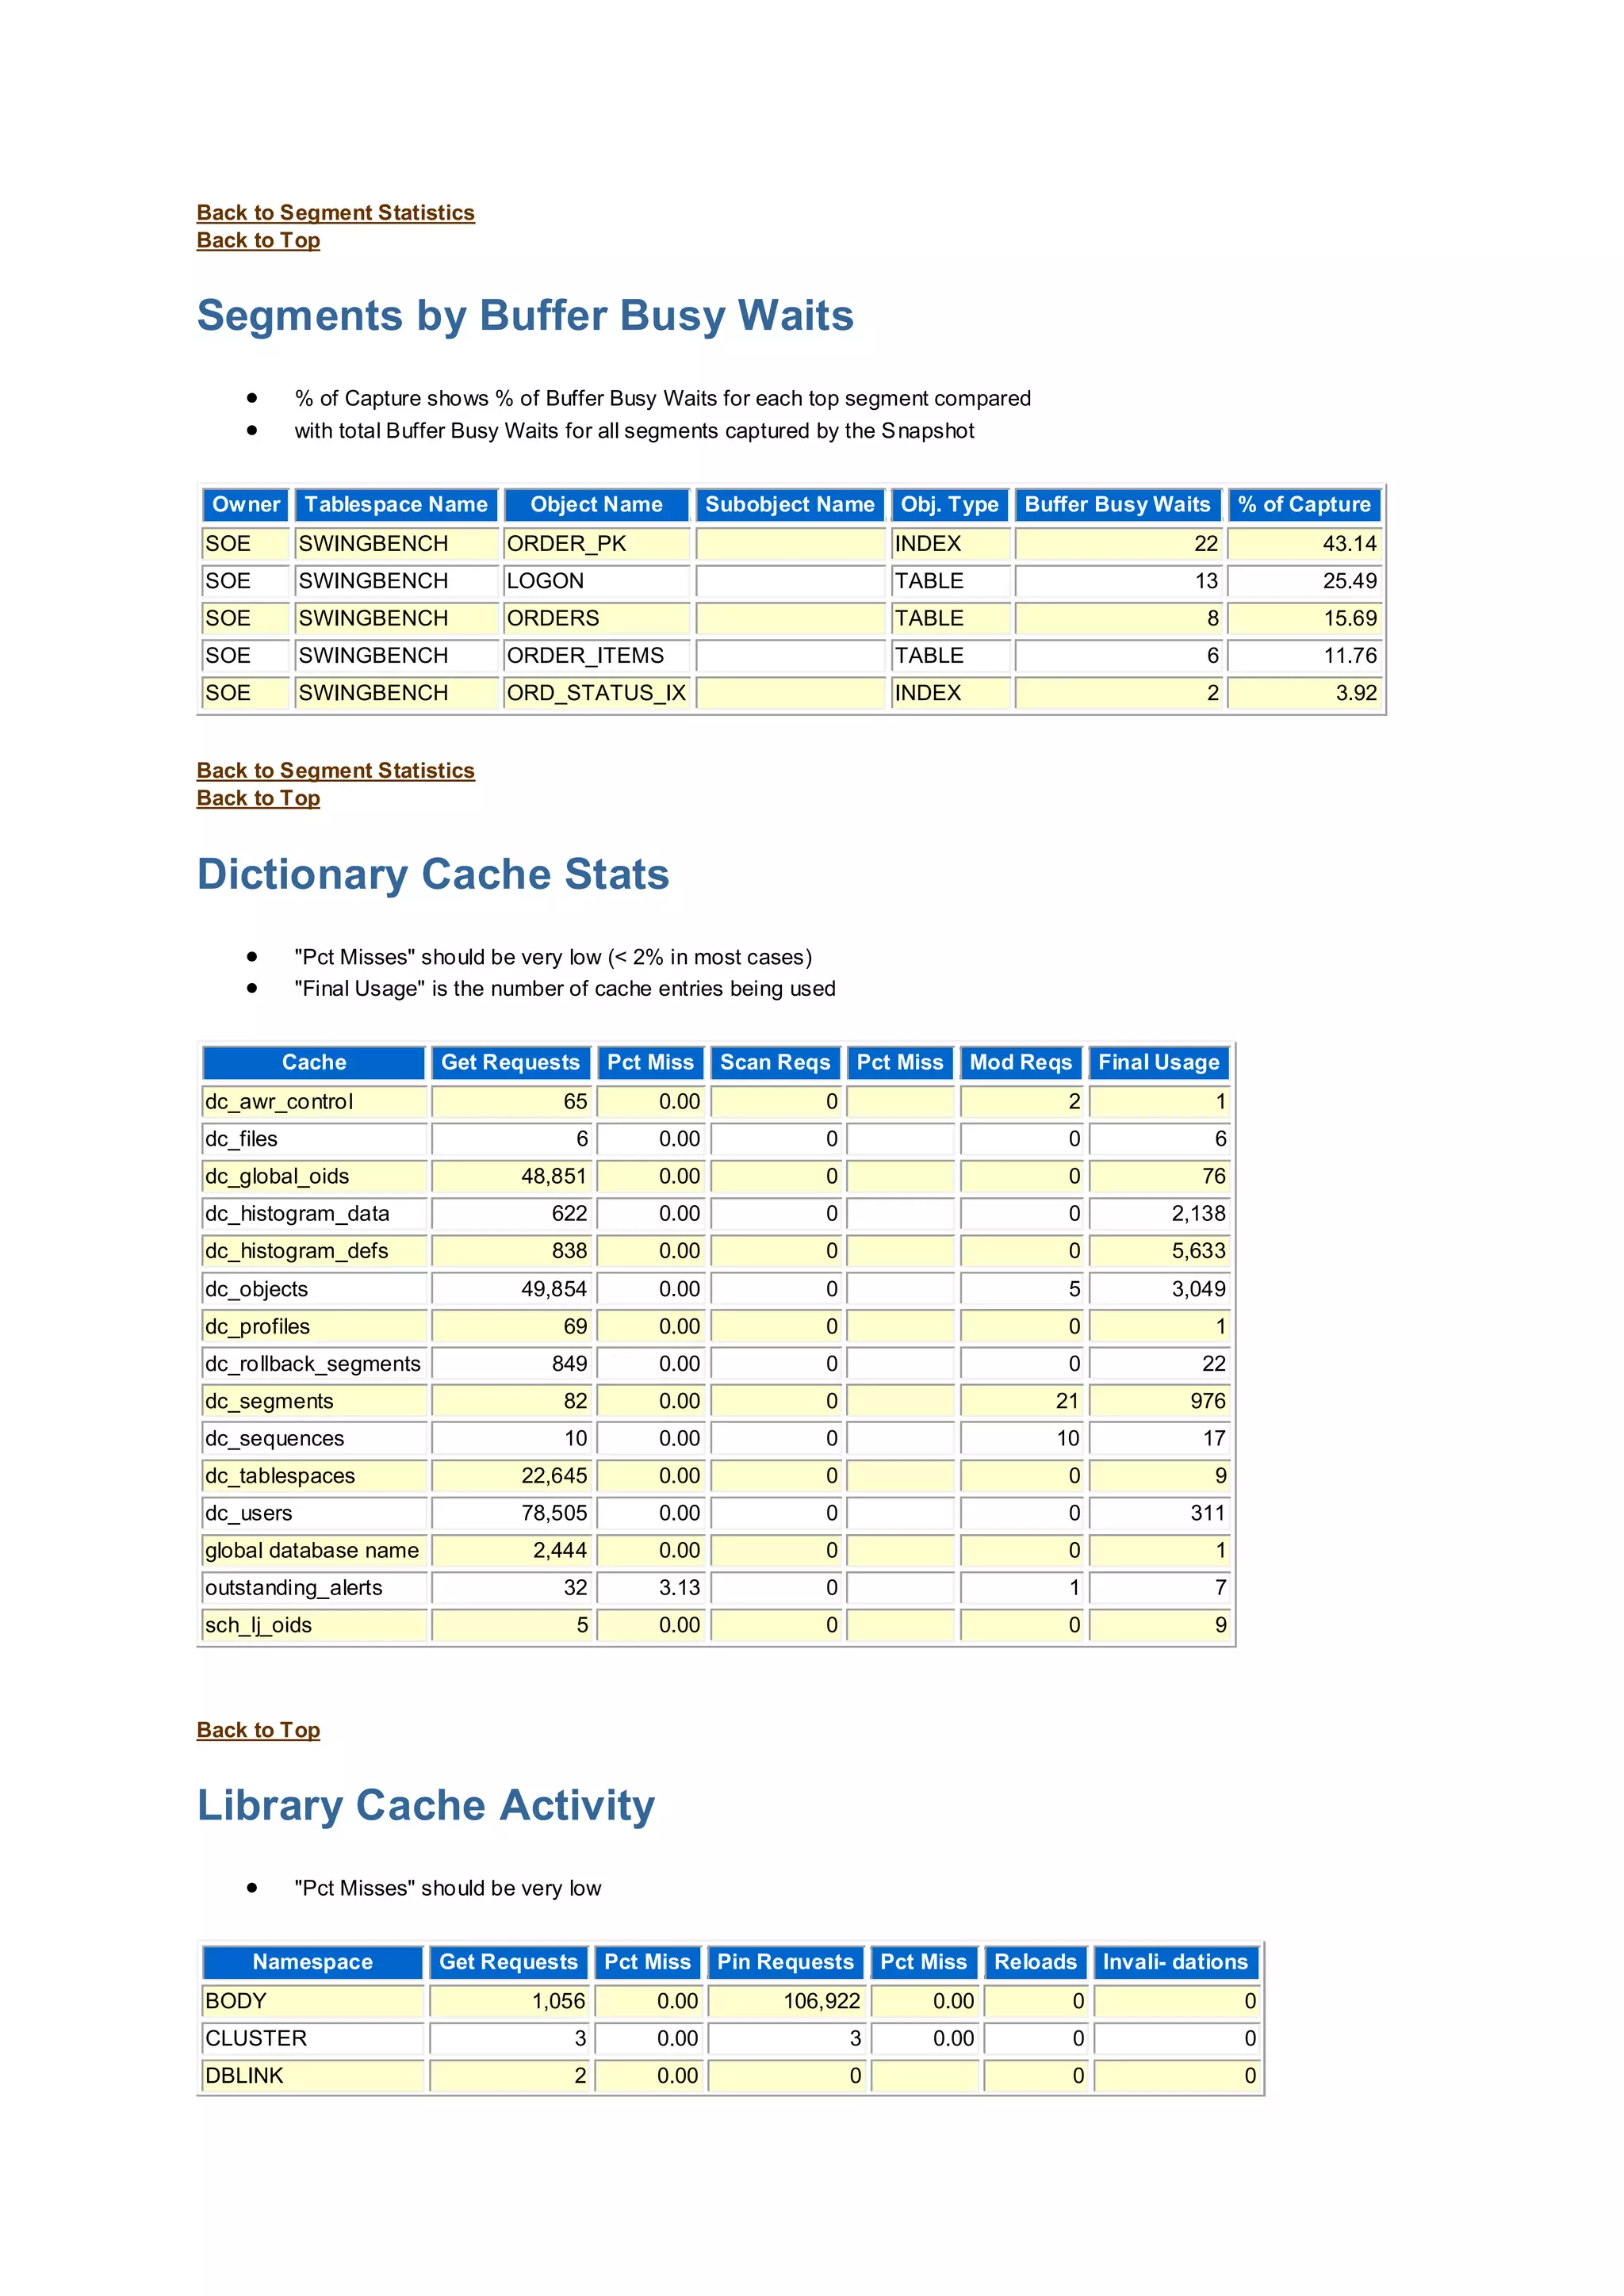
Segments by Buffer Busy Waits
Back to Top
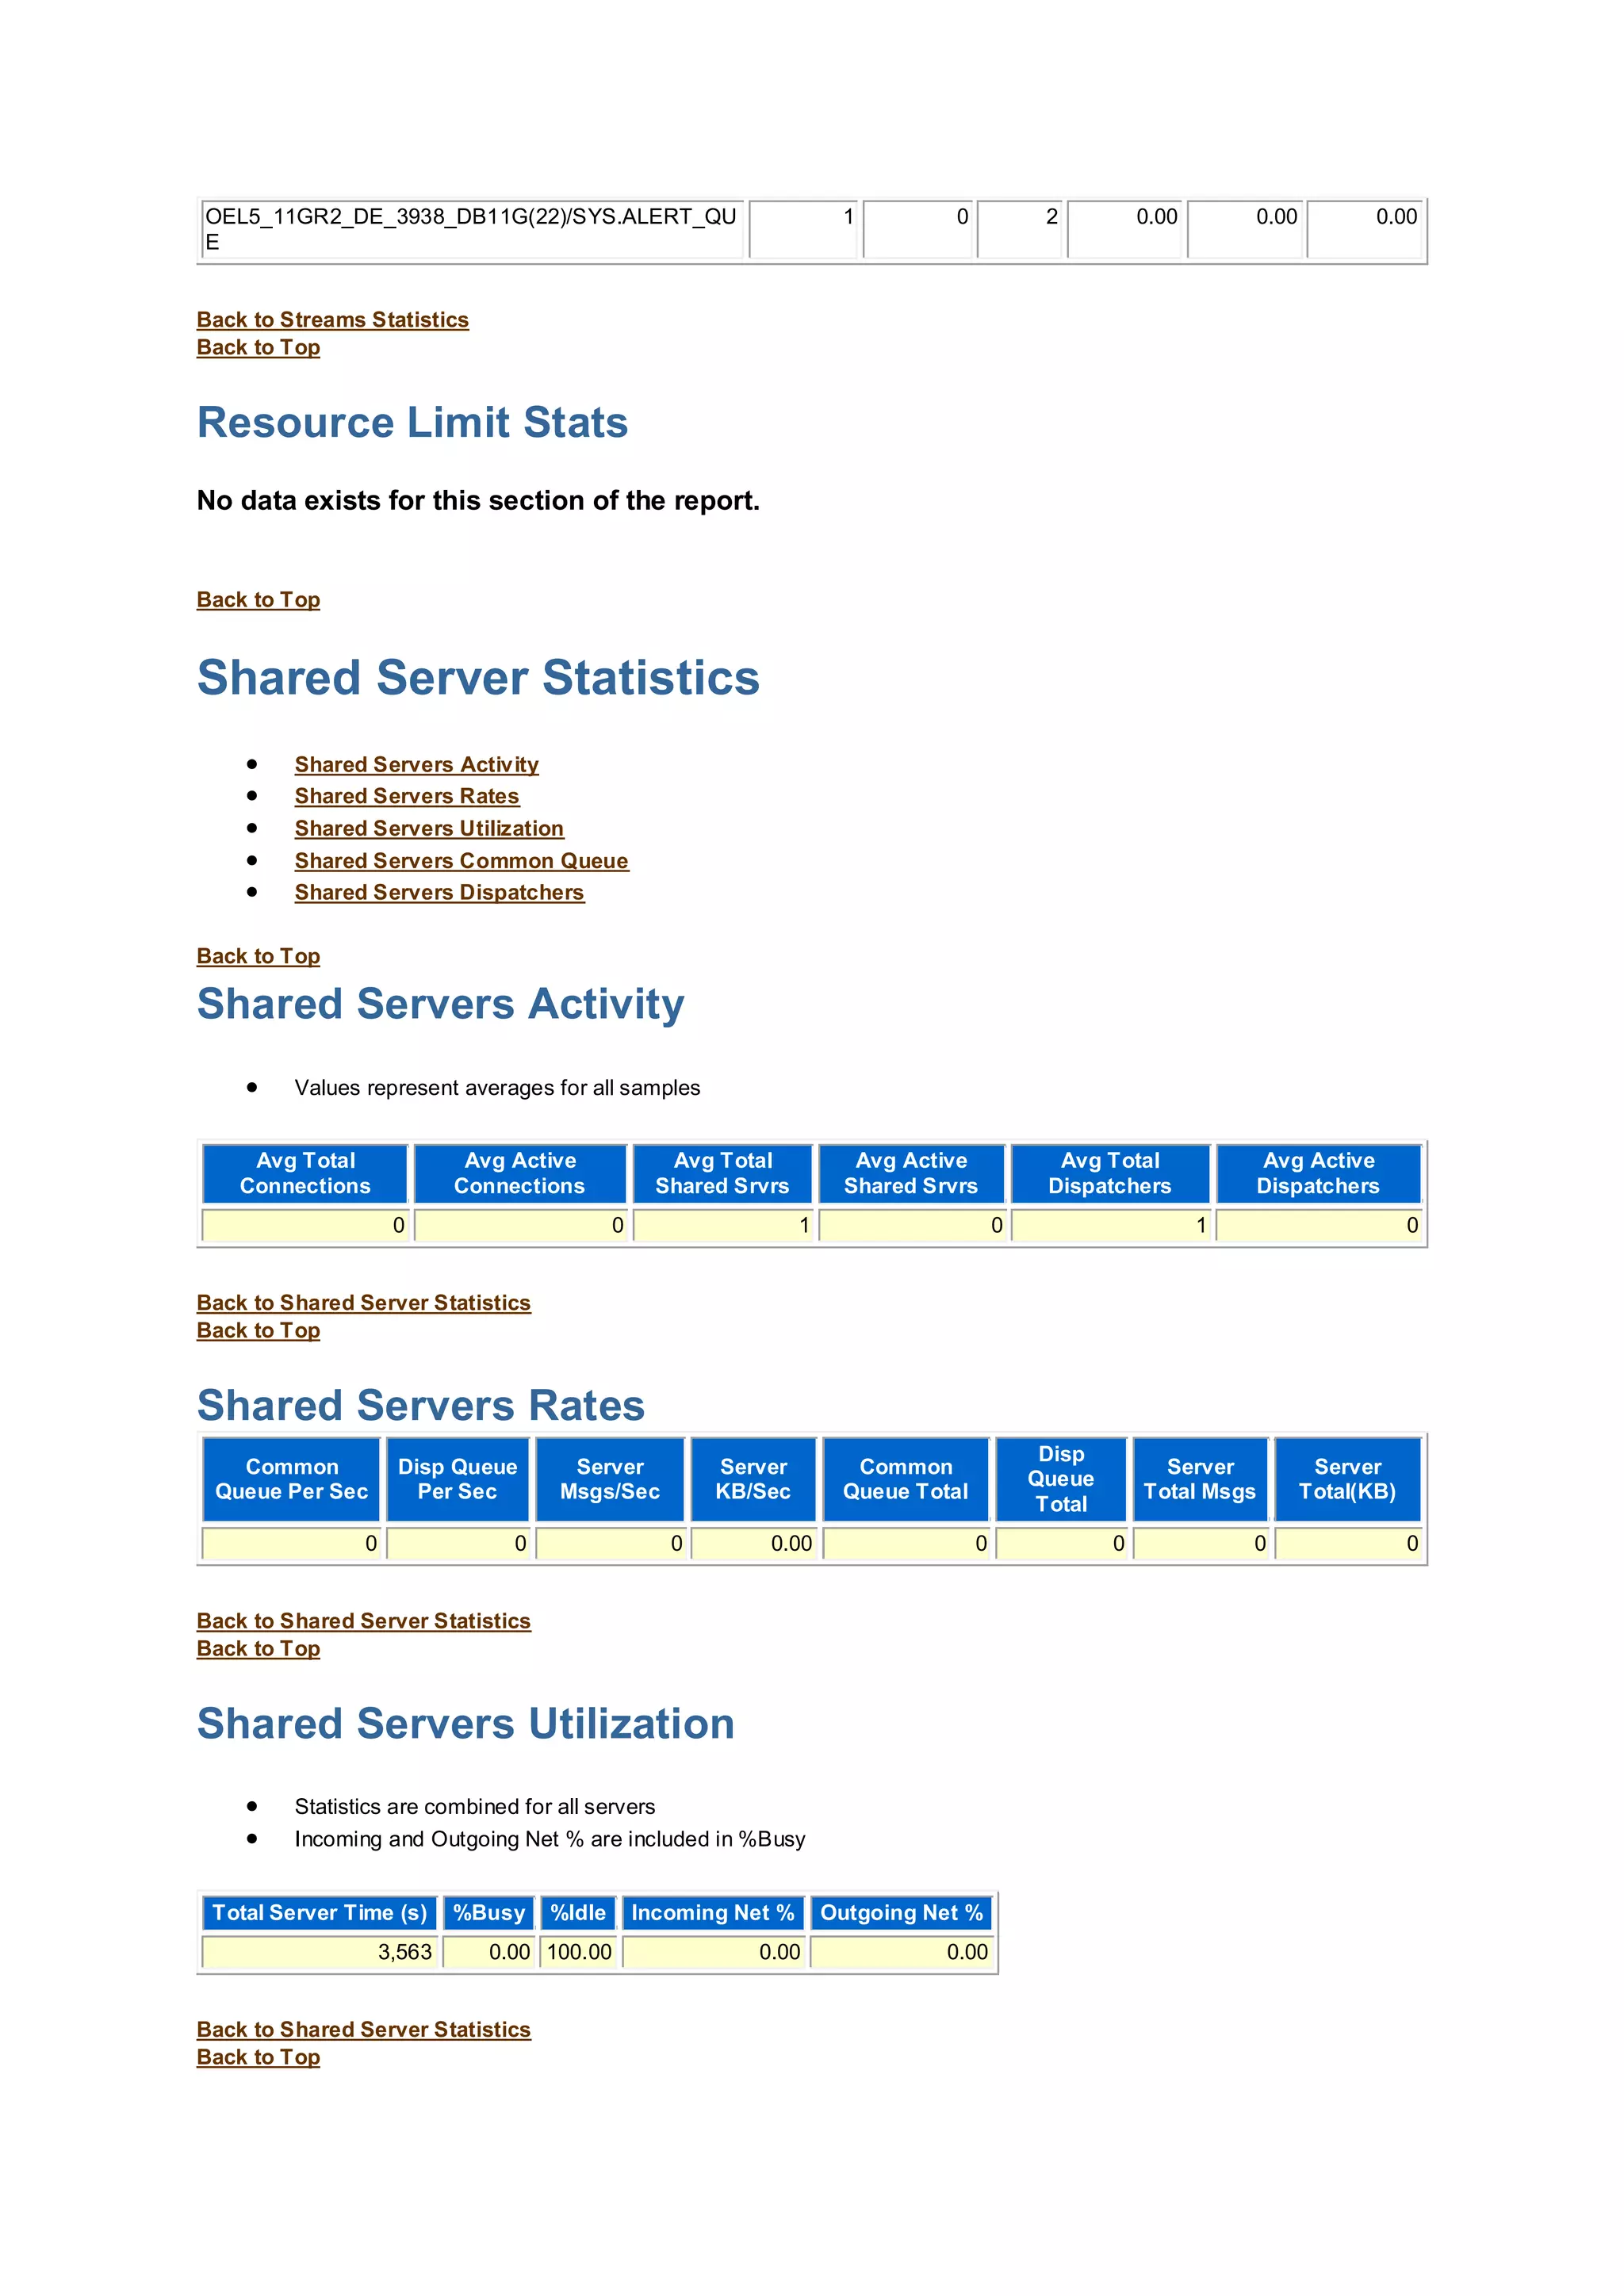
Segments by Logical Reads
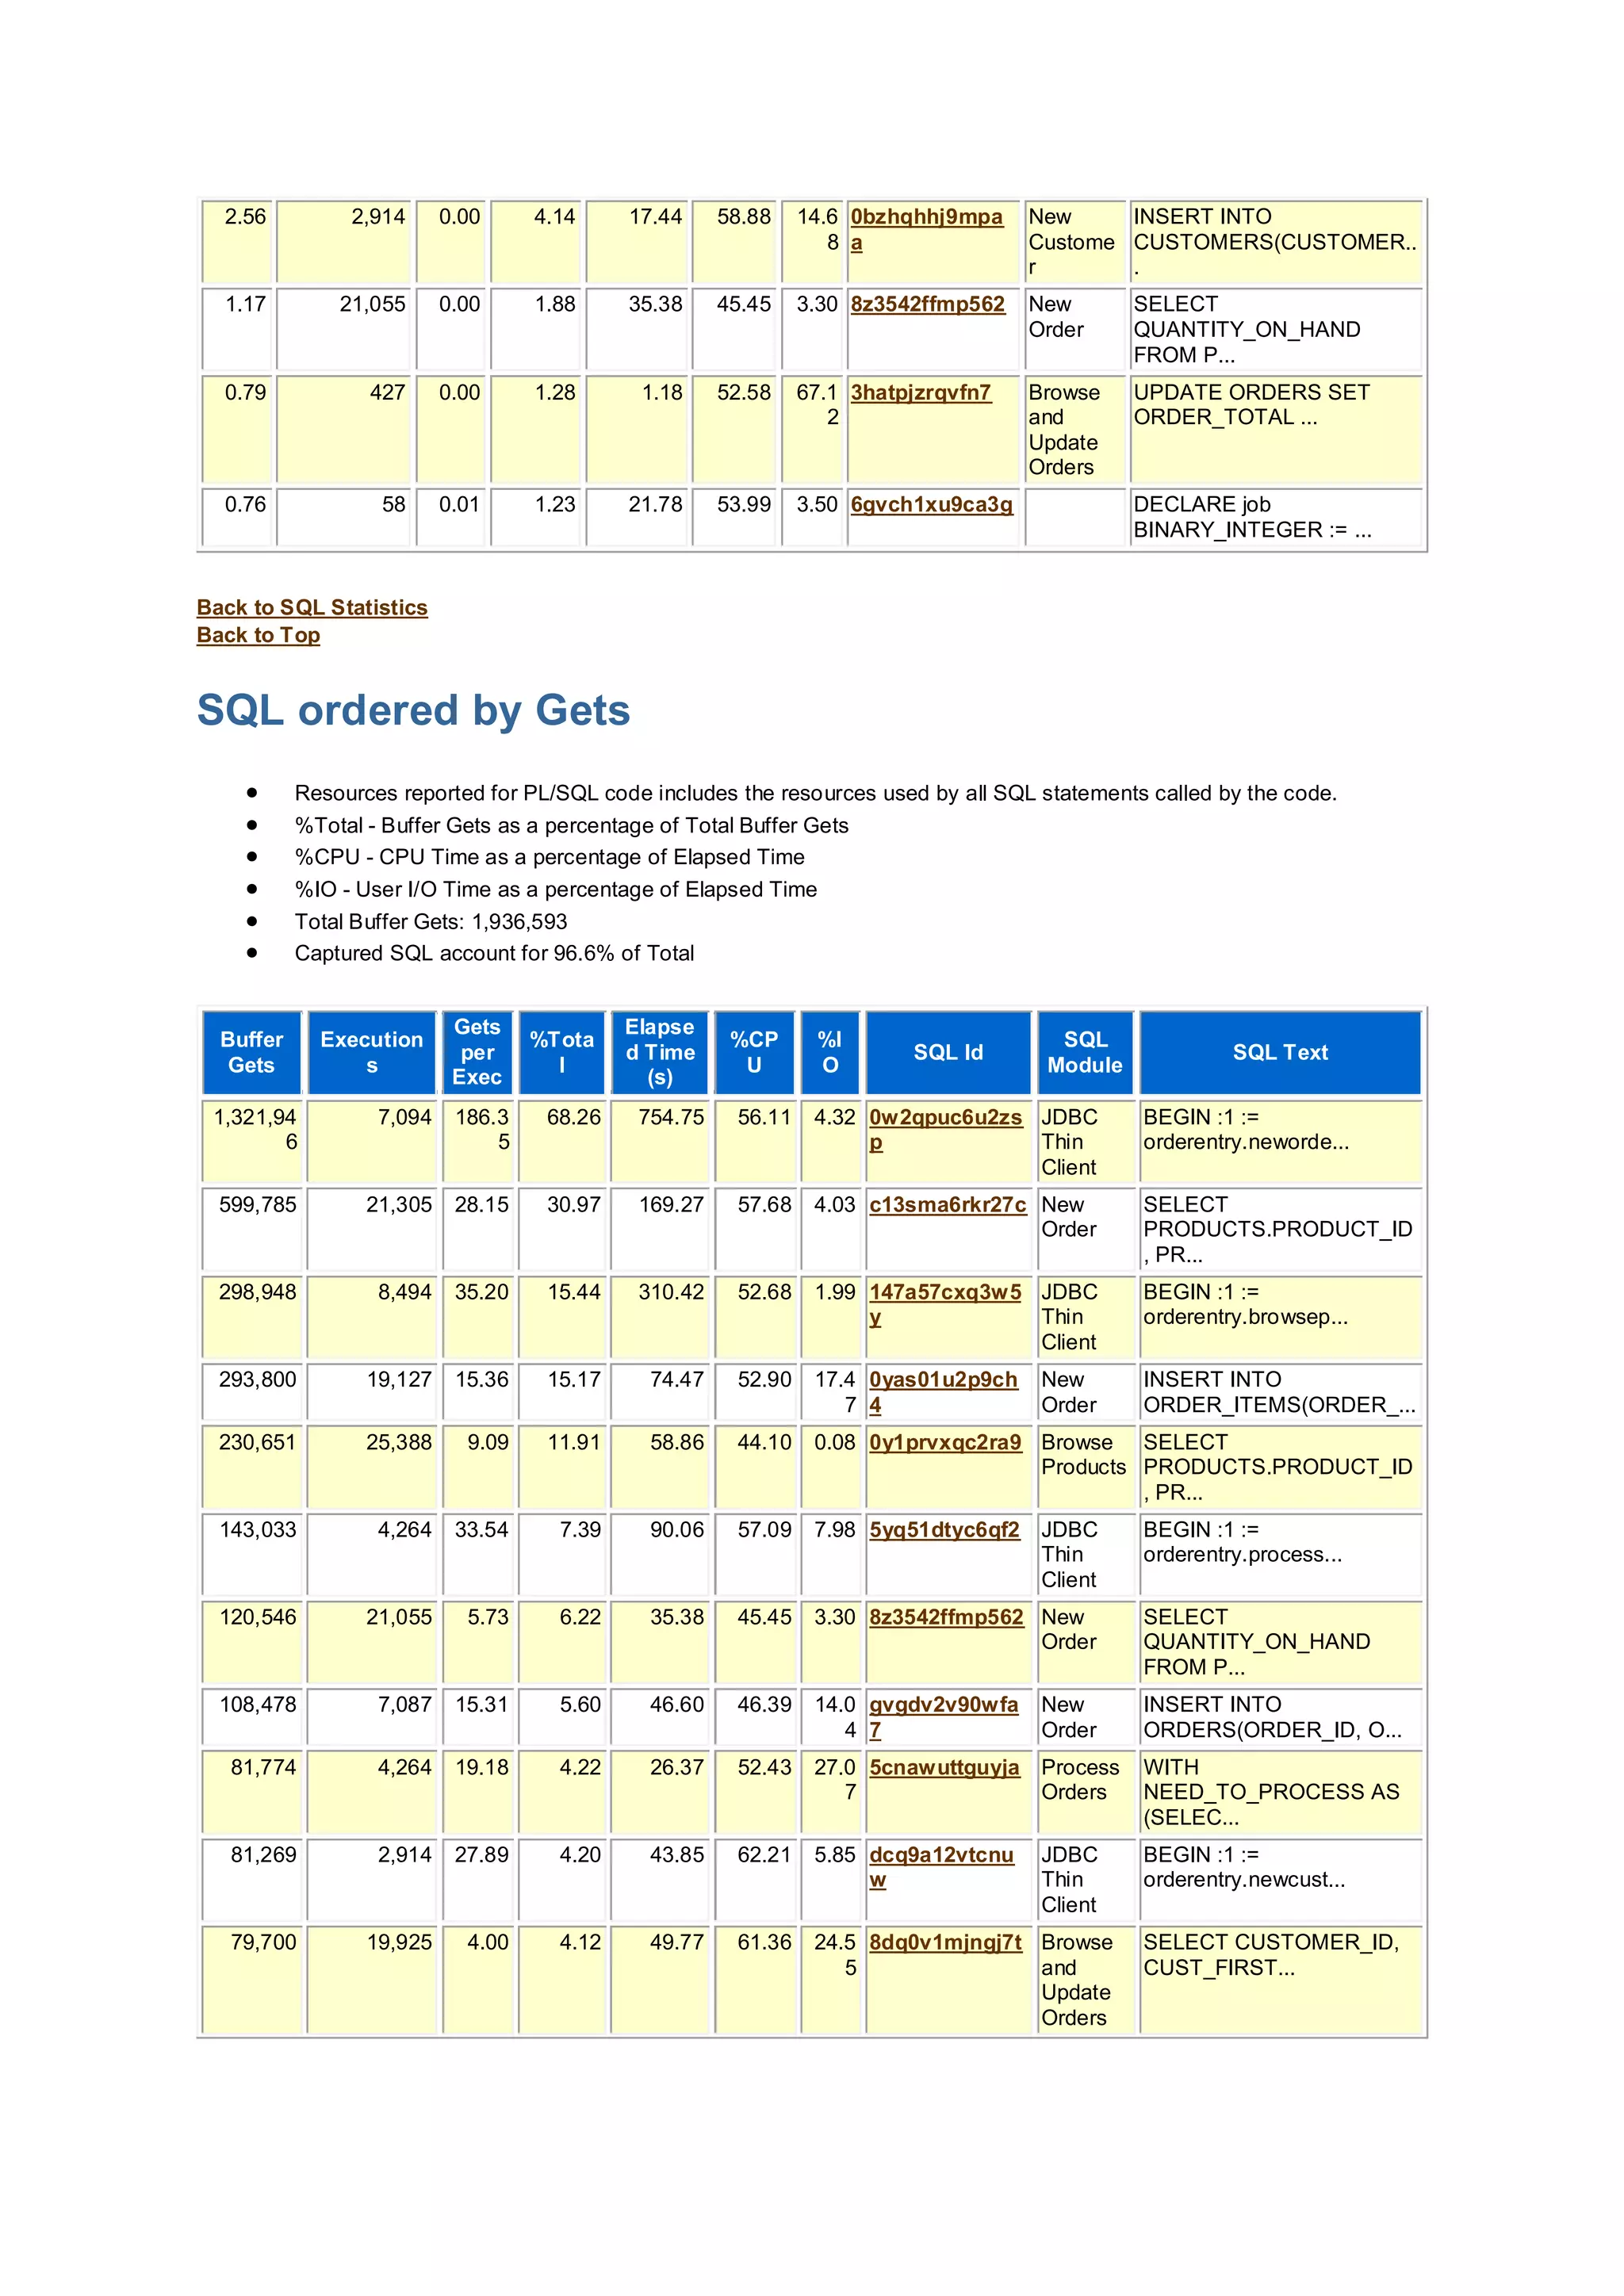
Total Logical Reads: 1,936,593
Captured Segments account for 92.2% of Total
Owner Tablespace Name Object Name Subobject Name Obj. Type Logical Reads %Total
SOE SWINGBENCH INVENTORY_PK INDEX 377,616 19.50
SOE SWINGBENCH INVENTORIES TABLE 163,248 8.43
SOE SWINGBENCH PRD_DESC_PK INDEX 137,568 7.10
SOE SWINGBENCH PRODUCT_INFORMATION_PK INDEX 127,872 6.60](https://image.slidesharecdn.com/awrsamplereport-160322172204/75/AWR-Sample-Report-41-2048.jpg)


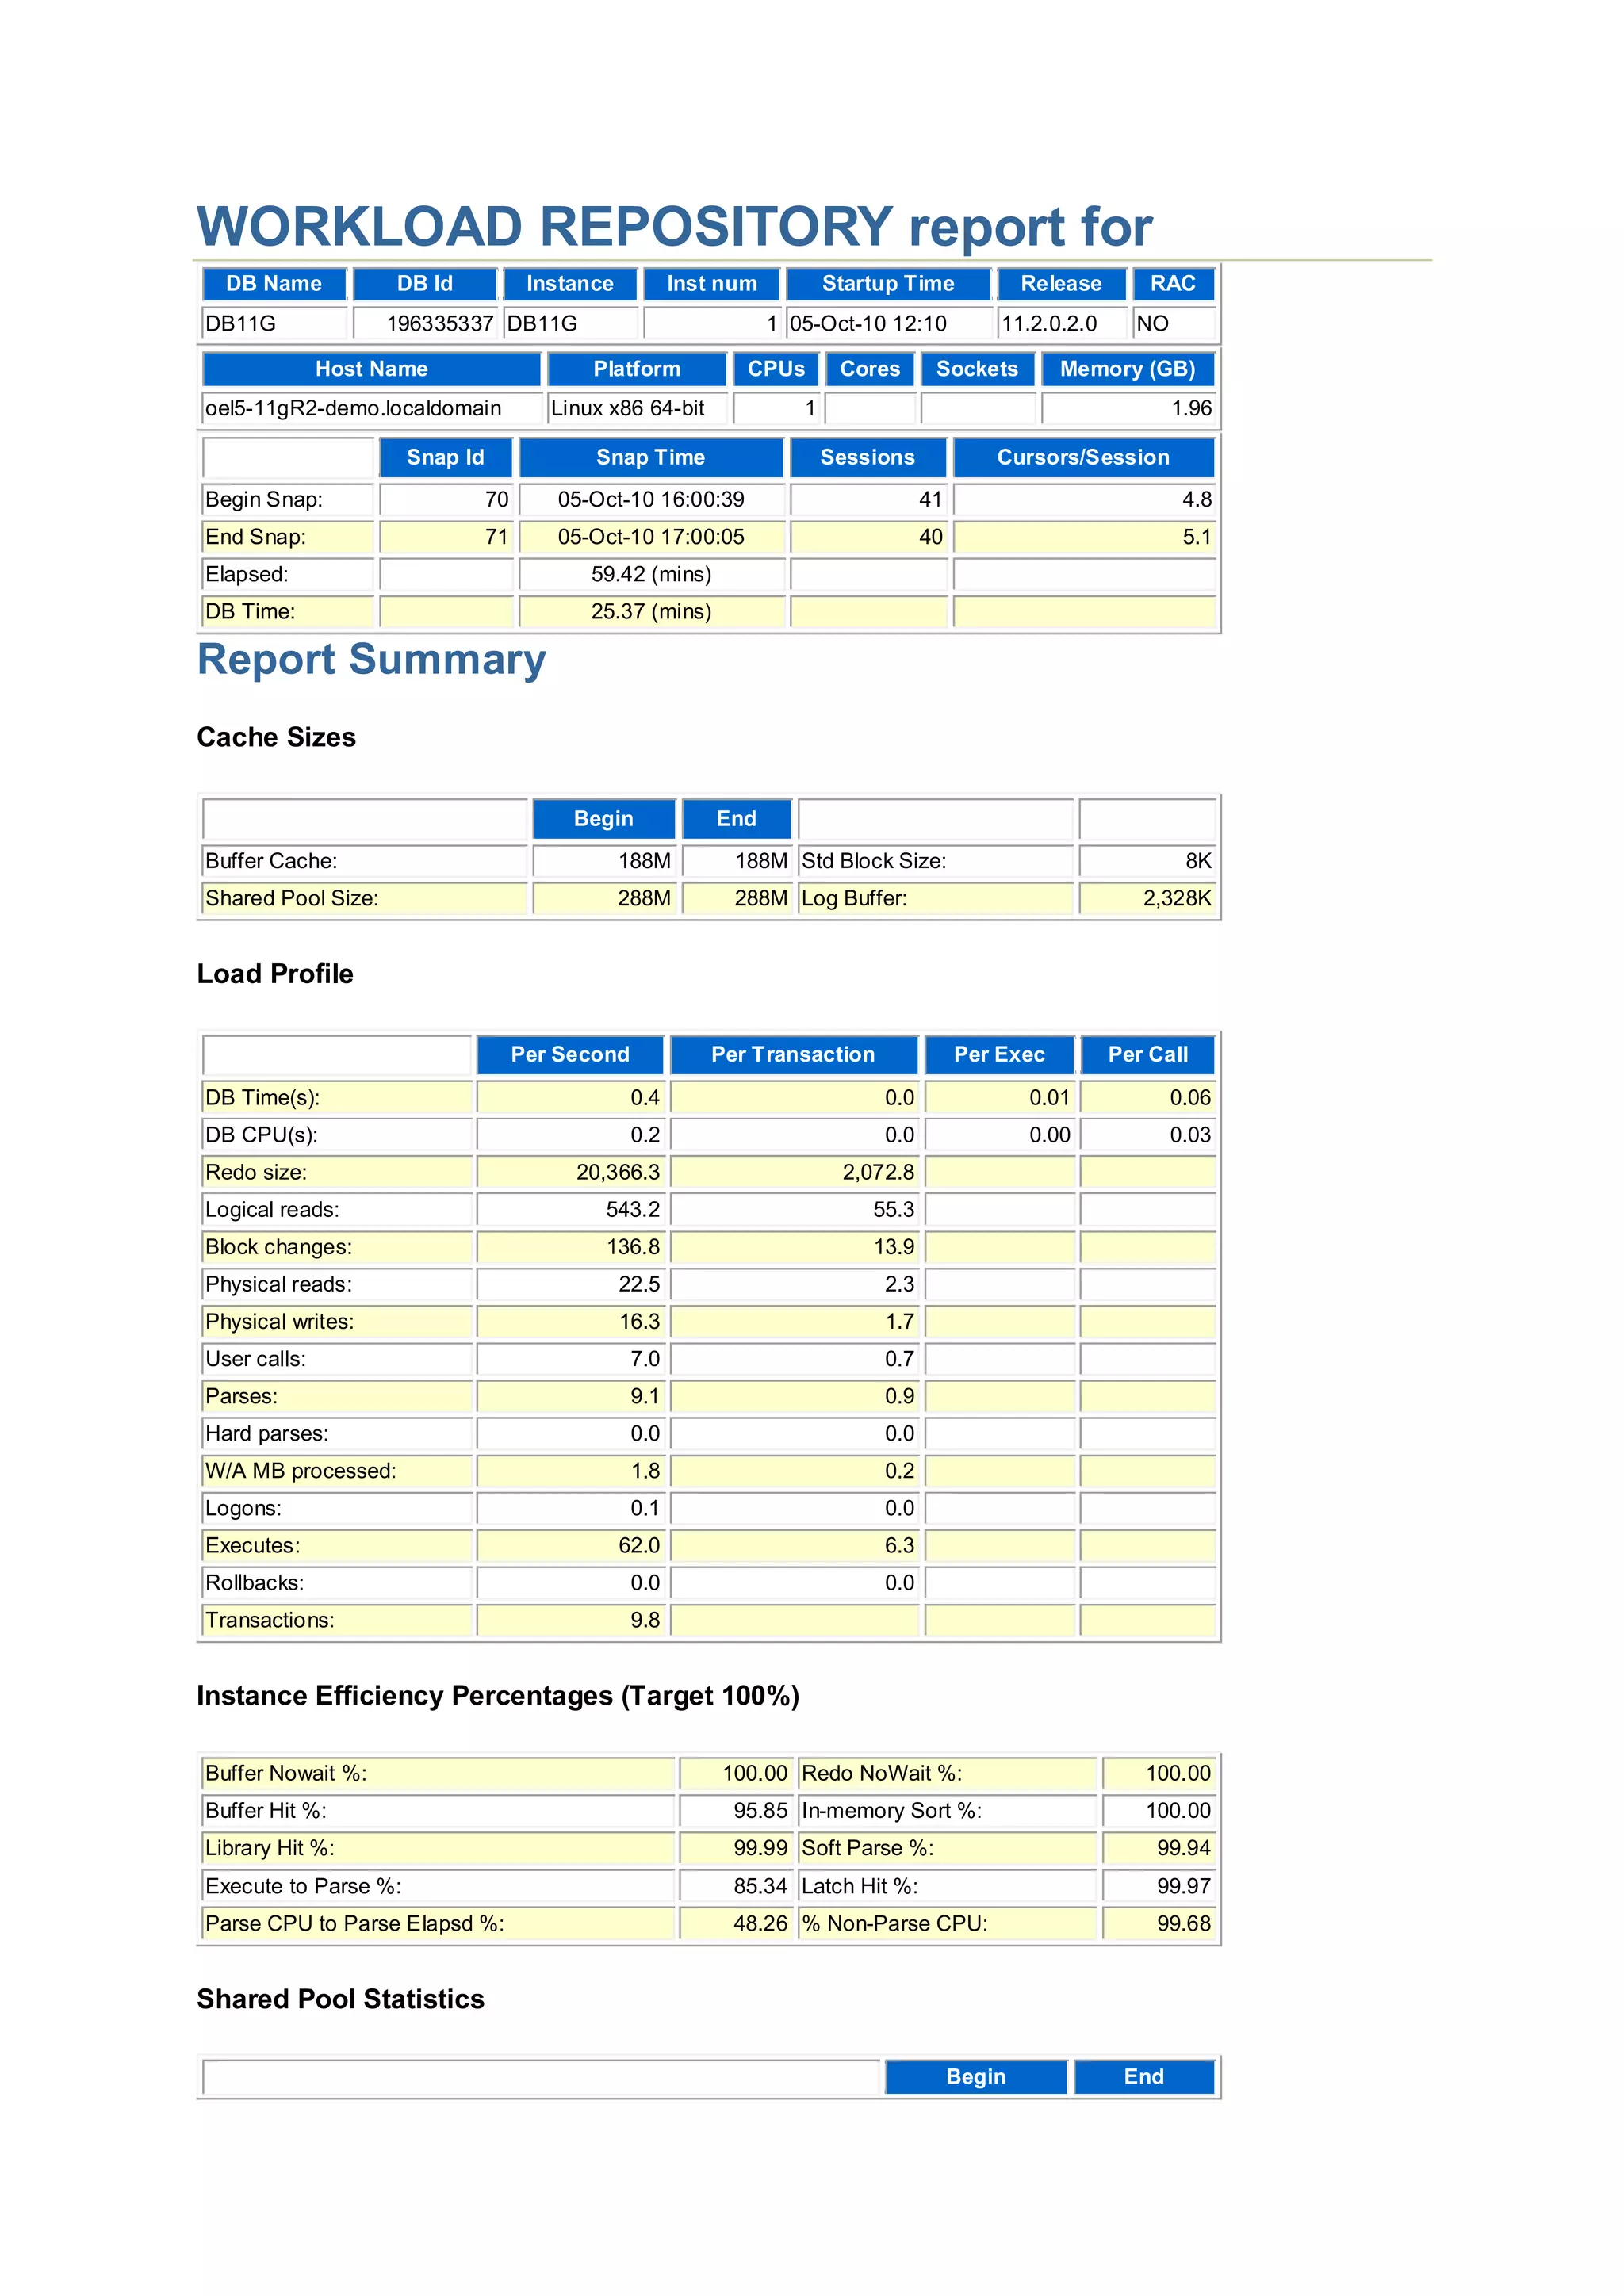
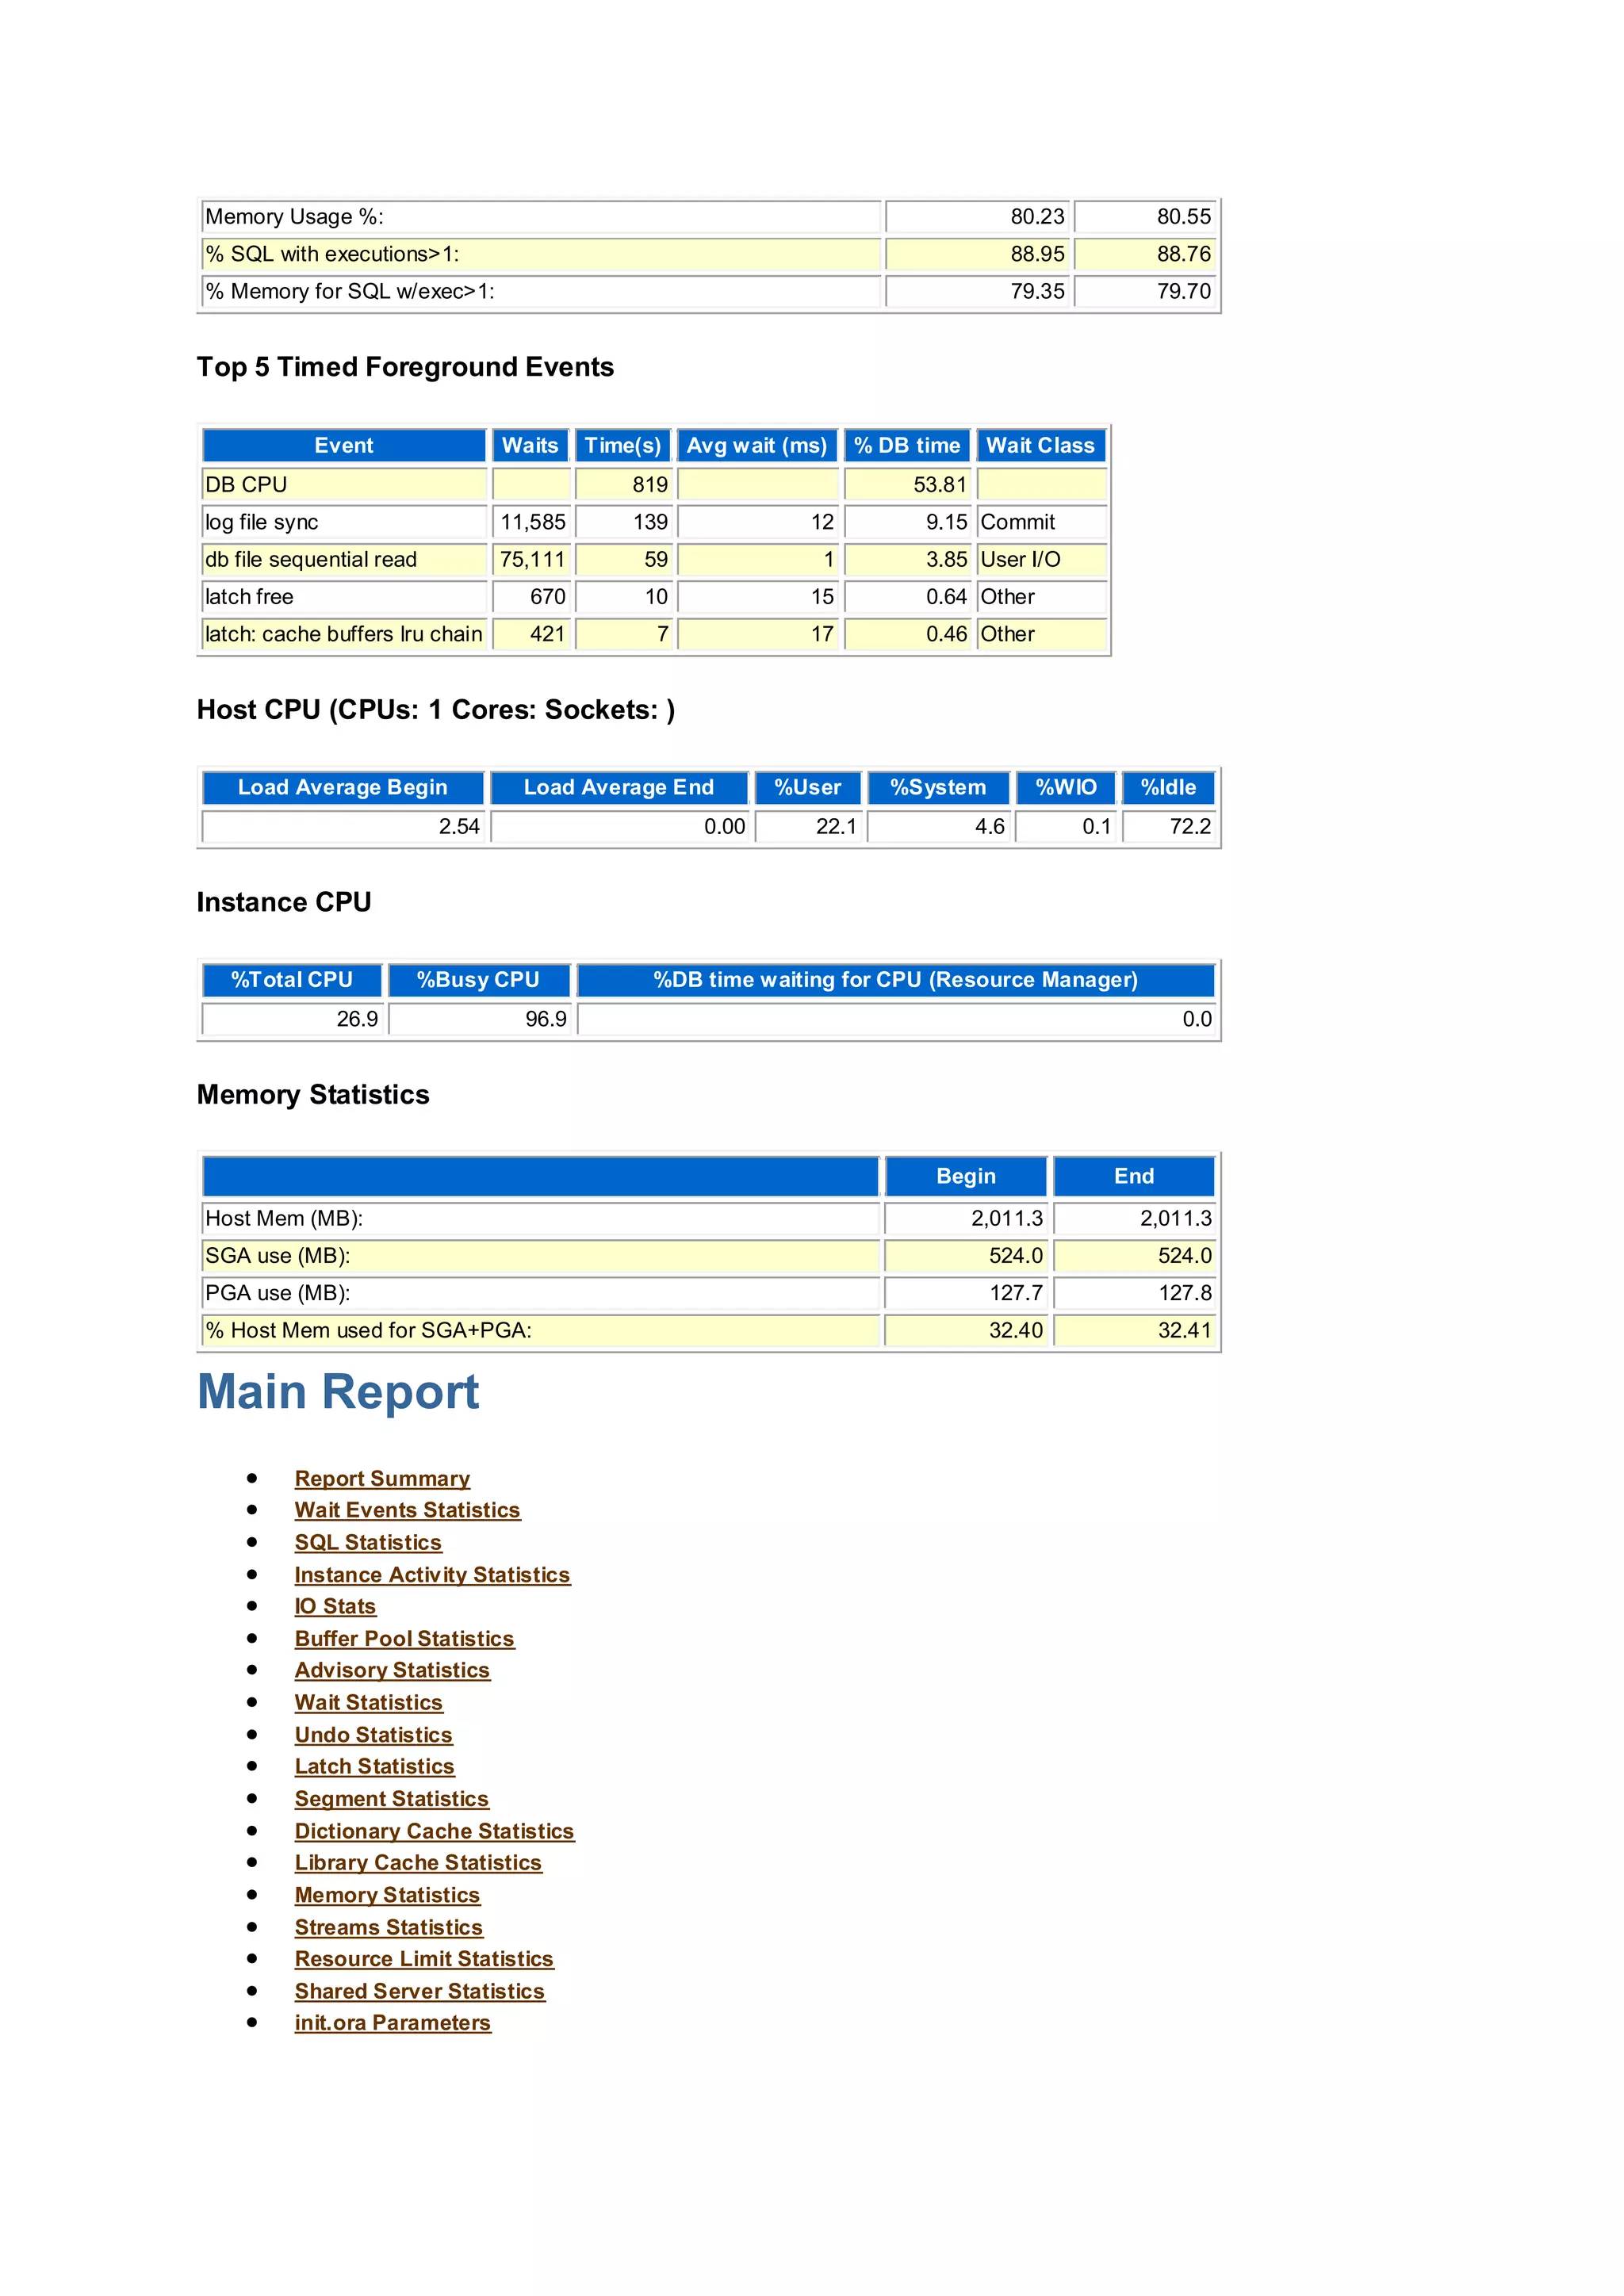
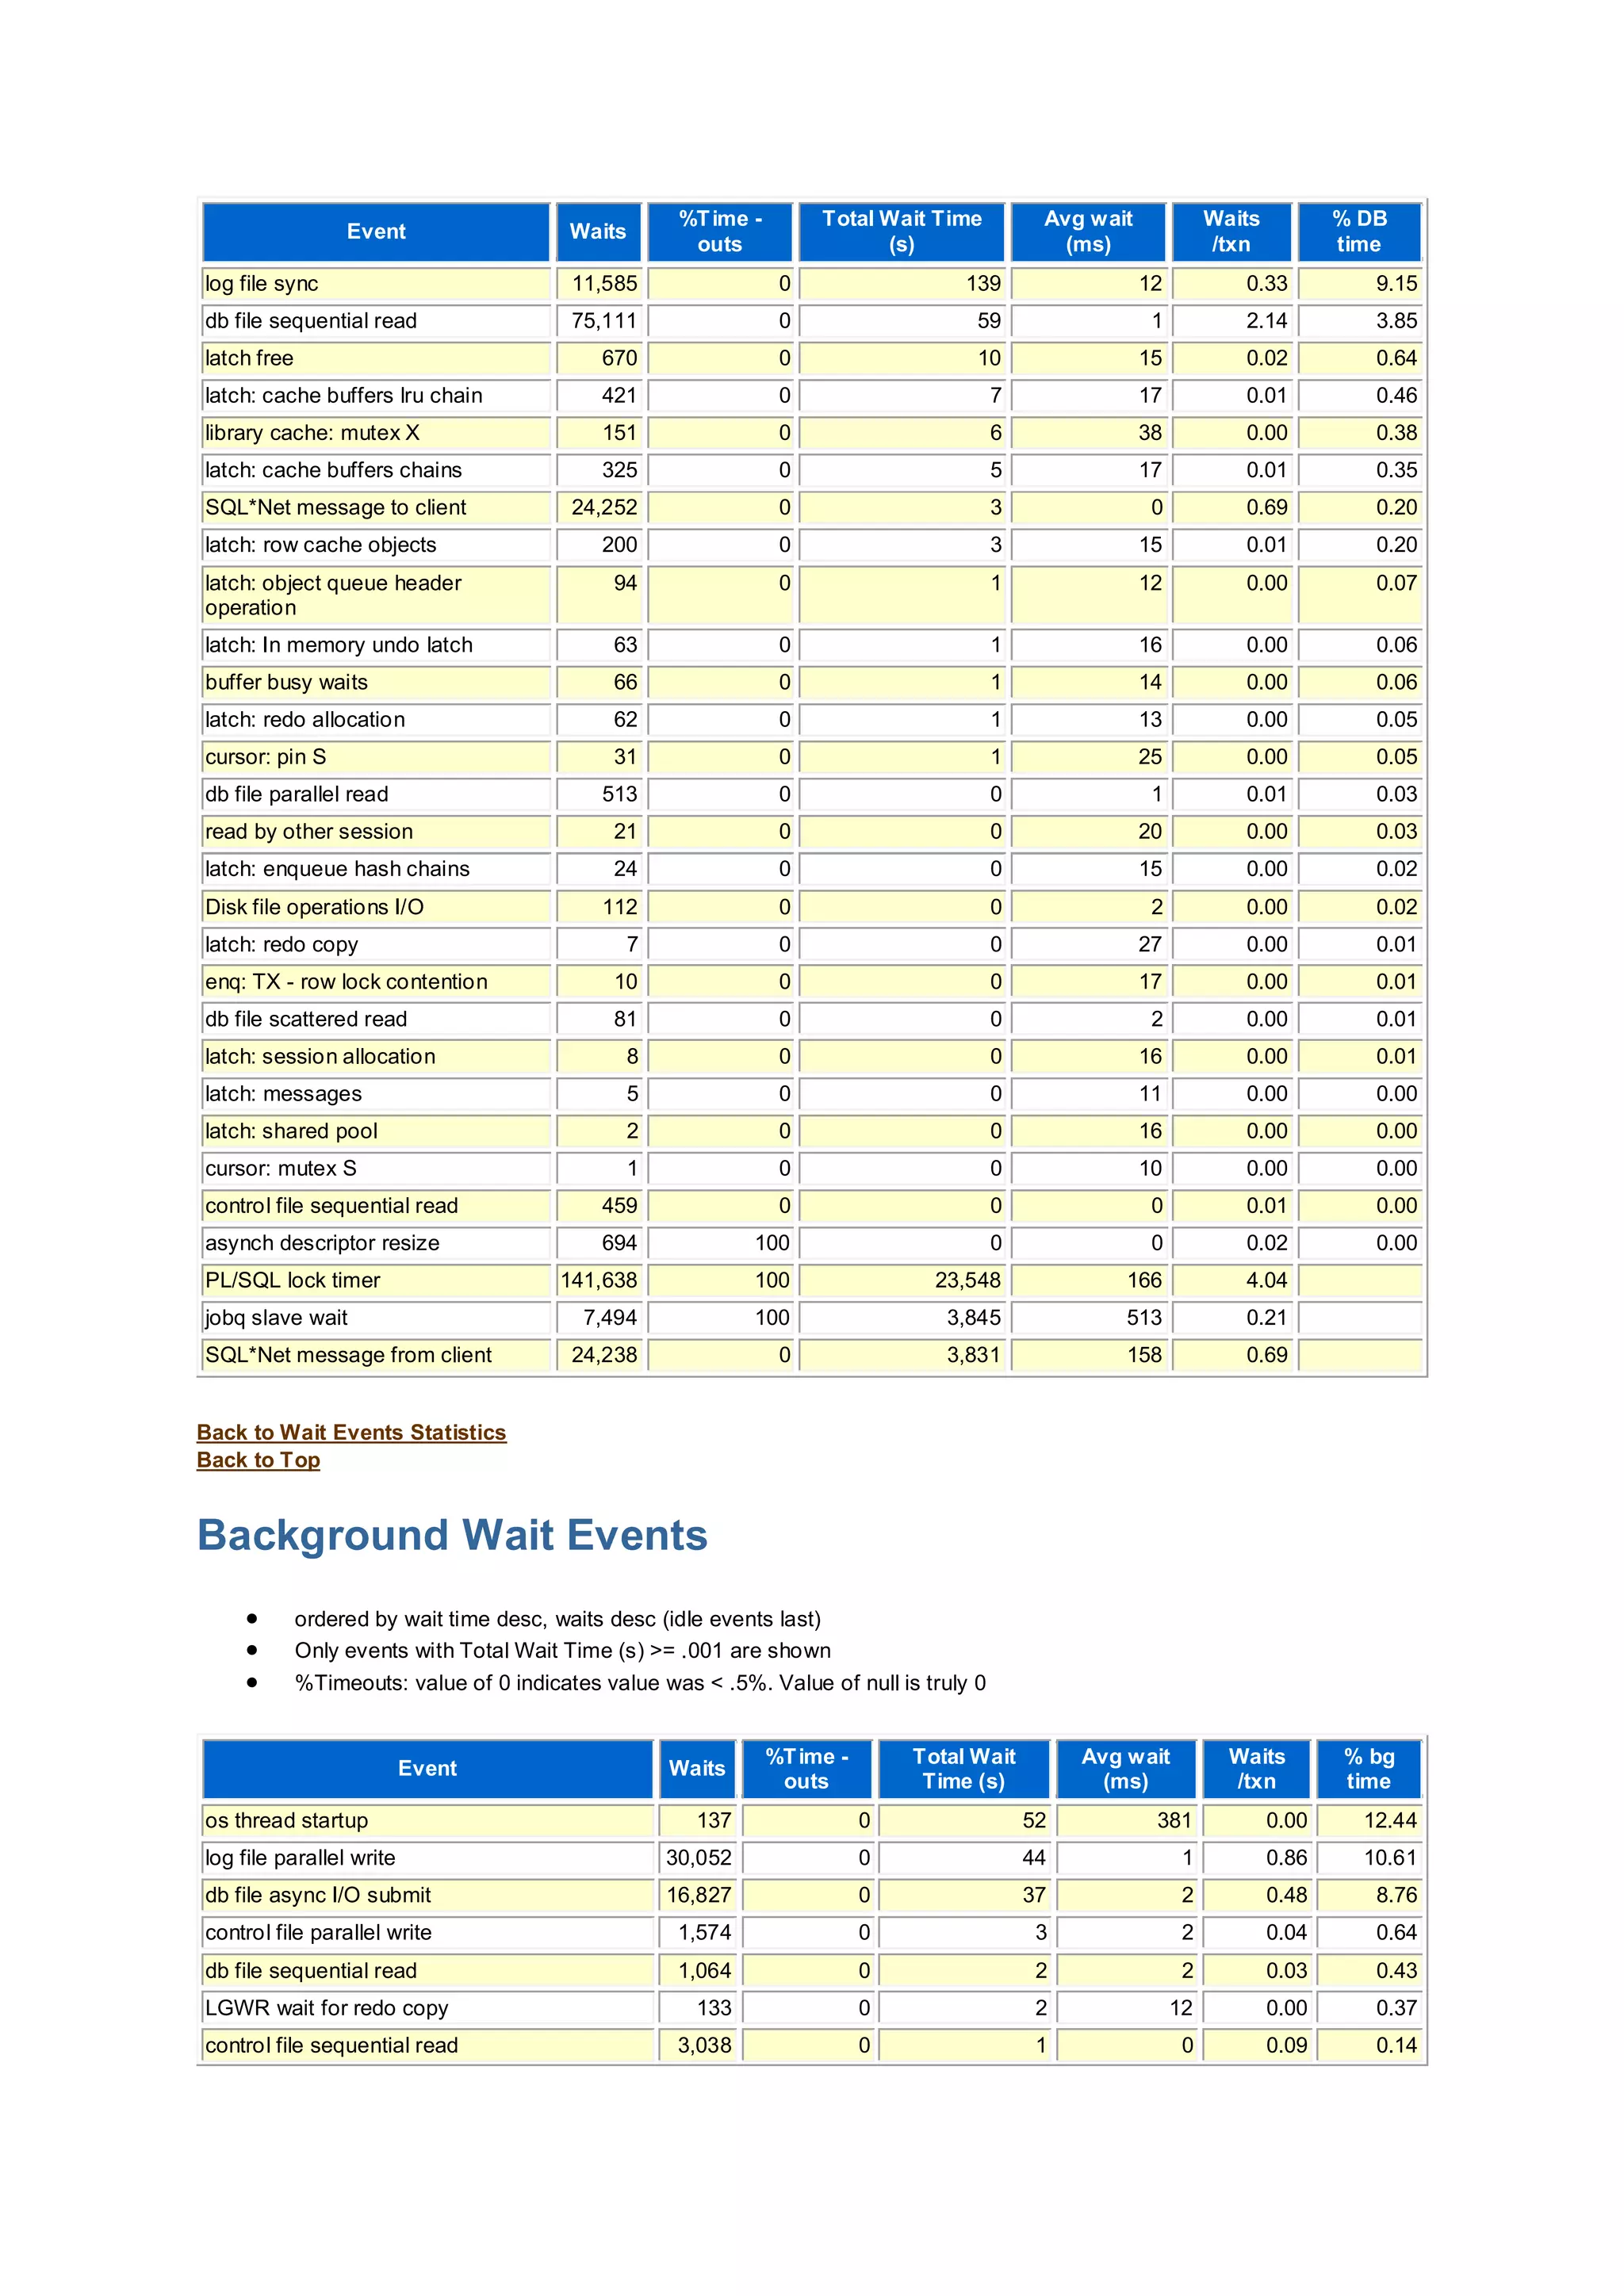
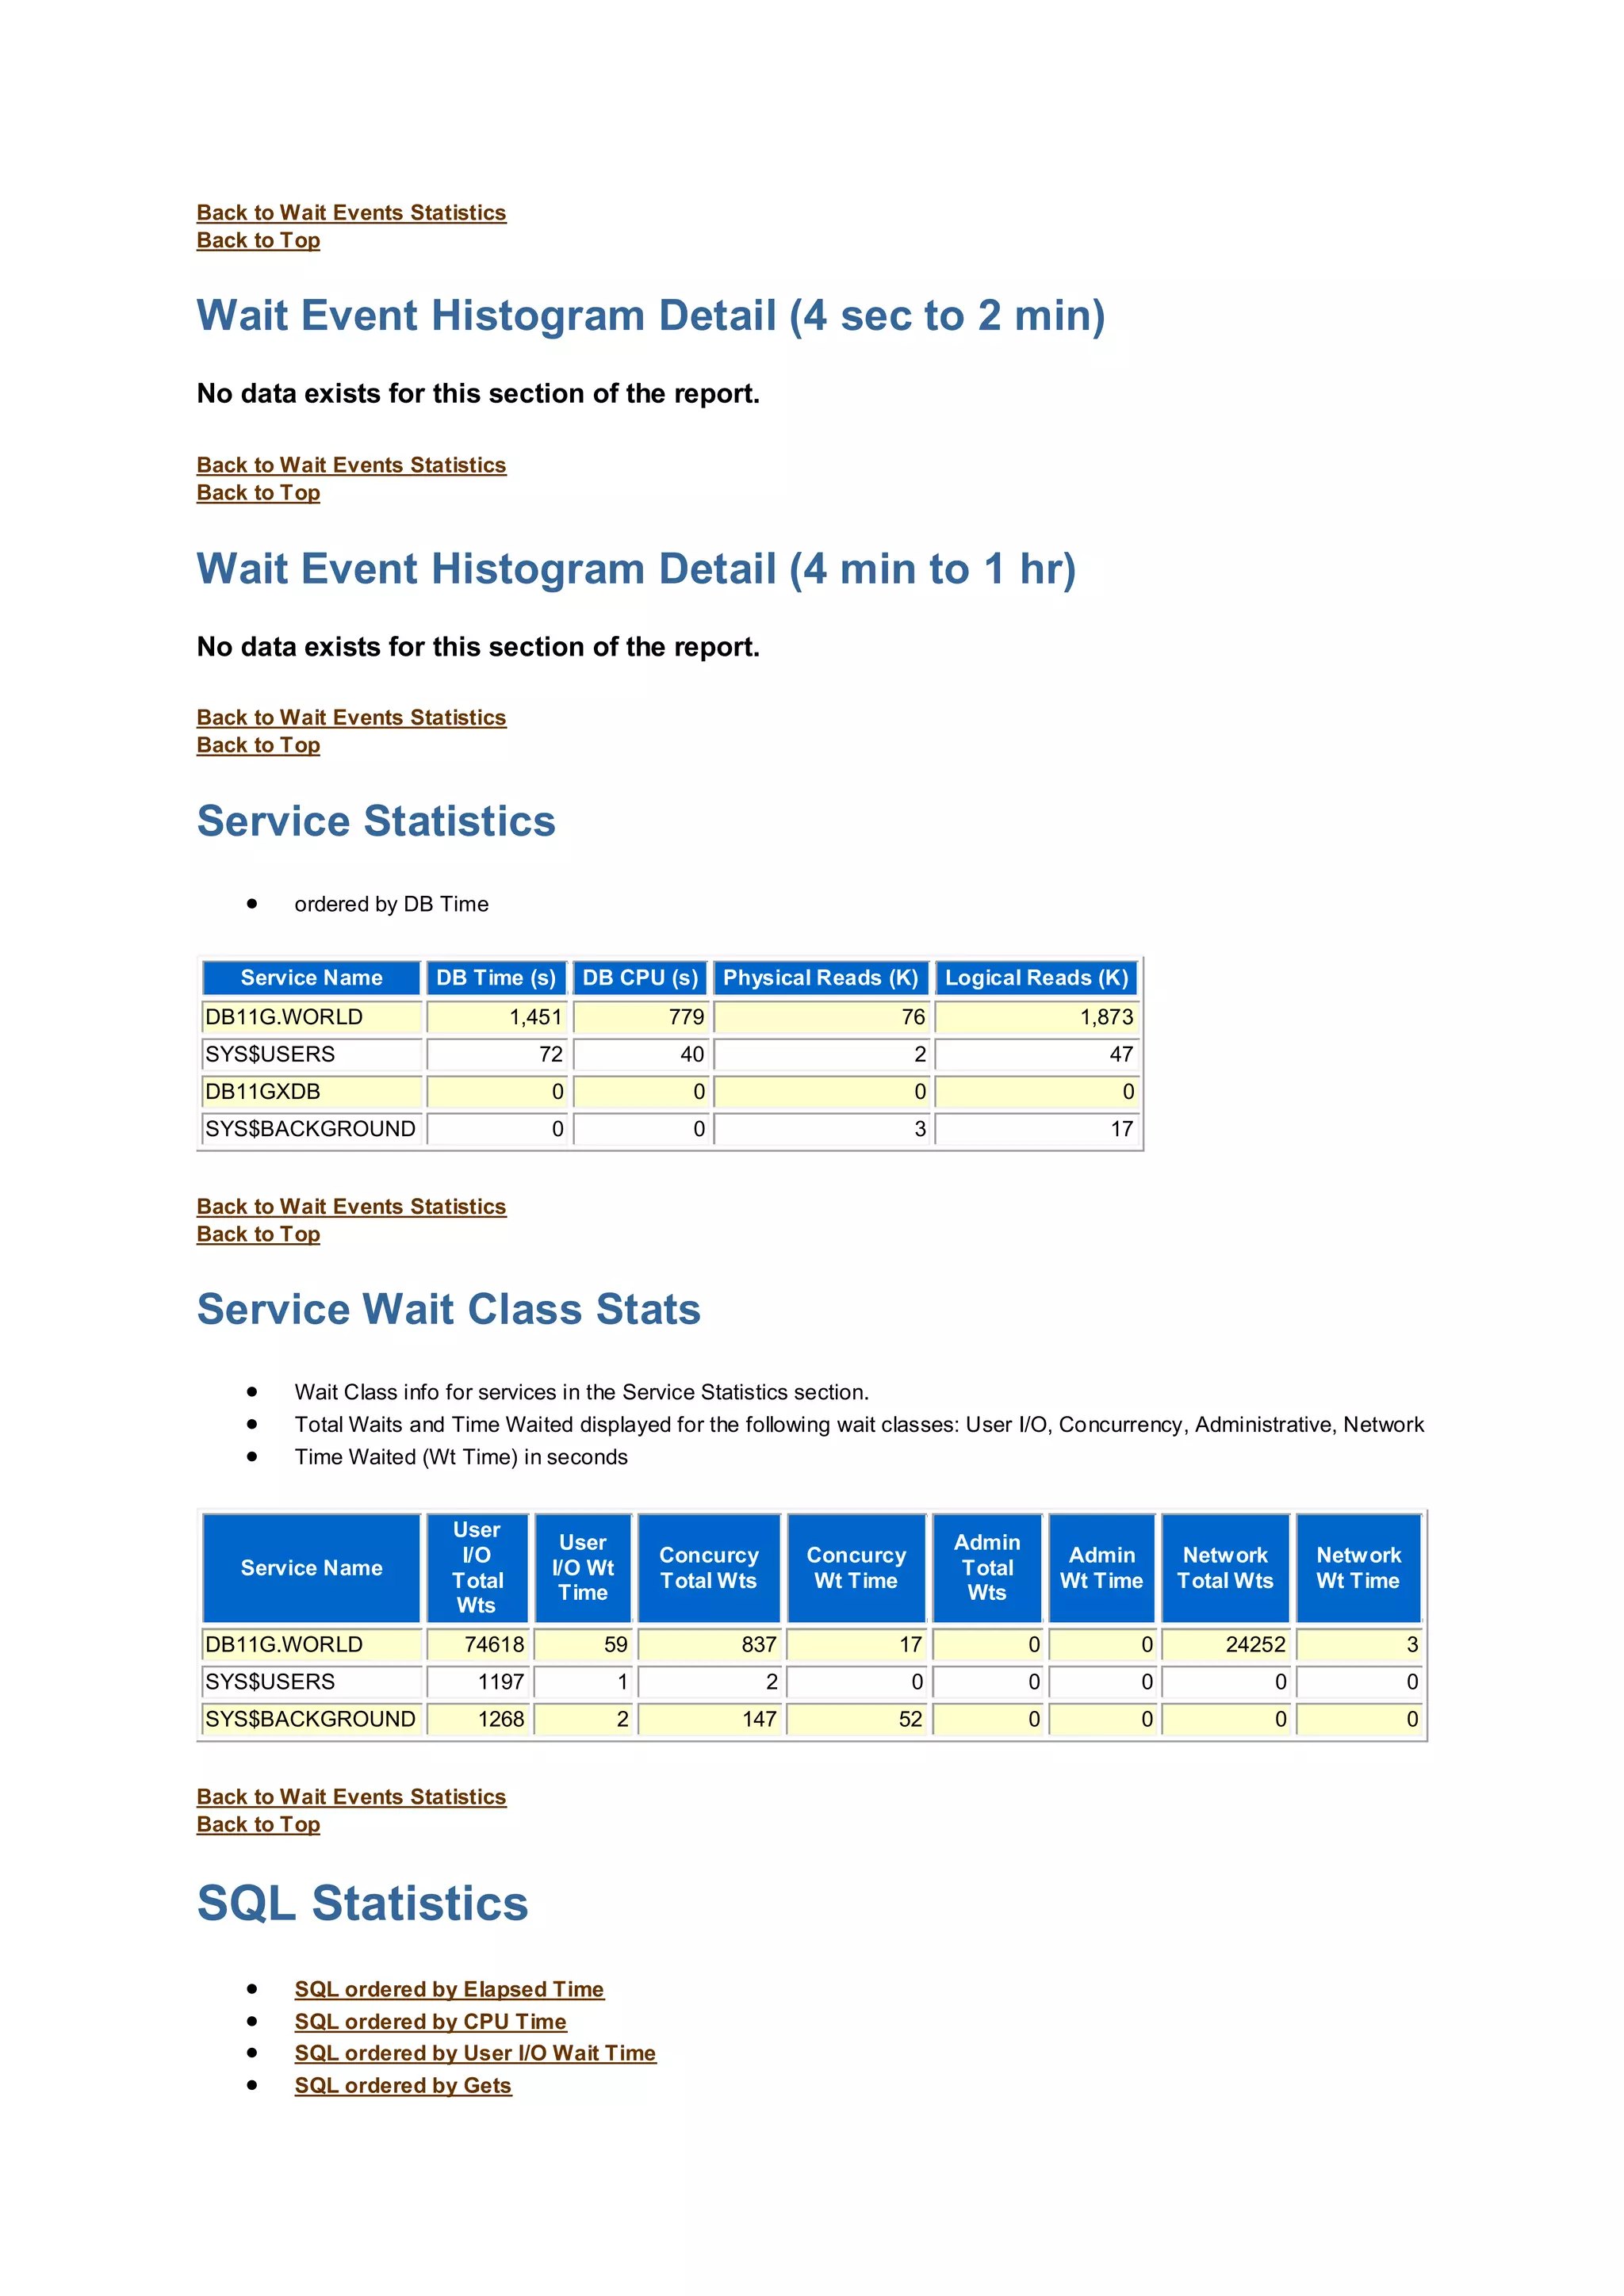
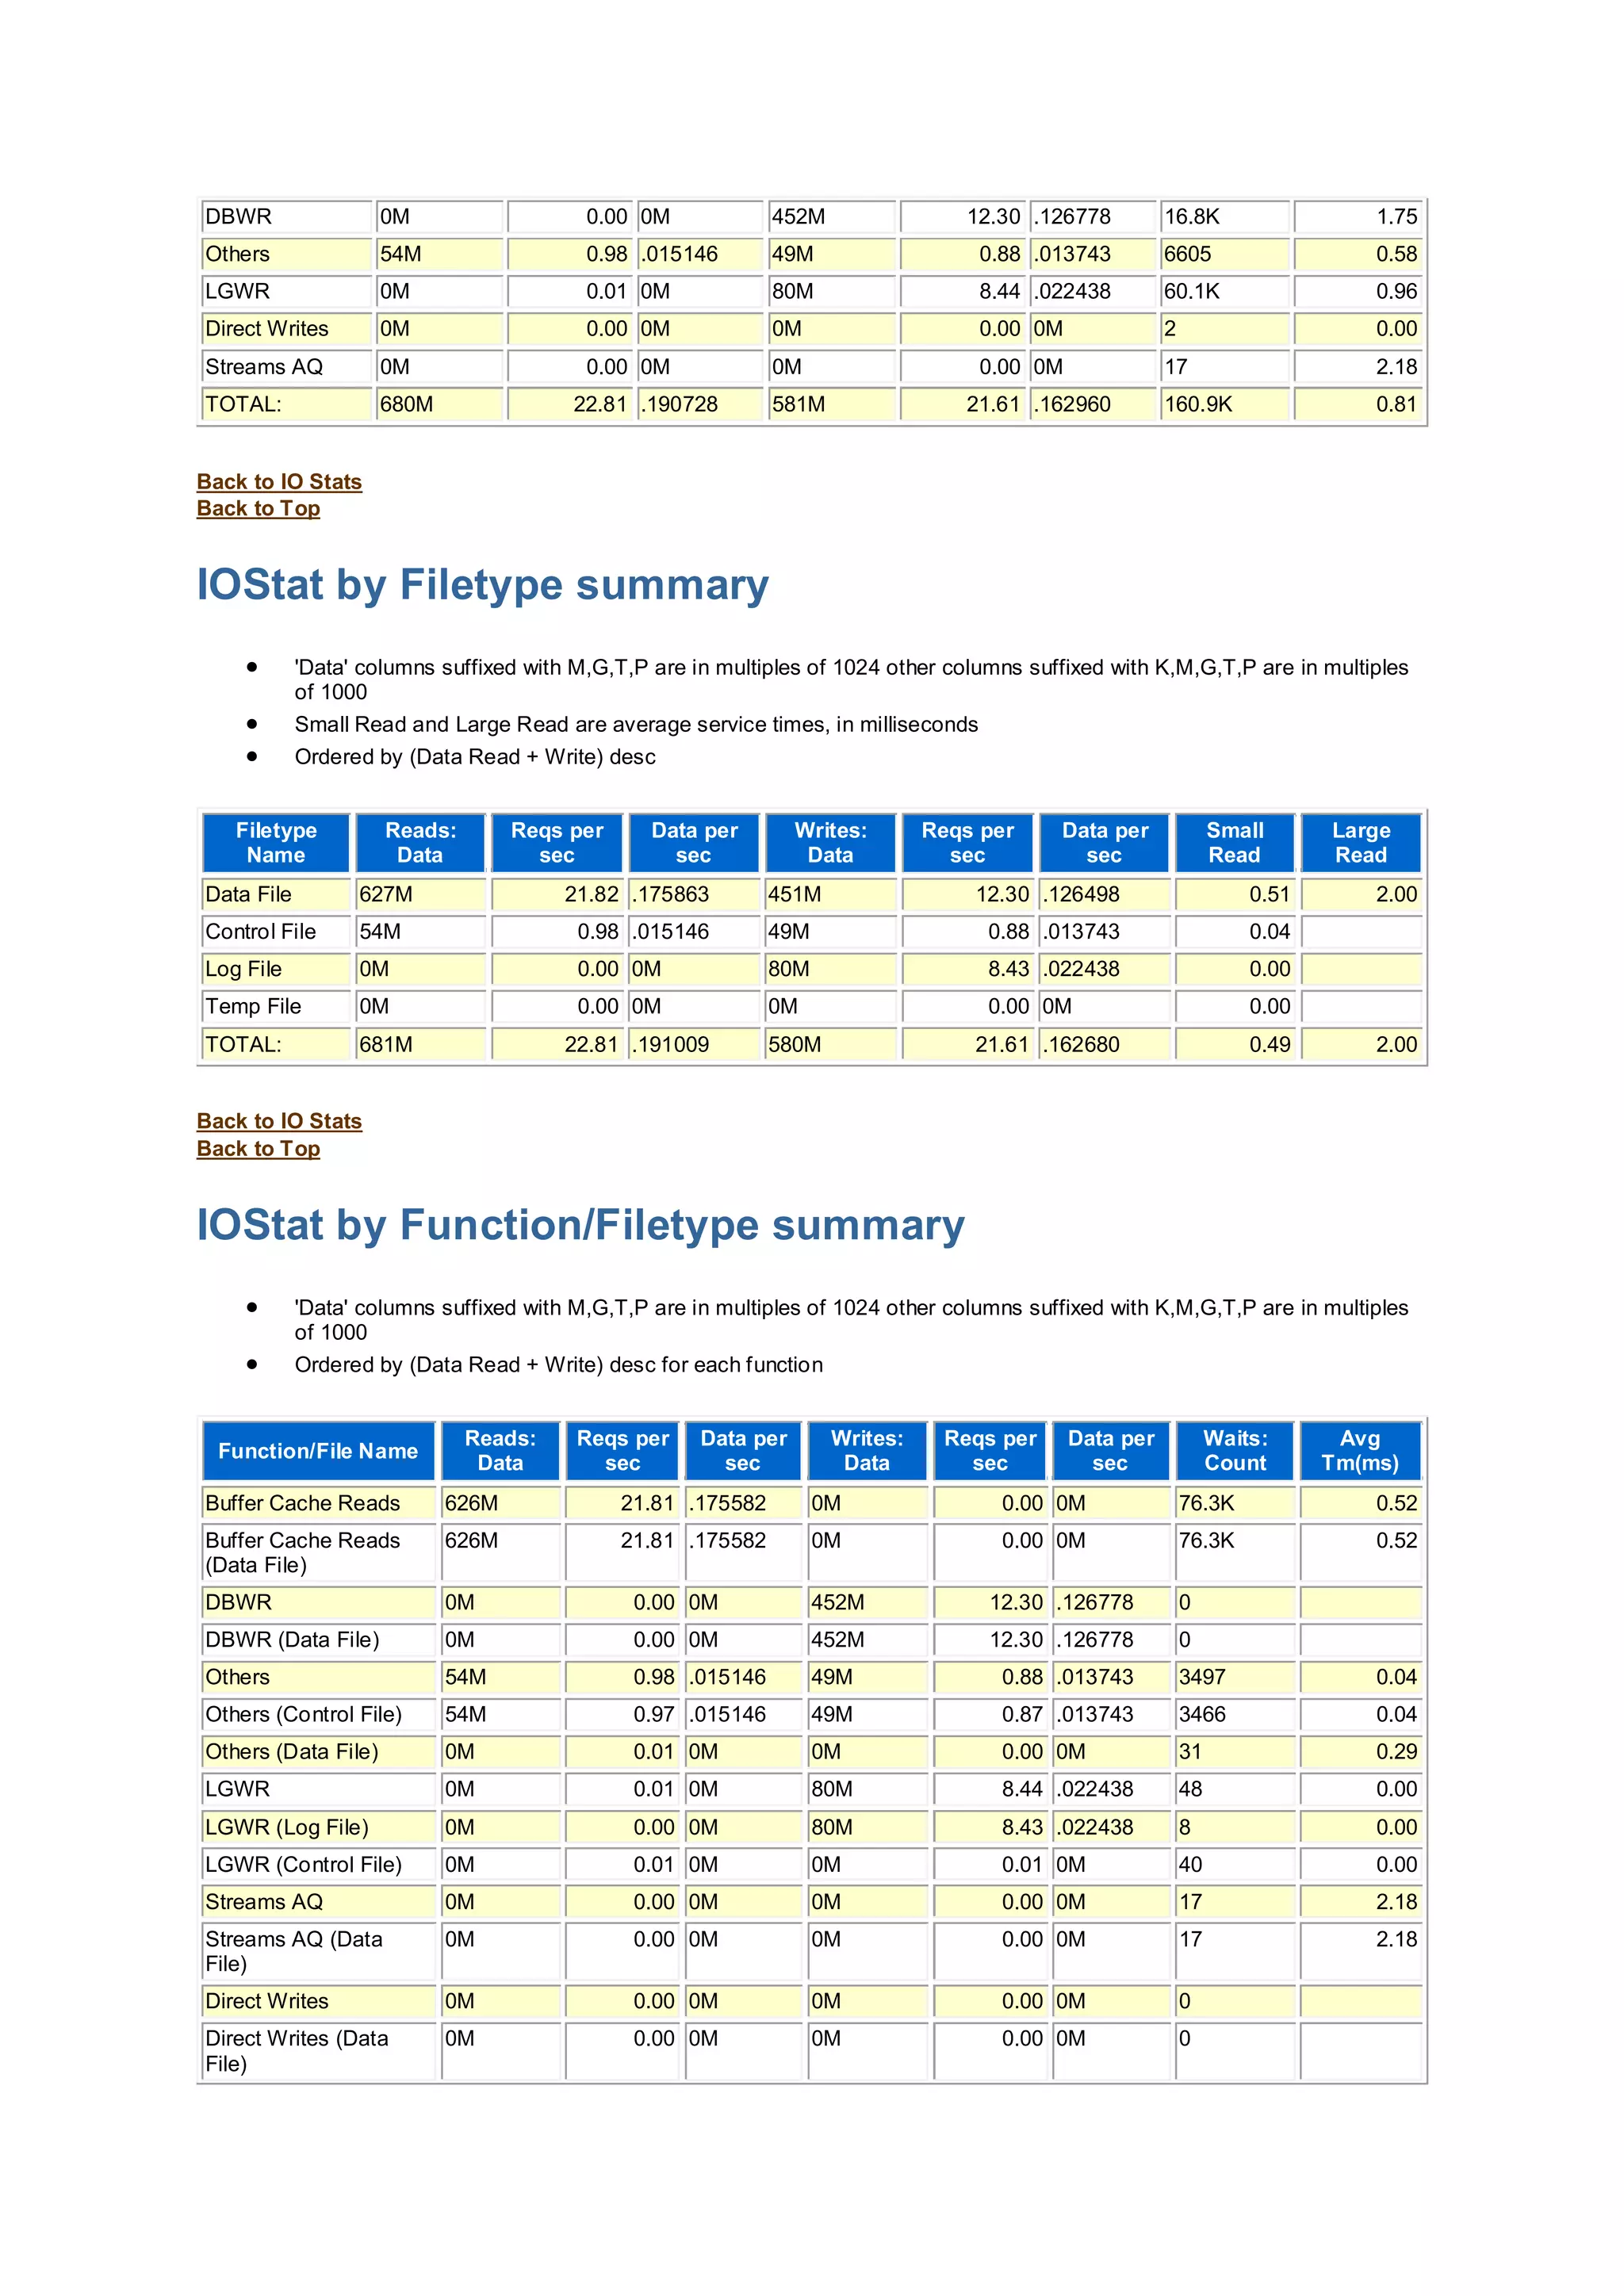
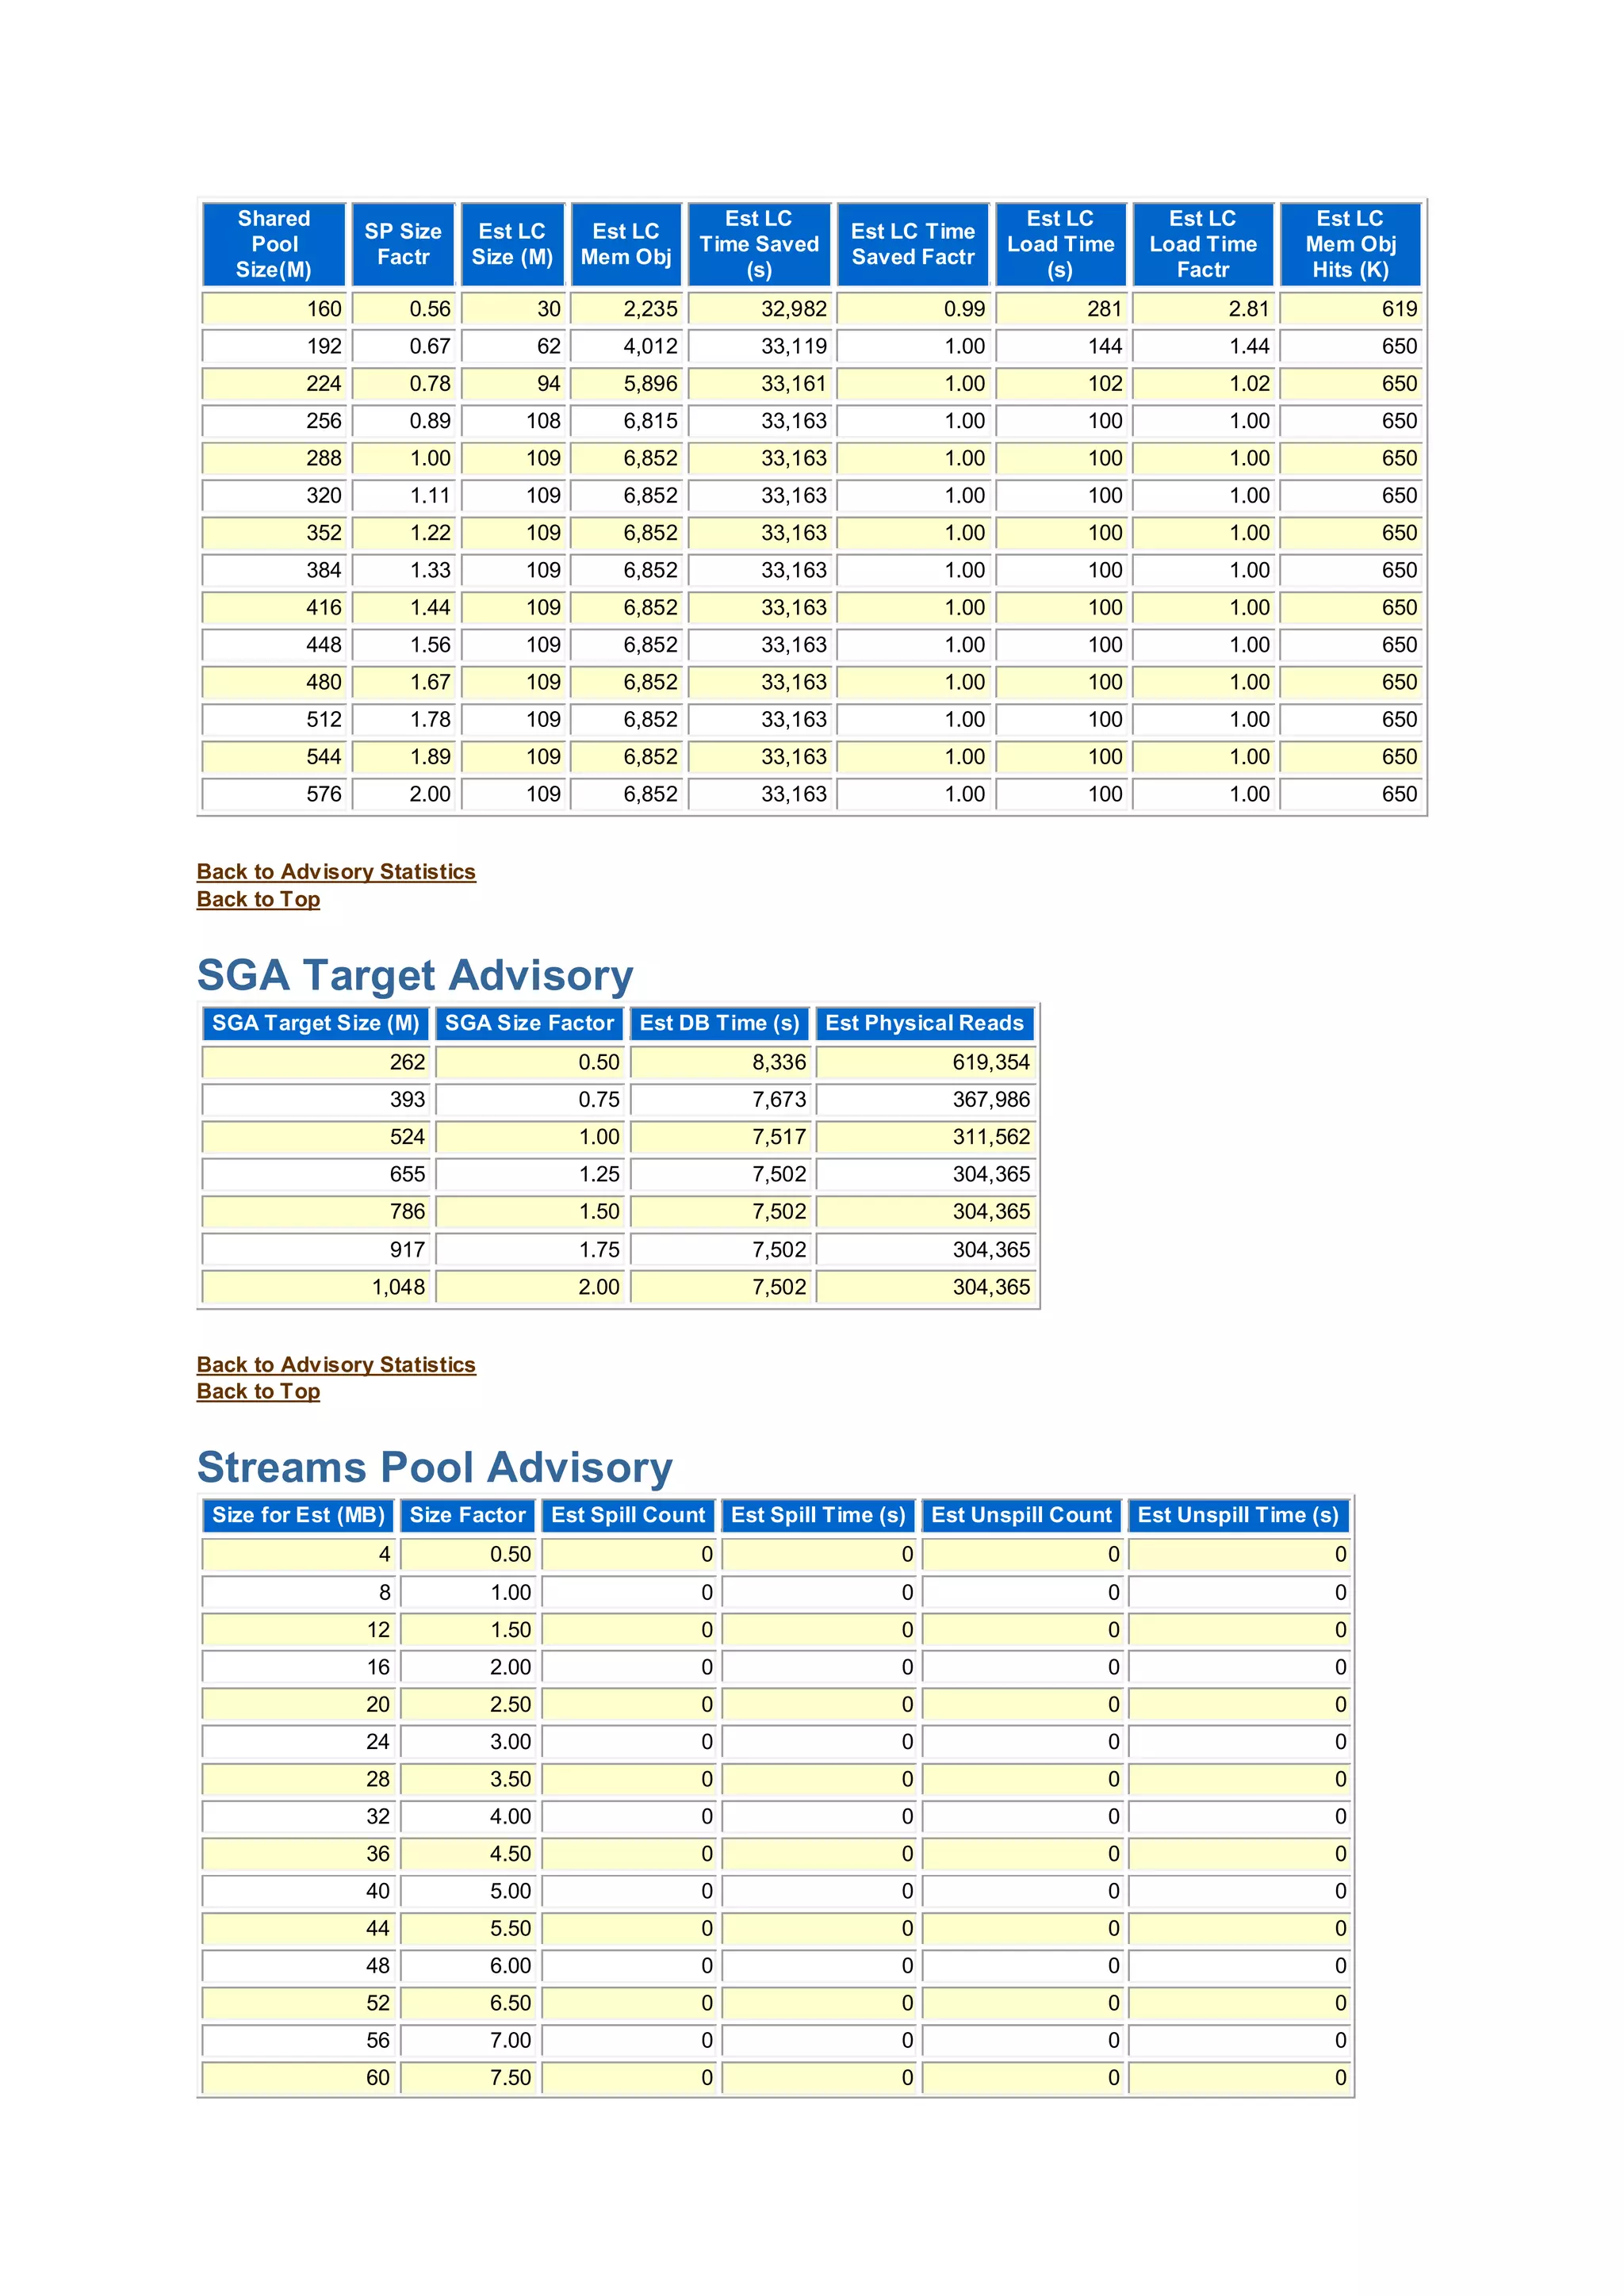
This document contains a workload repository report for a database named DB11G. Key details include: - The database ran on a Linux server with 1 CPU and 1.96GB of memory. - Between two snapshots taken an hour apart, the average wait time per session was 4.8-5.1 seconds. - The top foreground wait event was log file sync, taking up 9.15% of database time.


![Vibe Coding vs. Spec-Driven Development [Free Meetup]](https://cdn.slidesharecdn.com/ss_thumbnails/vibecodingvsspecdrivendevelopment-251209105622-43f455e7-thumbnail.jpg?width=640&height=640&fit=bounds)


