Downloaded 17 times


![[1] db.m2.4xlarge, 3000 PIOPS
(4 consumers @ 6 threads ea)
Cumulative: 5765 tps
Run 01
12000
9000
8000
10000
8000
6000
5000
TPS
Milliseconds Elapsed per Batch
7000
6000
4000
4000
3000
2000
2000
1000
0
0
1
101
201
301
401
501
601
701
801
901
1001 1101 1201 1301 1401 1501 1601 1701 1801 1901
Batch Received by Stats Collector
ElapsedTimeMillis
NetTPS](https://image.slidesharecdn.com/adventuresinrdsloadtesting-131122191939-phpapp02/85/Adventures-in-RDS-Load-Testing-11-320.jpg)
![[1] db.m2.4xlarge, 3000 PIOPS
(4 consumers @ 6 threads ea)
Run 01 Monitoring Results
Peaked @ 2200 Write IOPS
Disk Queue Depth > 100
What’s up with Read IOPS?](https://image.slidesharecdn.com/adventuresinrdsloadtesting-131122191939-phpapp02/85/Adventures-in-RDS-Load-Testing-12-320.jpg)
![[2] db.m2.4xlarge, 3000 PIOPS
(4 consumers @ 6 threads ea) … again
???
Cumulative: 4804 tps
Run 02
30000
14000
12000
10000
20000
8000
TPS
Milliseconds Elapsed per Batch
25000
15000
6000
10000
4000
5000
2000
0
0
1
101
201
301
401
501
601
701
801
901 1001 1101 1201 1301 1401 1501 1601 1701 1801 1901
Batch Received by Stats Collector
ElapsedTimeMillis
TotalTxPerSecond](https://image.slidesharecdn.com/adventuresinrdsloadtesting-131122191939-phpapp02/85/Adventures-in-RDS-Load-Testing-13-320.jpg)
![[2] db.m2.4xlarge, 3000 PIOPS
(4 consumers @ 6 threads ea) … again
Run 02 Monitoring Results
Peaked @ 2500+ Write IOPS
Disk Queue Depth
tracks Write IOPS (or vice versa)](https://image.slidesharecdn.com/adventuresinrdsloadtesting-131122191939-phpapp02/85/Adventures-in-RDS-Load-Testing-14-320.jpg)
![[3] db.m2.4xlarge, 3000 PIOPS
(4 consumers @ 6 threads ea) … third run
Cumulative: 4842 tps
Run 03
30000
10000
9000
25000
7000
20000
6000
15000
5000
4000
10000
3000
2000
5000
1000
0
0
1
101
201
301
401
501
601
701
801
901 1001 1101 1201 1301 1401 1501 1601 1701 1801 1901
Batch Received by Stats Collector
ElapsedTimeMillis
TotalTxPerSecond
TPS
Milliseconds Elapsed per Batch
8000](https://image.slidesharecdn.com/adventuresinrdsloadtesting-131122191939-phpapp02/85/Adventures-in-RDS-Load-Testing-15-320.jpg)
![[3] db.m2.4xlarge, 3000 PIOPS
(4 consumers @ 6 threads ea) … third run
Run 03 Monitoring Results
Peaked @ 2500+ Write IOPS
Very curious what’s going on
in this interval, from peak to
end of run
Disk Queue Depth
tracks Write IOPS (or vice versa)](https://image.slidesharecdn.com/adventuresinrdsloadtesting-131122191939-phpapp02/85/Adventures-in-RDS-Load-Testing-16-320.jpg)
![[4] db.m2.4xlarge, 1000 PIOPS
(2 consumers @ 6 threads ea)
Cumulative: 2854 tps
Run 04
12000
5000
4500
10000
Dialed back concurrency, on the hunch that
Oracle is resetting too many connections
8000
6000
3500
3000
2500
2000
4000
1500
1000
2000
500
0
0
1
101
201
301
401
501
601
701
801
901
1001 1101 1201 1301 1401 1501 1601 1701 1801 1901
Batch Received by Stats Collector
ElapsedTimeMillis
TotalTxPerSecond
TPS
Milliseconds Elapsed per Batch
4000](https://image.slidesharecdn.com/adventuresinrdsloadtesting-131122191939-phpapp02/85/Adventures-in-RDS-Load-Testing-17-320.jpg)
![[4] db.m2.4xlarge, 1000 PIOPS
(2 consumers @ 6 threads ea)
Run 04 Monitoring Results](https://image.slidesharecdn.com/adventuresinrdsloadtesting-131122191939-phpapp02/85/Adventures-in-RDS-Load-Testing-18-320.jpg)
![[5] db.m2.4xlarge, 1000 PIOPS
(4 consumers @ 6 threads ea)
Cumulative: 2187 tps
Run 05
80000
6000
Dialing back up made it worse
5000
60000
4000
50000
40000
3000
30000
2000
20000
1000
10000
0
0
1
101
201
301
401
501
601
701
801
901
1001 1101 1201 1301 1401 1501 1601 1701 1801 1901
Batch Received by Stats Collector
ElapsedTimeMillis
TotalTxPerSecond
TPS
Milliseconds Elapsed per Batch
70000](https://image.slidesharecdn.com/adventuresinrdsloadtesting-131122191939-phpapp02/85/Adventures-in-RDS-Load-Testing-19-320.jpg)
![[5] db.m2.4xlarge, 1000 PIOPS
(4 consumers @ 6 threads ea)
Run 05 Monitoring Results](https://image.slidesharecdn.com/adventuresinrdsloadtesting-131122191939-phpapp02/85/Adventures-in-RDS-Load-Testing-20-320.jpg)
![[6] db.m1.xlarge, No PIOPS
(2 consumers @ 6 threads ea)
12000
Cumulative: 1061 tps
Run 06
Some early flutter, but
not much
1200
1000
8000
800
6000
600
4000
400
2000
200
0
0
1
101
201
301
401
501
601
701
801
901
1001 1101 1201 1301 1401 1501 1601 1701 1801 1901
Batch Received by Stats Collector
ElapsedTimeMillis
TotalTxPerSecond
TPS
Milliseconds Elapsed per Batch
10000](https://image.slidesharecdn.com/adventuresinrdsloadtesting-131122191939-phpapp02/85/Adventures-in-RDS-Load-Testing-21-320.jpg)
![[6] db.m1.xlarge, No PIOPS
(2 consumers @ 6 threads ea)
Run 06 Monitoring Results
Different colors than on
previous slides](https://image.slidesharecdn.com/adventuresinrdsloadtesting-131122191939-phpapp02/85/Adventures-in-RDS-Load-Testing-22-320.jpg)


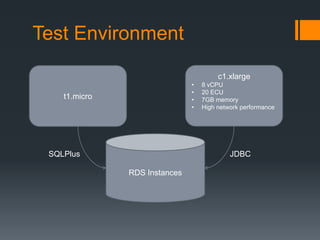
This document summarizes load testing experiments conducted on Amazon RDS using an Oracle database. The tests aimed to evaluate RDS performance under different configurations and provide a basis for future load testing. Tests were run using m2.4xlarge and m1.xlarge instance types with varying provisioned IOPS. Key results showed that provisioned IOPS had a significant impact on throughput and latency. Higher IOPS configurations achieved thousands of transactions per second but also had periods of high latency. Lower IOPS configurations had more stable performance but lower throughput. The experiments provided insights into how different factors like instance type, IOPS provisioning, and read/write ratios influence RDS and database performance under load.