Download as PDF, PPTX


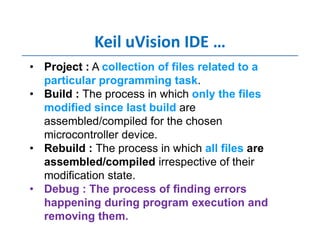
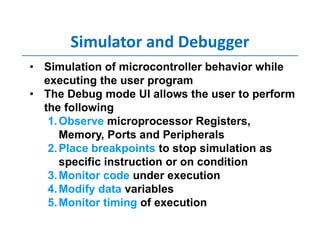
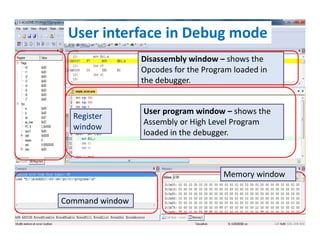


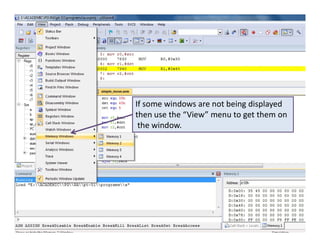


Keil uVision is an integrated development environment (IDE) that provides a single solution for coding, building, debugging and flashing programs onto microcontrollers. The debugger in Keil uVision allows users to observe registers, memory, ports and peripherals, set breakpoints, monitor code execution and modify variables. It displays the disassembly code, assembly/high level code, registers and memory to help debug programs on a simulator.


![[OOP - Lec 19] Static Member Functions](https://cdn.slidesharecdn.com/ss_thumbnails/lecture-19staticmemberfunctions-160705095235-thumbnail.jpg?width=640&height=640&fit=bounds)


![New_Microsoft_PowerPoint_Presentation-1[1].pdf](https://cdn.slidesharecdn.com/ss_thumbnails/newmicrosoftpowerpointpresentation-11-250106232808-51c69f09-thumbnail.jpg?width=640&height=640&fit=bounds)