Download to read offline
![Project management as a [best]
practice is a method of planning and
guiding a project from start to finish.](https://image.slidesharecdn.com/aaspsummit2015projectmgt-220830041036-69a2acbe/85/AASP_SUMMIT2015_Project_Mgt-pptx-12-320.jpg)
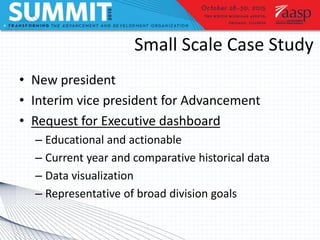
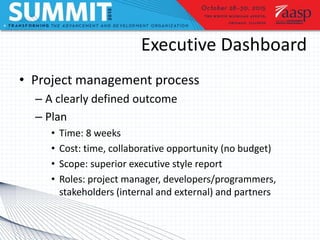
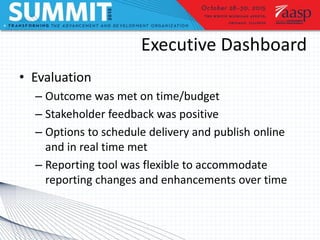
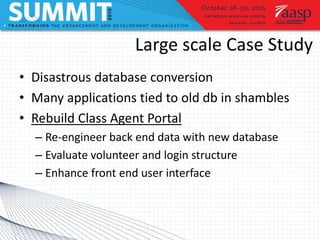
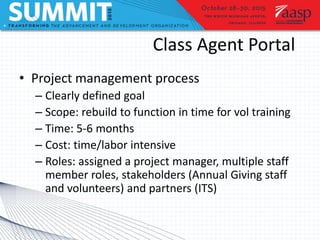
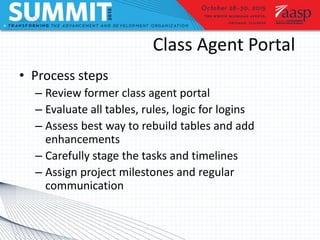
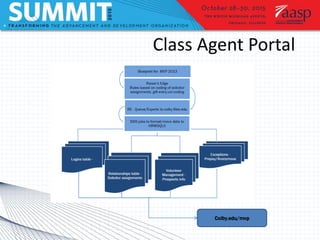
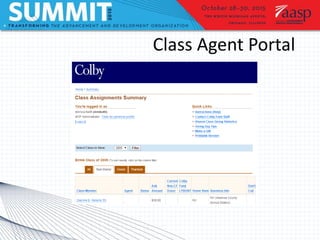
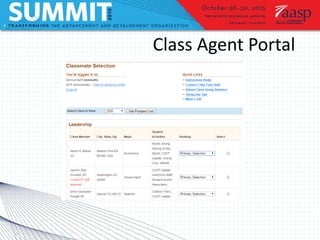
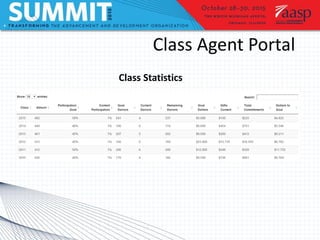
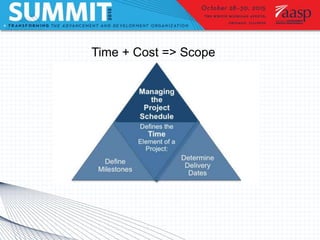
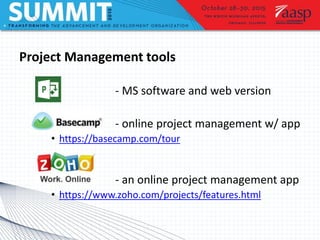
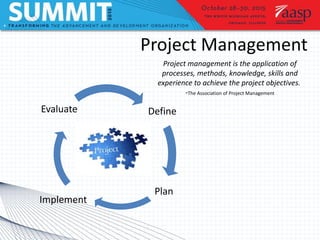

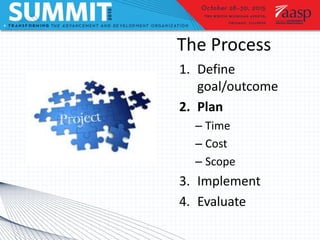
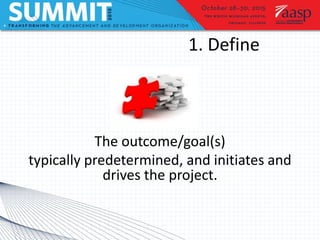
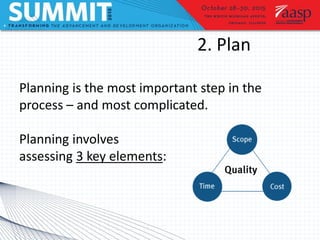
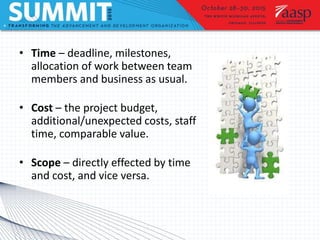
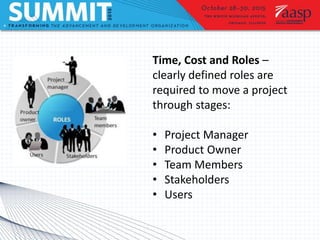
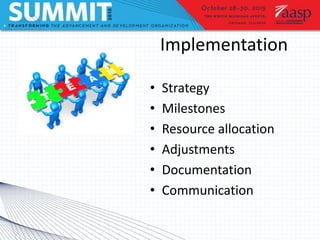
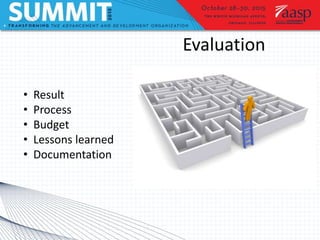
Project management involves defining goals, planning, implementing, and evaluating a project. It typically involves short-term projects with specific outcomes and allocated resources. Planning is the most important step and involves assessing time, cost, and scope. Two case studies are described: an executive dashboard project completed on time and budget through defining roles and milestones, and a class agent portal rebuild that met its goals through careful project management. Tools and models for prioritizing projects include matrices and Venn diagrams.