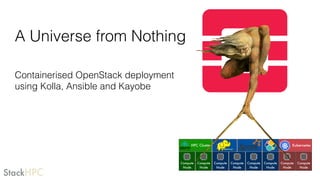
The document discusses deploying OpenStack using Kolla, Kolla-Ansible, Kayobe and Tenks. It introduces these tools and provides steps to deploy a containerized OpenStack cluster on bare metal hosts, including defining the control plane instances with Tenks, inspecting and provisioning them with Kayobe, deploying and configuring OpenStack services with Kolla-Ansible, and booting a VM instance. It also demonstrates reconfiguring the cluster to add centralized logging and describes accessing the Kibana UI.
Kubernetes or OpenShift - choosing your container platform for Dev and OpsTomasz Cholewa
Kubernetes has become the most popular choice among container orchestrators with strong community and growing numbers of production deployments. There is no shortage of various K8s distros, at the moment 20+ and counting. There are many distributions available that just simply add toolsets and products that embed it and adds more features. In this presentation, you'll learn about OpenShift and how it compares to vanilla Kubernetes - their major differences, best features and how they can help to build a consistent platform for Dev and Ops cooperation.
In this slide, we discussed the IPVS, including the introduction, demonstration, implementation, and integration in Kubernetes.
IPVS was based on the netfilter and we discussed how it works with iptables and also compares the detail implementation in Kubernetes to show why IPVS has a better performance in IPTABLES.
Video: https://www.youtube.com/watch?v=JRFNIKUROPE . Talk for linux.conf.au 2017 (LCA2017) by Brendan Gregg, about Linux enhanced BPF (eBPF). Abstract:
A world of new capabilities is emerging for the Linux 4.x series, thanks to enhancements that have been included in Linux for to Berkeley Packet Filter (BPF): an in-kernel virtual machine that can execute user space-defined programs. It is finding uses for security auditing and enforcement, enhancing networking (including eXpress Data Path), and performance observability and troubleshooting. Many new open source tools that have been written in the past 12 months for performance analysis that use BPF. Tracing superpowers have finally arrived for Linux!
For its use with tracing, BPF provides the programmable capabilities to the existing tracing frameworks: kprobes, uprobes, and tracepoints. In particular, BPF allows timestamps to be recorded and compared from custom events, allowing latency to be studied in many new places: kernel and application internals. It also allows data to be efficiently summarized in-kernel, including as histograms. This has allowed dozens of new observability tools to be developed so far, including measuring latency distributions for file system I/O and run queue latency, printing details of storage device I/O and TCP retransmits, investigating blocked stack traces and memory leaks, and a whole lot more.
This talk will summarize BPF capabilities and use cases so far, and then focus on its use to enhance Linux tracing, especially with the open source bcc collection. bcc includes BPF versions of old classics, and many new tools, including execsnoop, opensnoop, funcccount, ext4slower, and more (many of which I developed). Perhaps you'd like to develop new tools, or use the existing tools to find performance wins large and small, especially when instrumenting areas that previously had zero visibility. I'll also summarize how we intend to use these new capabilities to enhance systems analysis at Netflix.
Tutorial: Using GoBGP as an IXP connecting routerShu Sugimoto
- Show you how GoBGP can be used as a software router in conjunction with quagga
- (Tutorial) Walk through the setup of IXP connecting router using GoBGP
HKG18-411 - Introduction to OpenAMP which is an open source solution for hete...Linaro
Session ID: HKG18-411
Session Name: HKG18-411 - Introduction to OpenAMP which is an open source solution for heterogeneous system orchestration and communication
Speaker: Wendy Liang
Track: IoT, Embedded
★ Session Summary ★
Introduction to OpenAMP which is an open source solution for heterogeneous system orchestration and communication
---------------------------------------------------
★ Resources ★
Event Page: http://connect.linaro.org/resource/hkg18/hkg18-411/
Presentation: http://connect.linaro.org.s3.amazonaws.com/hkg18/presentations/hkg18-411.pdf
Video: http://connect.linaro.org.s3.amazonaws.com/hkg18/videos/hkg18-411.mp4
---------------------------------------------------
★ Event Details ★
Linaro Connect Hong Kong 2018 (HKG18)
19-23 March 2018
Regal Airport Hotel Hong Kong
---------------------------------------------------
Keyword: IoT, Embedded
'http://www.linaro.org'
'http://connect.linaro.org'
---------------------------------------------------
Follow us on Social Media
https://www.facebook.com/LinaroOrg
https://www.youtube.com/user/linaroorg?sub_confirmation=1
https://www.linkedin.com/company/1026961
OpenStack 운영을 통해 얻은 교훈을 공유합니다.
목차
1. TOAST 클라우드 지금의 모습
2. OpenStack 선택의 이유
3. 구성의 어려움과 극복 사례
4. 활용 사례
5. 풀어야 할 문제들
대상
- TOAST 클라우드를 사용하고 싶은 분
- WMI를 처음 들어보시는 분
A Kernel of Truth: Intrusion Detection and Attestation with eBPFoholiab
"Attestation is hard" is something you might hear from security researchers tracking nation states and APTs, but it's actually pretty true for most network-connected systems!
Modern deployment methodologies mean that disparate teams create workloads for shared worker-hosts (ranging from Jenkins to Kubernetes and all the other orchestrators and CI tools in-between), meaning that at any given moment your hosts could be running any one of a number of services, connecting to who-knows-what on the internet.
So when your network-based intrusion detection system (IDS) opaquely declares that one of these machines has made an "anomalous" network connection, how do you even determine if it's business as usual? Sure you can log on to the host to try and figure it out, but (in case you hadn't noticed) computers are pretty fast these days, and once the connection is closed it might as well not have happened... Assuming it wasn't actually a reverse shell...
At Yelp we turned to the Linux kernel to tell us whodunit! Utilizing the Linux kernel's eBPF subsystem - an in-kernel VM with syscall hooking capabilities - we're able to aggregate metadata about the calling process tree for any internet-bound TCP connection by filtering IPs and ports in-kernel and enriching with process tree information in userland. The result is "pidtree-bcc": a supplementary IDS. Now whenever there's an alert for a suspicious connection, we just search for it in our SIEM (spoiler alert: it's nearly always an engineer doing something "innovative")! And the cherry on top? It's stupid fast with negligible overhead, creating a much higher signal-to-noise ratio than the kernels firehose-like audit subsystems.
This talk will look at how you can tune the signal-to-noise ratio of your IDS by making it reflect your business logic and common usage patterns, get more work done by reducing MTTR for false positives, use eBPF and the kernel to do all the hard work for you, accidentally load test your new IDS by not filtering all RFC-1918 addresses, and abuse Docker to get to production ASAP!
As well as looking at some of the technologies that the kernel puts at your disposal, this talk will also tell pidtree-bcc's road from hackathon project to production system and how focus on demonstrating business value early on allowed the organization to give us buy-in to build and deploy a brand new project from scratch.
Ironic is a modern open-source tool for hardware provisioning. Combining a RESTful API, a scale-out control plane, and pluggable hardware drivers for both in- and out-of-band management, Ironic installs operating systems in a fast, efficient, and reliable fashion.
In fact, Ironic does not “install” an operating system in the traditional sense – it doesn’t use a kickstart/preseed file or an ISO image. Instead, compressed machine images are copied onto each host, and a minimal configuration (IP, host name, SSH keys) is applied at first boot. This guarantees the consistency of the initial state of each machine in a way that traditional installers do not. Bonus: it’s also faster!
With a vibrant community of developers from the most popular server hardware vendors, Ironic’s support for many of the latest and greatest management technologies is coming directly from the creators of these technologies. Meanwhile, the project’s leaders work to create a common abstraction layer that provides a consistent experience across all supported hardware. But Ironic is still a young project – it was only started in 2013 – and there is much on the roadmap.
In this session, Devananda will demonstrate how to install Ironic with Ansible, modify a cloud image for bare metal, and deploy it to a server. He will discuss the history and architecture of the project, and its current goals and challenges. Attendees should be familiar with the task of hardware provisioning and standards like PXE and IPMI, but do not need deep knowledge of related tools.
Linux Performance Analysis: New Tools and Old SecretsBrendan Gregg
Talk for USENIX/LISA2014 by Brendan Gregg, Netflix. At Netflix performance is crucial, and we use many high to low level tools to analyze our stack in different ways. In this talk, I will introduce new system observability tools we are using at Netflix, which I've ported from my DTraceToolkit, and are intended for our Linux 3.2 cloud instances. These show that Linux can do more than you may think, by using creative hacks and workarounds with existing kernel features (ftrace, perf_events). While these are solving issues on current versions of Linux, I'll also briefly summarize the future in this space: eBPF, ktap, SystemTap, sysdig, etc.
MoP(MQTT on Pulsar) - a Powerful Tool for Apache Pulsar in IoT - Pulsar Summi...StreamNative
MQTT (Message Queuing Telemetry Transport,) is a message protocol based on the pub/sub model with the advantages of compact message structure, low resource consumption, and high efficiency, which is suitable for IoT applications with low bandwidth and unstable network environments.
This session will introduce MQTT on Pulsar, which allows developers users of MQTT transport protocol to use Apache Pulsar. I will share the architecture, principles and future planning of MoP, to help you understand Apache Pulsar's capabilities and practices in the IoT industry.
eBPF is an exciting new technology that is poised to transform Linux performance engineering. eBPF enables users to dynamically and programatically trace any kernel or user space code path, safely and efficiently. However, understanding eBPF is not so simple. The goal of this talk is to give audiences a fundamental understanding of eBPF, how it interconnects existing Linux tracing technologies, and provides a powerful aplatform to solve any Linux performance problem.
OVN (Open Virtual Network) を用いる事により、OVS (Open vSwitch)が動作する複数のサーバー(Hypervisor/Chassis)を横断する仮想ネットワークを構築する事ができます。
本スライドはOVNを用いた論理ネットワークの構成と設定サンプルのメモとなります。
Using OVN, you can build logical network among multiple servers (Hypervisor/Chassis) running OVS (Open vSwitch).
This slide is describes HOW TO example of OVN configuration to create 2 logical switch connecting 4 VMs running on 2 chassis.
The monolith to cloud-native, microservices evolution has driven a shift from monitoring to observability. OpenTelemetry, a merger of the OpenTracing and OpenCensus projects, is enabling Observability 2.0. This talk covers the fundamental concepts of observability and then demonstrates how to instrument your applications using the OpenTelemetry libraries.
From KubeCon to ContainerDays, eBPF is trendy in the Cloud Native world. What is eBPF, and why is it revolutionary, and what can it bring to you specifically?
Through concrete examples applied to observability, networking, and security, this talk will explain the principles of eBPF and its concrete advantages to connect and secure Cloud Native applications.
This talk will explain what is eBPF, why it is revolutionary is several fields, give examples of tools using eBPF and what they gain from it, and open up to the future of that technology.
Presentation from the Spring 2011 OpenStack Design Summit. Blueprint URL is https://blueprints.launchpad.net/openstack-devel/+spec/openstack-deployment-cookbooks
Adrian Otto from Rackspace will present "Docker 102", This includes a summary of Docker 101 as a refresher from the August session, and builds upon that by discussing who should use a registry, and what options are available for keeping them private. We will discuss best practices for keeping your production environments evergreen with updated operating system environments, library dependencies, and maintaining an immutable infrastructure.
Learn how to package the HPCC Systems Platform in a Docker container and deploy it locally, and build an HPCC Systems Platform AMI followed by an AWS deployment.
Ansible is the simplest way to automate. SymfonyCafe, 2015Alex S
Ansible is a radically simple IT automation engine. This is new and great configuration management system (like Chef, Puppet) that has been created in 2012 year. Also Ansible is pretty simple and flexible system, that helps you in managing your servers and execute Ad-hoc commands.
Austin OpenStack Meetup December 2012 presentation. The first part of the session was Chef for OpenStack, the second was Q&A about AT&T's OpenStack private cloud deployments to multiple data centers.
openATTIC is the webUI for managing ceph storage in SUSE Linux and it is also accepted upstream as part of the default managing UI. Within openATTIC, it contains lots of different projects to provide all the functions including salt, Grafana and Prometheus.
This will not be a ceph or openATTIC focus talk, even we use it as the example of showing how everything work together. Instead we will look into openATTIC to see how each project work with each other. Mainly focus on Grafana and Prometheus, they are not only very useful for ceph and openATTIC but also equally powerful for monitoring your clusters, vm or cloud / container status.
Both Grafana and Prometheus are very easy to extend, which allow user or administrator to build the dashboard which fit their own need. Even the presentation example will be base on ceph / storage. Participants can use the same idea to monitor any system status they wanted after understand how they work.
In software engineering, the right architecture is essential for robust, scalable platforms. Wix has undergone a pivotal shift from event sourcing to a CRUD-based model for its microservices. This talk will chart the course of this pivotal journey.
Event sourcing, which records state changes as immutable events, provided robust auditing and "time travel" debugging for Wix Stores' microservices. Despite its benefits, the complexity it introduced in state management slowed development. Wix responded by adopting a simpler, unified CRUD model. This talk will explore the challenges of event sourcing and the advantages of Wix's new "CRUD on steroids" approach, which streamlines API integration and domain event management while preserving data integrity and system resilience.
Participants will gain valuable insights into Wix's strategies for ensuring atomicity in database updates and event production, as well as caching, materialization, and performance optimization techniques within a distributed system.
Join us to discover how Wix has mastered the art of balancing simplicity and extensibility, and learn how the re-adoption of the modest CRUD has turbocharged their development velocity, resilience, and scalability in a high-growth environment.
Modern design is crucial in today's digital environment, and this is especially true for SharePoint intranets. The design of these digital hubs is critical to user engagement and productivity enhancement. They are the cornerstone of internal collaboration and interaction within enterprises.
Understanding Globus Data Transfers with NetSageGlobus
NetSage is an open privacy-aware network measurement, analysis, and visualization service designed to help end-users visualize and reason about large data transfers. NetSage traditionally has used a combination of passive measurements, including SNMP and flow data, as well as active measurements, mainly perfSONAR, to provide longitudinal network performance data visualization. It has been deployed by dozens of networks world wide, and is supported domestically by the Engagement and Performance Operations Center (EPOC), NSF #2328479. We have recently expanded the NetSage data sources to include logs for Globus data transfers, following the same privacy-preserving approach as for Flow data. Using the logs for the Texas Advanced Computing Center (TACC) as an example, this talk will walk through several different example use cases that NetSage can answer, including: Who is using Globus to share data with my institution, and what kind of performance are they able to achieve? How many transfers has Globus supported for us? Which sites are we sharing the most data with, and how is that changing over time? How is my site using Globus to move data internally, and what kind of performance do we see for those transfers? What percentage of data transfers at my institution used Globus, and how did the overall data transfer performance compare to the Globus users?
top nidhi software solution freedownloadvrstrong314
This presentation emphasizes the importance of data security and legal compliance for Nidhi companies in India. It highlights how online Nidhi software solutions, like Vector Nidhi Software, offer advanced features tailored to these needs. Key aspects include encryption, access controls, and audit trails to ensure data security. The software complies with regulatory guidelines from the MCA and RBI and adheres to Nidhi Rules, 2014. With customizable, user-friendly interfaces and real-time features, these Nidhi software solutions enhance efficiency, support growth, and provide exceptional member services. The presentation concludes with contact information for further inquiries.
Strategies for Successful Data Migration Tools.pptxvarshanayak241
Data migration is a complex but essential task for organizations aiming to modernize their IT infrastructure and leverage new technologies. By understanding common challenges and implementing these strategies, businesses can achieve a successful migration with minimal disruption. Data Migration Tool like Ask On Data play a pivotal role in this journey, offering features that streamline the process, ensure data integrity, and maintain security. With the right approach and tools, organizations can turn the challenge of data migration into an opportunity for growth and innovation.
Enhancing Research Orchestration Capabilities at ORNL.pdfGlobus
Cross-facility research orchestration comes with ever-changing constraints regarding the availability and suitability of various compute and data resources. In short, a flexible data and processing fabric is needed to enable the dynamic redirection of data and compute tasks throughout the lifecycle of an experiment. In this talk, we illustrate how we easily leveraged Globus services to instrument the ACE research testbed at the Oak Ridge Leadership Computing Facility with flexible data and task orchestration capabilities.
Advanced Flow Concepts Every Developer Should KnowPeter Caitens
Tim Combridge from Sensible Giraffe and Salesforce Ben presents some important tips that all developers should know when dealing with Flows in Salesforce.
TROUBLESHOOTING 9 TYPES OF OUTOFMEMORYERRORTier1 app
Even though at surface level ‘java.lang.OutOfMemoryError’ appears as one single error; underlyingly there are 9 types of OutOfMemoryError. Each type of OutOfMemoryError has different causes, diagnosis approaches and solutions. This session equips you with the knowledge, tools, and techniques needed to troubleshoot and conquer OutOfMemoryError in all its forms, ensuring smoother, more efficient Java applications.
Check out the webinar slides to learn more about how XfilesPro transforms Salesforce document management by leveraging its world-class applications. For more details, please connect with sales@xfilespro.com
If you want to watch the on-demand webinar, please click here: https://www.xfilespro.com/webinars/salesforce-document-management-2-0-smarter-faster-better/
Multiple Your Crypto Portfolio with the Innovative Features of Advanced Crypt...Hivelance Technology
Cryptocurrency trading bots are computer programs designed to automate buying, selling, and managing cryptocurrency transactions. These bots utilize advanced algorithms and machine learning techniques to analyze market data, identify trading opportunities, and execute trades on behalf of their users. By automating the decision-making process, crypto trading bots can react to market changes faster than human traders
Hivelance, a leading provider of cryptocurrency trading bot development services, stands out as the premier choice for crypto traders and developers. Hivelance boasts a team of seasoned cryptocurrency experts and software engineers who deeply understand the crypto market and the latest trends in automated trading, Hivelance leverages the latest technologies and tools in the industry, including advanced AI and machine learning algorithms, to create highly efficient and adaptable crypto trading bots
Experience our free, in-depth three-part Tendenci Platform Corporate Membership Management workshop series! In Session 1 on May 14th, 2024, we began with an Introduction and Setup, mastering the configuration of your Corporate Membership Module settings to establish membership types, applications, and more. Then, on May 16th, 2024, in Session 2, we focused on binding individual members to a Corporate Membership and Corporate Reps, teaching you how to add individual members and assign Corporate Representatives to manage dues, renewals, and associated members. Finally, on May 28th, 2024, in Session 3, we covered questions and concerns, addressing any queries or issues you may have.
For more Tendenci AMS events, check out www.tendenci.com/events
First Steps with Globus Compute Multi-User EndpointsGlobus
In this presentation we will share our experiences around getting started with the Globus Compute multi-user endpoint. Working with the Pharmacology group at the University of Auckland, we have previously written an application using Globus Compute that can offload computationally expensive steps in the researcher's workflows, which they wish to manage from their familiar Windows environments, onto the NeSI (New Zealand eScience Infrastructure) cluster. Some of the challenges we have encountered were that each researcher had to set up and manage their own single-user globus compute endpoint and that the workloads had varying resource requirements (CPUs, memory and wall time) between different runs. We hope that the multi-user endpoint will help to address these challenges and share an update on our progress here.
Code reviews are vital for ensuring good code quality. They serve as one of our last lines of defense against bugs and subpar code reaching production.
Yet, they often turn into annoying tasks riddled with frustration, hostility, unclear feedback and lack of standards. How can we improve this crucial process?
In this session we will cover:
- The Art of Effective Code Reviews
- Streamlining the Review Process
- Elevating Reviews with Automated Tools
By the end of this presentation, you'll have the knowledge on how to organize and improve your code review proces
Cyaniclab : Software Development Agency Portfolio.pdfCyanic lab
CyanicLab, an offshore custom software development company based in Sweden,India, Finland, is your go-to partner for startup development and innovative web design solutions. Our expert team specializes in crafting cutting-edge software tailored to meet the unique needs of startups and established enterprises alike. From conceptualization to execution, we offer comprehensive services including web and mobile app development, UI/UX design, and ongoing software maintenance. Ready to elevate your business? Contact CyanicLab today and let us propel your vision to success with our top-notch IT solutions.
We describe the deployment and use of Globus Compute for remote computation. This content is aimed at researchers who wish to compute on remote resources using a unified programming interface, as well as system administrators who will deploy and operate Globus Compute services on their research computing infrastructure.
Unleash Unlimited Potential with One-Time Purchase
BoxLang is more than just a language; it's a community. By choosing a Visionary License, you're not just investing in your success, you're actively contributing to the ongoing development and support of BoxLang.
Providing Globus Services to Users of JASMIN for Environmental Data AnalysisGlobus
JASMIN is the UK’s high-performance data analysis platform for environmental science, operated by STFC on behalf of the UK Natural Environment Research Council (NERC). In addition to its role in hosting the CEDA Archive (NERC’s long-term repository for climate, atmospheric science & Earth observation data in the UK), JASMIN provides a collaborative platform to a community of around 2,000 scientists in the UK and beyond, providing nearly 400 environmental science projects with working space, compute resources and tools to facilitate their work. High-performance data transfer into and out of JASMIN has always been a key feature, with many scientists bringing model outputs from supercomputers elsewhere in the UK, to analyse against observational or other model data in the CEDA Archive. A growing number of JASMIN users are now realising the benefits of using the Globus service to provide reliable and efficient data movement and other tasks in this and other contexts. Further use cases involve long-distance (intercontinental) transfers to and from JASMIN, and collecting results from a mobile atmospheric radar system, pushing data to JASMIN via a lightweight Globus deployment. We provide details of how Globus fits into our current infrastructure, our experience of the recent migration to GCSv5.4, and of our interest in developing use of the wider ecosystem of Globus services for the benefit of our user community.
Innovating Inference - Remote Triggering of Large Language Models on HPC Clus...Globus
Large Language Models (LLMs) are currently the center of attention in the tech world, particularly for their potential to advance research. In this presentation, we'll explore a straightforward and effective method for quickly initiating inference runs on supercomputers using the vLLM tool with Globus Compute, specifically on the Polaris system at ALCF. We'll begin by briefly discussing the popularity and applications of LLMs in various fields. Following this, we will introduce the vLLM tool, and explain how it integrates with Globus Compute to efficiently manage LLM operations on Polaris. Attendees will learn the practical aspects of setting up and remotely triggering LLMs from local machines, focusing on ease of use and efficiency. This talk is ideal for researchers and practitioners looking to leverage the power of LLMs in their work, offering a clear guide to harnessing supercomputing resources for quick and effective LLM inference.
5. StackHPC
Today’s Session Plan
• Introduction to Kolla
• Introduction to Kolla-Ansible
• Introduction to Kayobe
• Introduction to Tenks
• End-to-end deploy of OpenStack
• Reconfigure the deployment
• Anything else!
6. StackHPC
Kolla and Kolla-Ansible
• Containerised control plane using Kolla
• Kolla - Docker containers for OpenStack
• Follows application container pattern
• Kolla-Ansible
• Deploys a containerised control plane in
a simple, flexible manner.
• Broad support for OpenStack services.
• Ansible keeps things (relatively) simple
7. StackHPC
Kayobe
• Completes Kolla-Ansible with missing
functionality:
• Bare metal deployment of control
plane
• Equivalent of TripleO’s undercloud
• Configuration of control plane host
OS
• Bare metal compute node
management
• Infrastructure-as-Code
8. StackHPC
Kayobe - Infrastructure as Code
Ansible
Control
Host
Seed
Host
Network
Devices
Control
Plane
Hosts
Bare Metal
Compute Hosts
Configures
Manages
Provisions ProvisionsControl
Plane
Hosts
Control
Plane
Hosts
Control
Plane
Hosts
Bare Metal
Compute Hosts
Bare Metal
Compute Hosts
Bare Metal
Compute Hosts
Bare Metal
Compute Hosts
Bare Metal
Compute Hosts
Bare Metal
Compute Hosts
Bare Metal
Compute Hosts
Bare Metal
Compute Hosts
9. StackHPC
Tenks
• A Testing and Development tool
• Virtual models for bare metal
• Uses KVM and VirtualBMC
• Looks like a server with IPMI to
Ironic
• For more information:
https://www.stackhpc.com/
tenks.html
English Spoons by Grenadille, CC-BY-SA-4.0
10. StackHPC
Bringing it all Together
braio
seedseed
bifrost
registry
controller0 compute0controller0 compute0
galera
haproxy
rabbitmq
fluentd
keystone
glance
nova
neutron
fluentd
neutron
nova
demo1
• Login to lab host
• Start Seed VM & services
• Tenks defines control plane
• Bifrost inspects & provisions
• Kolla-Ansible deploys & configures
• Boot demo VM instance
• Anything else!
11. StackHPC
Connect to the Lab Host
• Claim a lab host from the lab etherpad and put your name to it:
https://etherpad.openstack.org/p/a-universe-from-nothing
• Log in with the lab user:
ssh lab@<ip-of-lab-host>
• Change lab user password to avoid mishap:
passwd
• Start a screen session in case your connection drops:
screen -drR
12. StackHPC
Start up the Seed VM
• Check if seed VM is running:
sudo virsh list --all
• If it is not already running, start it up:
sudo virsh start seed
• Change directory to the Kayobe workspace:
cd ~/kayobe
13. StackHPC
Create Control Plane Instances
• Here we set up our model development environment, alongside the
seed VM.
• Install Tenks and control plane instance configuration:
export TENKS_CONFIG_PATH=config/src/kayobe-config/tenks.yml
./dev/tenks-deploy.sh ./tenks
• Activate the Kayobe environment, to allow running commands
directly:
source dev/environment-setup.sh
14. StackHPC
What just happened?
• Check that the control plane hosts were defined:
sudo virsh list --all
• Look at the state added to Bifrost:
ssh stack@192.168.33.5
sudo docker exec -it bifrost_deploy bash
source env-vars
openstack baremetal node list
+--------------------------------------+-------------+---------------+-------------+--------------------+-------------+
| UUID | Name | Instance UUID | Power State | Provisioning State | Maintenance |
+--------------------------------------+-------------+---------------+-------------+--------------------+-------------+
| a1f8bd7c-bb15-48fa-9f04-811434affe80 | compute0 | None | power off | available | False |
| 16dced5c-9afa-448d-8217-2c2697ba44cb | controller0 | None | power off | available | False |
+--------------------------------------+-------------+---------------+-------------+--------------------+-------------+
15. StackHPC
Inspect and provision the control plane
• Invoke Kayobe to extract control plane host data from Bifrost:
kayobe overcloud inventory discover
• Inspect our control plane hosts:
kayobe overcloud hardware inspect
• Deploy the host base software image:
kayobe overcloud provision
• Configure the control plane hosts for OpenStack:
kayobe overcloud host configure
16. StackHPC
Deploy and configure OpenStack
• Install the Kolla-Ansible containers:
kayobe overcloud container image pull
• Install and configure Kolla-Ansible OpenStack:
kayobe overcloud service deploy
• Apply post-deploy initial config (mostly Ironic, here for
completeness):
source config/src/kayobe-config/etc/kolla/public-openrc.sh
kayobe overcloud post configure
17. StackHPC
Boot a VM
• Register some resources (keys, flavors, networks, images, etc):
source config/src/kayobe-config/etc/kolla/public-openrc.sh
./config/src/kayobe-config/init-runonce.sh
• Source environment and boot a VM:
source ~/os-venv/bin/activate
openstack server create --image cirros
--flavor m1.tiny --key-name mykey
--network demo-net demo1
18. StackHPC
Connect to the VM
• Assign a floating IP to the server to make it accessible:
openstack floating ip create public1
fip=$(openstack floating ip list -f value
-c 'Floating IP Address’ --status DOWN |
head -n 1)
openstack server add floating ip demo1 $fip
• Check SSH access to our VM:
ssh cirros@$fip
19. StackHPC
Access Horizon
• Extract admin credentials
source config/src/kayobe-config/etc/kolla/public-openrc.sh
echo $OS_PASSWORD
• Open a web browser to your lab host IP and login with the admin
account
• NB: VNC URLs are not rewritten to account for port-forwarding
(you’ll need to do that yourself)
20. StackHPC
Let’s have some more fun!
• Reconfigure the control plane to deploy ElasticSearch, Kibana and
centralised log aggregation
• Edit config/src/kayobe-config/etc/kayobe/kolla.yml
• Change value:
-#kolla_enable_central_logging:
+kolla_enable_central_logging: yes
21. StackHPC
Look before you leap!
• Save all the config for the control plane:
mkdir ~/config-before
kayobe overcloud service configuration save
--output-dir ~/config-before
• Generate new config as a dry run:
kayobe overcloud service configuration generate
--node-config-dir /tmp/config-new
• Gather next config for comparison of changes:
mkdir ~/config-after
kayobe overcloud service configuration save
--output-dir ~/config-after
22. StackHPC
OK lets do it
• Bring down the new containers we need:
kayobe overcloud container image pull
• Make the control plane reconfiguration:
kayobe overcloud service deploy
23. StackHPC
Lab host access to Kibana
• Check the new containers are installed and running on
controller0 (192.168.33.3):
ssh stack@192.168.33.3 sudo docker ps
• Update forwarding config script configure-local-
networking.sh to add port 5601 for Kibana, and run it again.
• Get the password set for the kibana user from Kolla-Ansible:
grep kibana config/src/kayobe-config/etc/kolla/passwords.yml
• Open the lab host URL with port 5601 to access the logs!