Downloaded 24 times
![Contact information Sergio Sanchez Executive Director Clean Air Institute [email_address] 1 (202) 785 4222 x 30](https://image.slidesharecdn.com/sergio-sanchez-1232641742401127-2/85/A-Regional-Perspective-from-Latin-America-13-320.jpg)

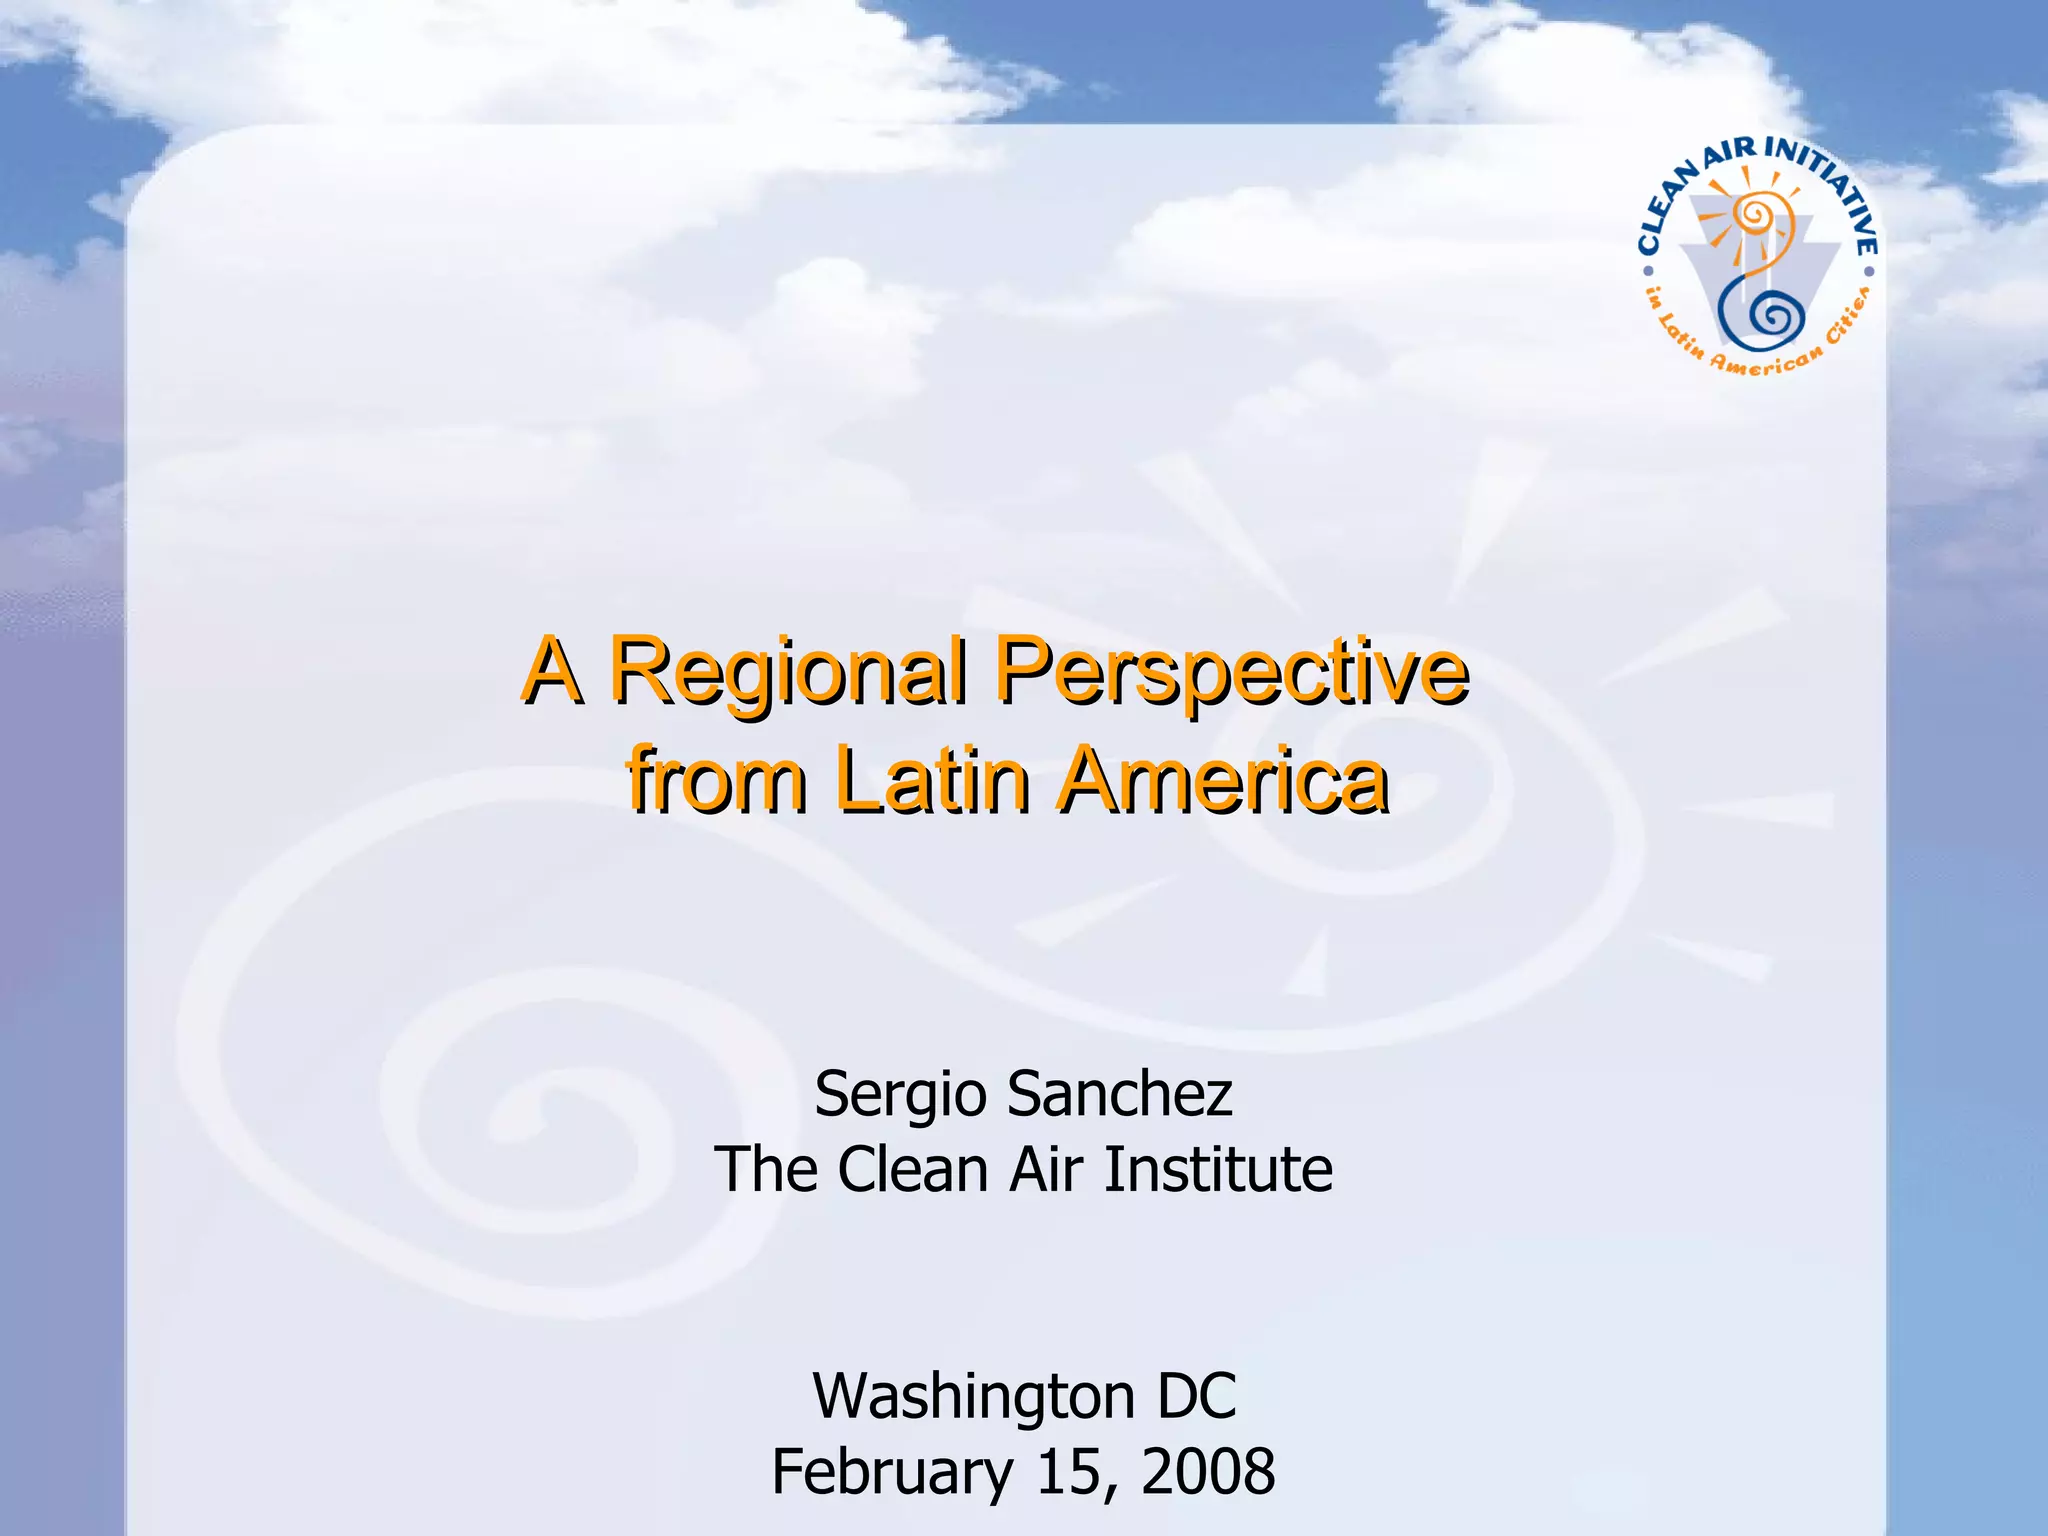
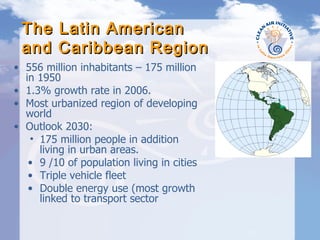
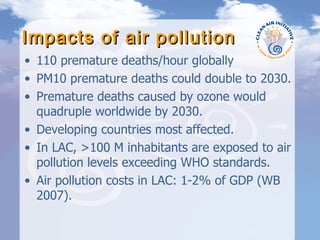
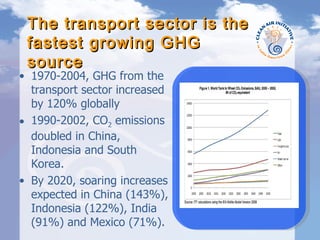
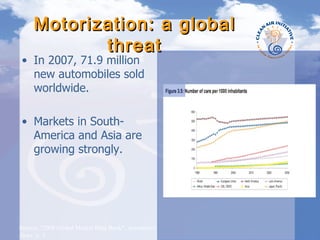
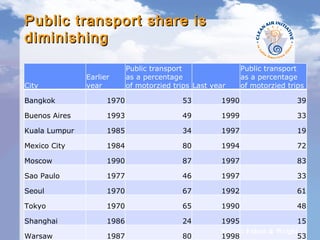
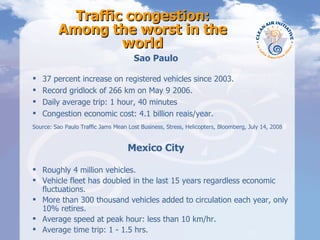
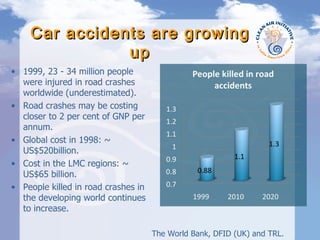
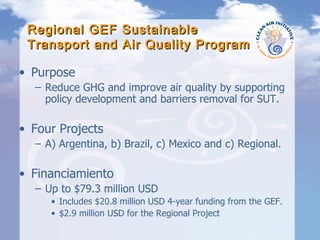
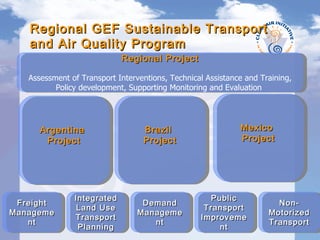
The document discusses air pollution and transportation issues in Latin America. It notes that the transportation sector is the largest source of air pollution in most Latin American cities. Air pollution levels exceed WHO standards for over 100 million people in the region and cost Latin American countries 1-2% of GDP in health impacts. Traffic congestion is among the worst in the world in cities like Sao Paulo and Mexico City, costing billions annually in lost time and productivity. Regional cooperation through projects like the GEF Sustainable Transport and Air Quality Program aim to reduce emissions and improve air quality through sustainable transportation planning.


