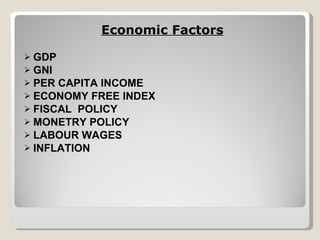
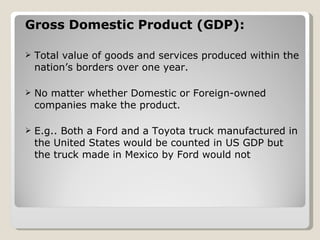
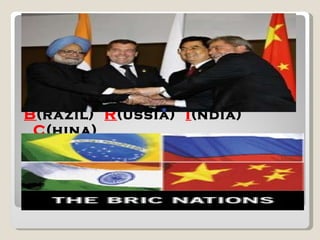
Economic  Factors  concerned to B razil     R ussia   I ndia   C hina By: Sajan  Christudas Jigar  lakhani Sub :  International Business
Economic Factors GDP GNI PER CAPITA INCOME ECONOMY FREE INDEX FISCAL  POLICY MONETRY POLICY LABOUR WAGES INFLATION
Gross Domestic Product (GDP): Total value of goods and services produced within the nation’s borders over one year. No matter whether Domestic or Foreign-owned companies make the product. E.g.. Both a Ford and a Toyota truck manufactured in the United States would be counted in US GDP but the truck made in Mexico by Ford would not
Gross National Income (GNI): GDP plus the income generated from exports, imports and the international operations of a nation’s companies equals GNI. E.g.
THE 10 LARGEST ECONOMIES BY GNI,2005 RANK COUNTRY GNI(US $, MILLIONS) 1 UNITED STATES 12,912,889 2 JAPAN 4,976,464 3 GERMANY 2,875,640 4 UNITED KINGDOM 2,272,716 5 CHINA 2,269,745 6 FRANCE 2,169,169 7 ITALY 1,772,942 8 SPAIN 1,095,876 9 CANADA 1,052,563 10 INDIA 804,967
Per Capita Income: Transforming GNI  by the number of people who live in country. Per Capita Income=Total GNI Divided by the Population of the Country. This helps in explaining the economy’s performance. GNI per Capita,2006 by World Bank Income Groupings High Income  ($11,116 or more) Upper-middle income ($3,596-$11,115) Lower-middle income ($906-$3,595) Low income  ($905 or less)
Economy free index: Economic freedom is the fundamental right of every human to control his or her own labor and property. In an economically free society, individuals are free to work, produce, consume, and invest in any way they please, with that freedom both protected by the state and unconstrained by the state.  .
We measure ten components of economic freedom, Business Freedom Trade Freedom  Fiscal Freedom Government Spending Monetary Freedom Investment Freedom Financial Freedom Property Rights Freedom from Corruption Labor Freedom
Fiscal Policy: Is the policy of the Government pertaining to Public Revenue, Public Expenditure & Public Debt. Tools of Fiscal Policy: Taxation ( VAT, Customs, Income, Corporate, Service, etc) Public Expenditure, Public Debt Deficit Financing.
B (razil)   R (ussia)   I (ndia)   C (hina)
The acronym was first coined and prominently used by Goldman Sachs in 2001. The 4 countries, combined, currently account for more than a quarter of the world’s land area more than 40% of the world’s population. Goldman Sachs predicts : China and India, respectively, to be the dominant global suppliers of manufactured goods and services  Brazil and Russia would become similarly dominant as suppliers of raw materials.
Brazil is dominant in soy and iron ore while Russia has enormous supplies of oil & natural gas. India and China have already started making their presence felt in the service and manufacturing sector respectively in the global arena.
B razil
The  economy of Brazil  is the world ‘ s eigth largest by nominal GDP. The  economic system of Brazil  is standing on a floating exchange rate, a regime that is inflation targeting and a compressed fiscal policy Brazil is one of the fastest growing major economies in the world.
Brazilian labor force is estimated at 100.77 million of which 10% is occupied in agriculture,  19% in the industry sector and 71% in the service sector. GDP (2010)  was 7.6% Brazil reported a government budget surplus equivalent to 2.20 percent of the Gross Domestic Product (GDP) in 2010. Revenues  $354.8 billion  Expenses  $434.9 billion
R ussia
GDP growth   (2010) $2.229 trillion  3.8%( budget surplus $9.6 billion) (2009) $20147 trillion  -7.9%(budget deficit  $18.8billion) (2008) $20331 trillion  5.2% Per Capita  (2010) $15900 (2009) $15300 (2008) $16600 Public Debt (2010) 9.5% of GDP (2009) 8.3% of GDP  Budget revenues (2010) $262 billion (2009) $341.1 billion
About 10% of the  labor force  in the country is involved in agricultural field and the related sectors which credit almost 5% of the total GDP for the country. About 32% of the russian population is employed in the industrial sector which contributes around 34.8% of the total GDP of the country.
I ndia
About 10% of the  labor force  in the country is involved in agricultural field and the related sectors which credit almost 5% of the total GDP for the country. About 32% of the russian population is employed in the industrial sector which contributes around 34.8% of the total GDP of the country.
 
C hina


BRIC

  • 1.
    Economic Factors concerned to B razil R ussia I ndia C hina By: Sajan Christudas Jigar lakhani Sub : International Business
  • 2.
    Economic Factors GDPGNI PER CAPITA INCOME ECONOMY FREE INDEX FISCAL POLICY MONETRY POLICY LABOUR WAGES INFLATION
  • 3.
    Gross Domestic Product(GDP): Total value of goods and services produced within the nation’s borders over one year. No matter whether Domestic or Foreign-owned companies make the product. E.g.. Both a Ford and a Toyota truck manufactured in the United States would be counted in US GDP but the truck made in Mexico by Ford would not
  • 4.
    Gross National Income(GNI): GDP plus the income generated from exports, imports and the international operations of a nation’s companies equals GNI. E.g.
  • 5.
    THE 10 LARGESTECONOMIES BY GNI,2005 RANK COUNTRY GNI(US $, MILLIONS) 1 UNITED STATES 12,912,889 2 JAPAN 4,976,464 3 GERMANY 2,875,640 4 UNITED KINGDOM 2,272,716 5 CHINA 2,269,745 6 FRANCE 2,169,169 7 ITALY 1,772,942 8 SPAIN 1,095,876 9 CANADA 1,052,563 10 INDIA 804,967
  • 6.
    Per Capita Income:Transforming GNI by the number of people who live in country. Per Capita Income=Total GNI Divided by the Population of the Country. This helps in explaining the economy’s performance. GNI per Capita,2006 by World Bank Income Groupings High Income ($11,116 or more) Upper-middle income ($3,596-$11,115) Lower-middle income ($906-$3,595) Low income ($905 or less)
  • 7.
    Economy free index:Economic freedom is the fundamental right of every human to control his or her own labor and property. In an economically free society, individuals are free to work, produce, consume, and invest in any way they please, with that freedom both protected by the state and unconstrained by the state. .
  • 8.
    We measure tencomponents of economic freedom, Business Freedom Trade Freedom Fiscal Freedom Government Spending Monetary Freedom Investment Freedom Financial Freedom Property Rights Freedom from Corruption Labor Freedom
  • 9.
    Fiscal Policy: Isthe policy of the Government pertaining to Public Revenue, Public Expenditure & Public Debt. Tools of Fiscal Policy: Taxation ( VAT, Customs, Income, Corporate, Service, etc) Public Expenditure, Public Debt Deficit Financing.
  • 10.
    B (razil) R (ussia) I (ndia) C (hina)
  • 11.
    The acronym wasfirst coined and prominently used by Goldman Sachs in 2001. The 4 countries, combined, currently account for more than a quarter of the world’s land area more than 40% of the world’s population. Goldman Sachs predicts : China and India, respectively, to be the dominant global suppliers of manufactured goods and services Brazil and Russia would become similarly dominant as suppliers of raw materials.
  • 12.
    Brazil is dominantin soy and iron ore while Russia has enormous supplies of oil & natural gas. India and China have already started making their presence felt in the service and manufacturing sector respectively in the global arena.
  • 13.
  • 14.
    The economyof Brazil is the world ‘ s eigth largest by nominal GDP. The economic system of Brazil is standing on a floating exchange rate, a regime that is inflation targeting and a compressed fiscal policy Brazil is one of the fastest growing major economies in the world.
  • 15.
    Brazilian labor forceis estimated at 100.77 million of which 10% is occupied in agriculture, 19% in the industry sector and 71% in the service sector. GDP (2010) was 7.6% Brazil reported a government budget surplus equivalent to 2.20 percent of the Gross Domestic Product (GDP) in 2010. Revenues $354.8 billion Expenses $434.9 billion
  • 16.
  • 17.
    GDP growth (2010) $2.229 trillion 3.8%( budget surplus $9.6 billion) (2009) $20147 trillion -7.9%(budget deficit $18.8billion) (2008) $20331 trillion 5.2% Per Capita (2010) $15900 (2009) $15300 (2008) $16600 Public Debt (2010) 9.5% of GDP (2009) 8.3% of GDP Budget revenues (2010) $262 billion (2009) $341.1 billion
  • 18.
    About 10% ofthe labor force in the country is involved in agricultural field and the related sectors which credit almost 5% of the total GDP for the country. About 32% of the russian population is employed in the industrial sector which contributes around 34.8% of the total GDP of the country.
  • 19.
  • 20.
    About 10% ofthe labor force in the country is involved in agricultural field and the related sectors which credit almost 5% of the total GDP for the country. About 32% of the russian population is employed in the industrial sector which contributes around 34.8% of the total GDP of the country.
  • 21.
  • 22.
  • 23.
  • 24.